. 2020 Feb;17(2):147-154.
doi: 10.1038/s41592-019-0690-6. Epub 2020 Jan 6.

Benchmarking algorithms for gene regulatory network inference from single-cell transcriptomic data

Affiliations

Benchmarking algorithms for gene regulatory network inference from single-cell transcriptomic data

Aditya Pratapa et al. Nat Methods. 2020 Feb.

Abstract

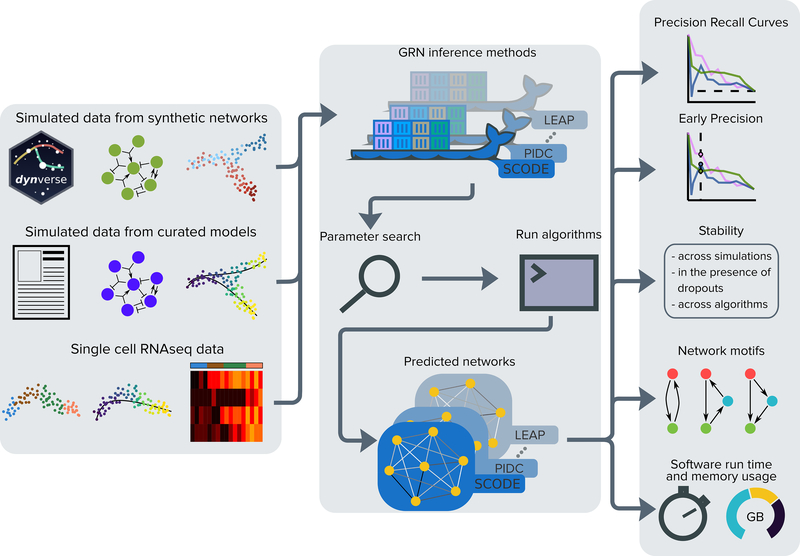
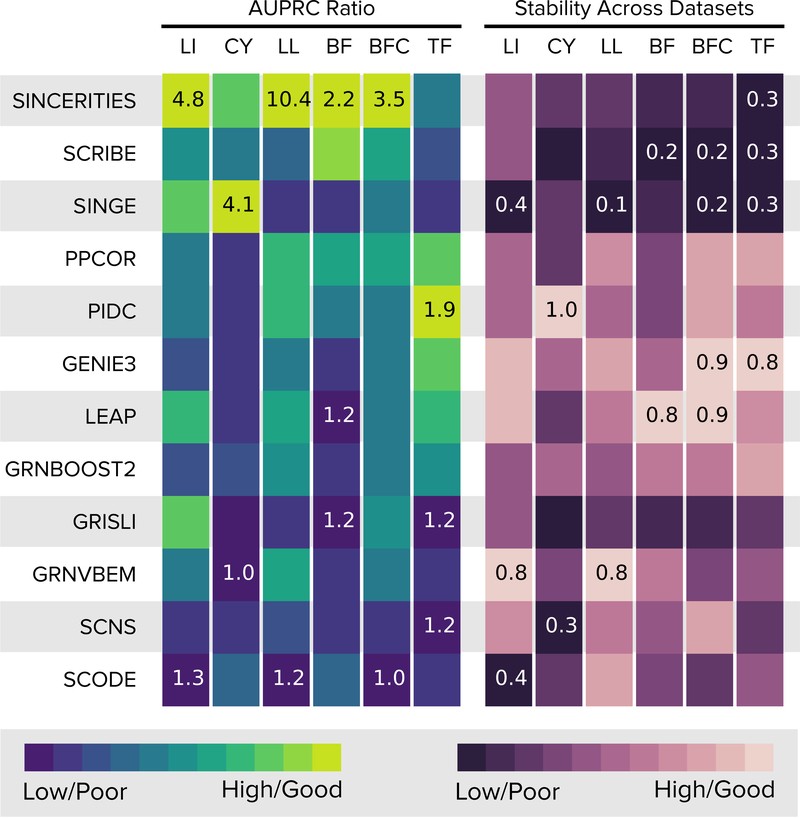
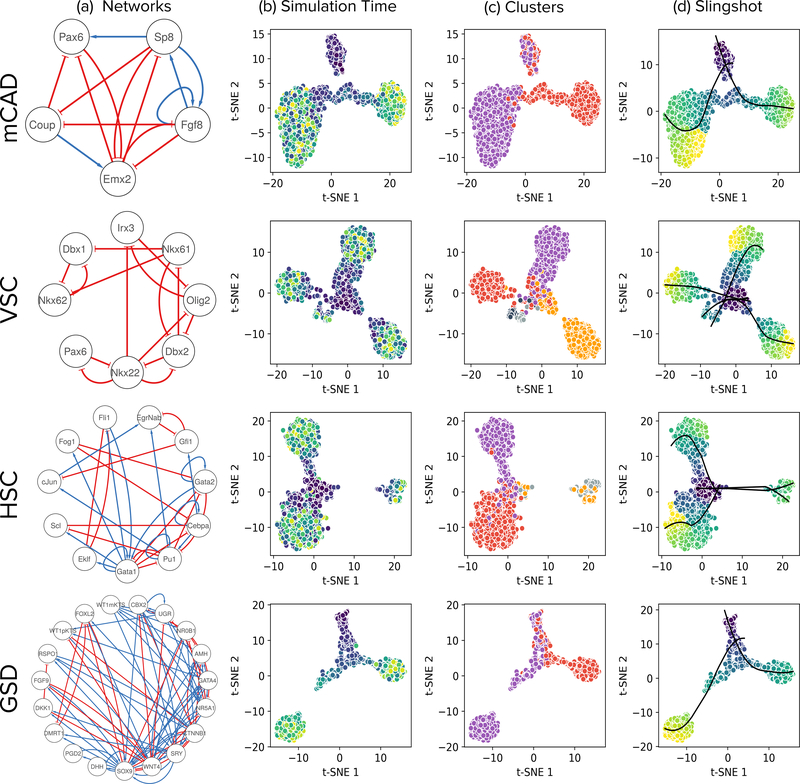
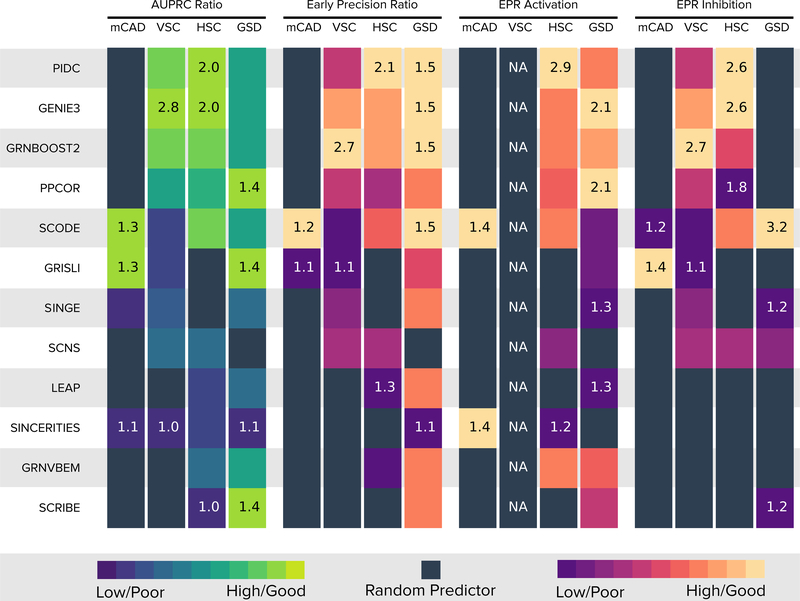
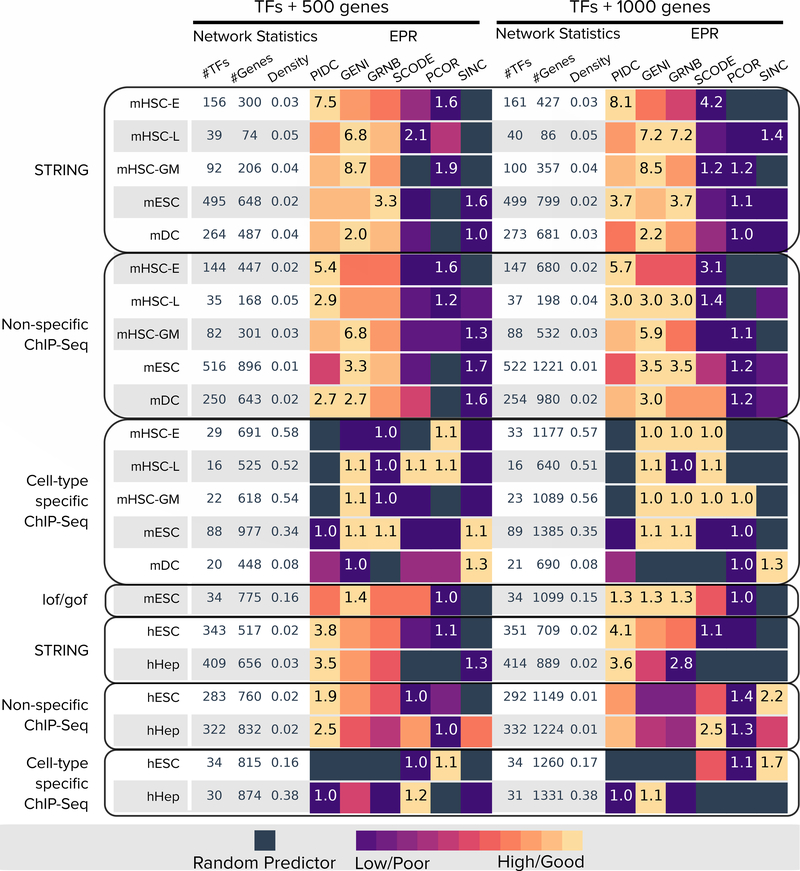
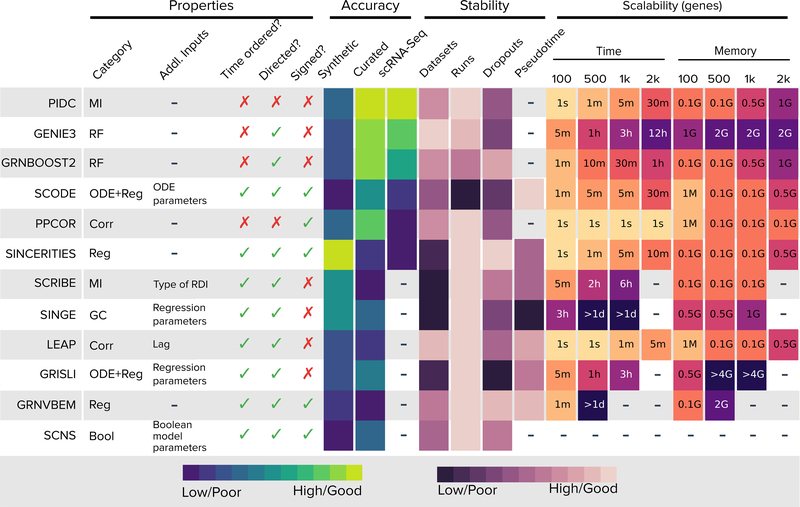
We present a systematic evaluation of state-of-the-art algorithms for inferring gene regulatory networks from single-cell transcriptional data. As the ground truth for assessing accuracy, we use synthetic networks with predictable trajectories, literature-curated Boolean models and diverse transcriptional regulatory networks. We develop a strategy to simulate single-cell transcriptional data from synthetic and Boolean networks that avoids pitfalls of previously used methods. Furthermore, we collect networks from multiple experimental single-cell RNA-seq datasets. We develop an evaluation framework called BEELINE. We find that the area under the precision-recall curve and early precision of the algorithms are moderate. The methods are better in recovering interactions in synthetic networks than Boolean models. The algorithms with the best early precision values for Boolean models also perform well on experimental datasets. Techniques that do not require pseudotime-ordered cells are generally more accurate. Based on these results, we present recommendations to end users. BEELINE will aid the development of gene regulatory network inference algorithms.


Conflict of interest statement

Competing Interests

The authors declare no competing interests.

Figures

Figure 1:
Figure 1:
An overview of the BEELINE evaluation framework. We apply GRN inference algorithms to three types of data: datasets from synthetic networks, datasets from curated Boolean models from the literature, and experimental single-cell transcriptional measurements. We process each dataset through a uniform pipeline: pre-processing, Docker containers for 12 GRN inference algorithms, parameter estimation, post-processing, and evaluation. We compare algorithms based on accuracy (AUPRC and early precision), stability of results (across simulations, in the presence of dropouts, and across algorithms), analysis of network motifs, and scalability.
Figure 2:
Figure 2:
Summary of results for datasets from synthetic networks. The first six columns display the median AUPRC ratios for the 20 datasets with 2,000 and 5,000 cells, with algorithms (rows) ordered in decreasing order of the median of the median per-network AUPRC ratios. The next set of six columns display the median stability scores across multiple datasets (Online Methods). For each network, the color in each cell is proportional to the corresponding value (scaled between 0 and 1). We display the highest and lowest values for each network inside the corresponding cells. Abbreviations: LI: Linear, CY: Cycle, LL: Linear Long, BF: Bifurcating, BFC: Bifurcating Converging, TF: Trifurcating.
Figure 3:
Figure 3:
Visualization of t-SNE projections of simulations reveals trajectories leading to steady states that correspond to those of the curated models. Each row in the figure corresponds to a model, indicated on the left: Mammalian Cortical Area Development (mCAD), Ventral Spinal Cord Development (VSC), Hematopoietic Stem Cell Differentiation (HSC), and Gonadal Sex Determination (GSD). (a) Network diagrams of the models. (b) t-SNE visualizations of 2,000 cells sampled from BoolODE output. The color of each point indicates the corresponding simulation time. (c) Each color corresponds to a different subset of cells obtained by using k-means clustering of simulations, with k set to the number of steady states reported in the relevant publication (two for mCAD, five for VSC, four for HSC, and two for GSD). (d) Pseudotimes and principal curves (black) computed by Slingshot showing correspondence with simulation times in (b) and clusters in (c), respectively. Colors of simulation time and pseudotime: blue for early, green for intermediate, and yellow for later.
Figure 4:
Figure 4:
Summary of results for 10 datasets without dropouts from curated models. Rows corresponds to algorithms ordered by decreasing median of the per-model median AUPRC ratios. The four sets of four columns each display the median AUPRC ratios, median early precision ratio (EPR), median EPR for activating edges, and median EPR for inhibitory edges. For each model, the color in each cell is proportional to the corresponding value (scaled between 0 and 1, ignoring values that are less than that of a random predictor, shown as black squares). We display the highest and lowest values for each model inside the corresponding cells.
Figure 5:
Figure 5:
Summary of EPR results for experimental single-cell RNA-seq datasets. The left half of the figure (TFs+500 genes) shows results for datasets composed of all significantly-varying TFs and the 500 most-varying genes. Each row corresponds to one scRNA-seq dataset. The first three columns report network statistics. The next six columns report EPR values. The right half (TFs+1000 genes) shows results for all significantly-varying TFs and the 1000 most-varying genes. In both sections, algorithms are sorted by median EPR across the datasets (rows) for the TFs+500 gene set. For each dataset, the color in each cell is proportional to the corresponding value scaled between 0 and 1 (ignoring values that are less than that of a random predictor, which are shown as black squares). We display the highest and lowest values for each dataset inside the corresponding cells. Abbreviations: GENI: GENIE3, GRNB: GRNBoost2, PCOR: PPCOR, SINC: SINCERIETIES.
Figure 6:
Figure 6:
Summary of properties of GRN inference algorithms and results obtained from BEELINE. Each row corresponds to one of the algorithms included in our evaluation. The first six columns display algorithm methodology, required additional inputs, whether the method needs cells to be time-ordered, and whether the inferred edges are directed and signed. The next three columns summarize the results in Figures 2, 4, and 5. The next four columns present results for different types of stability. The final set of columns contain the running time and memory usage. For the “Pseudotime” column, we only considered the seven methods that required these values, ignoring SCNS due to its long execution time. See “Methods” for details on how we generated this figure. Abbreviations: MI: Mutual Information, RF: Random Forest, Corr: Correlation, Reg: Regression, GC: Granger Causality, Bool: Boolean Model.

References

    1. Villani AC et al. Single-cell RNA-seq reveals new types of human blood dendritic cells, monocytes, and progenitors. Science (80-. ). 356, (2017). - PMC - PubMed
    1. Rozenblatt-Rosen O, Stubbington MJT, Regev A & Teichmann SA The Human Cell Atlas: from vision to reality. Nature 550, 451–453 (2017). - PubMed
    1. Wagner A, Regev A & Yosef N Revealing the vectors of cellular identity with single-cell genomics. Nat. Biotechnol. 34, 1145–1160 (2016). - PMC - PubMed
    1. Kharchenko PV, Silberstein L & Scadden DT Bayesian approach to single-cell differential expression analysis. Nat. Methods 11, 740–742 (2014). - PMC - PubMed
    1. Buettner F et al. Computational analysis of cell-to-cell heterogeneity in single-cell RNA-sequencing data reveals hidden subpopulations of cells. Nat. Biotechnol. (2015). doi:10.1038/nbt.3102 - DOI - PubMed

Publication types