. 2020 Jan;27(1):78-83.
doi: 10.1038/s41594-019-0357-0. Epub 2020 Jan 6.

A bipartite structural organization defines the SERINC family of HIV-1 restriction factors

Affiliations

A bipartite structural organization defines the SERINC family of HIV-1 restriction factors

Valerie E Pye et al. Nat Struct Mol Biol. 2020 Jan.

Abstract

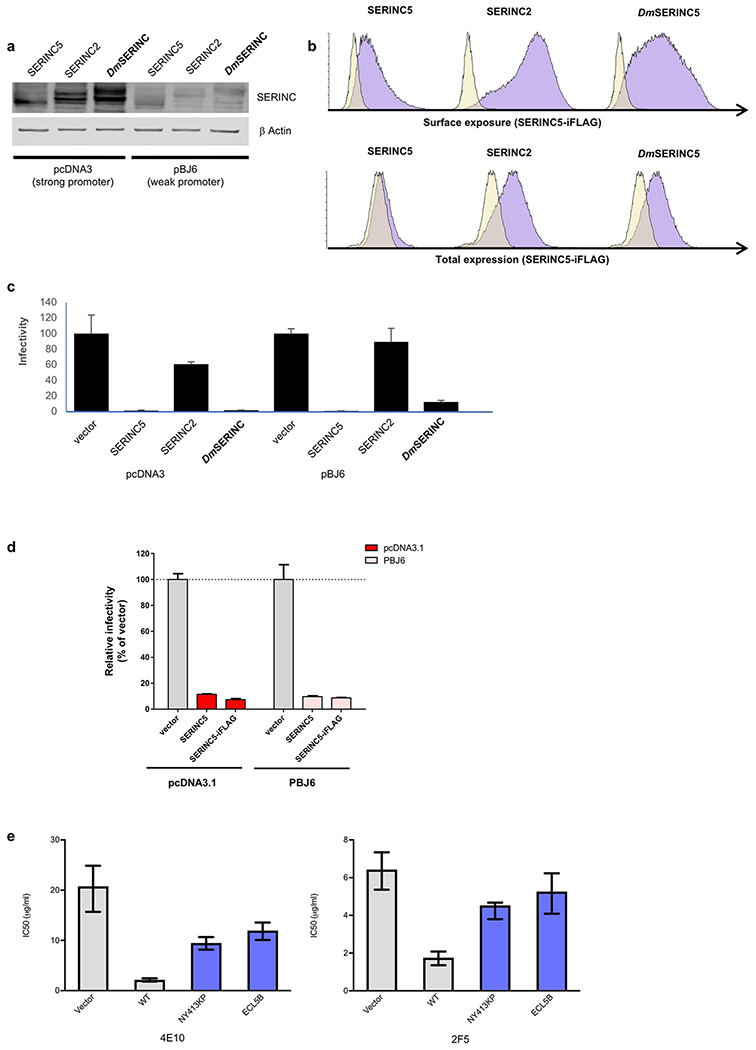
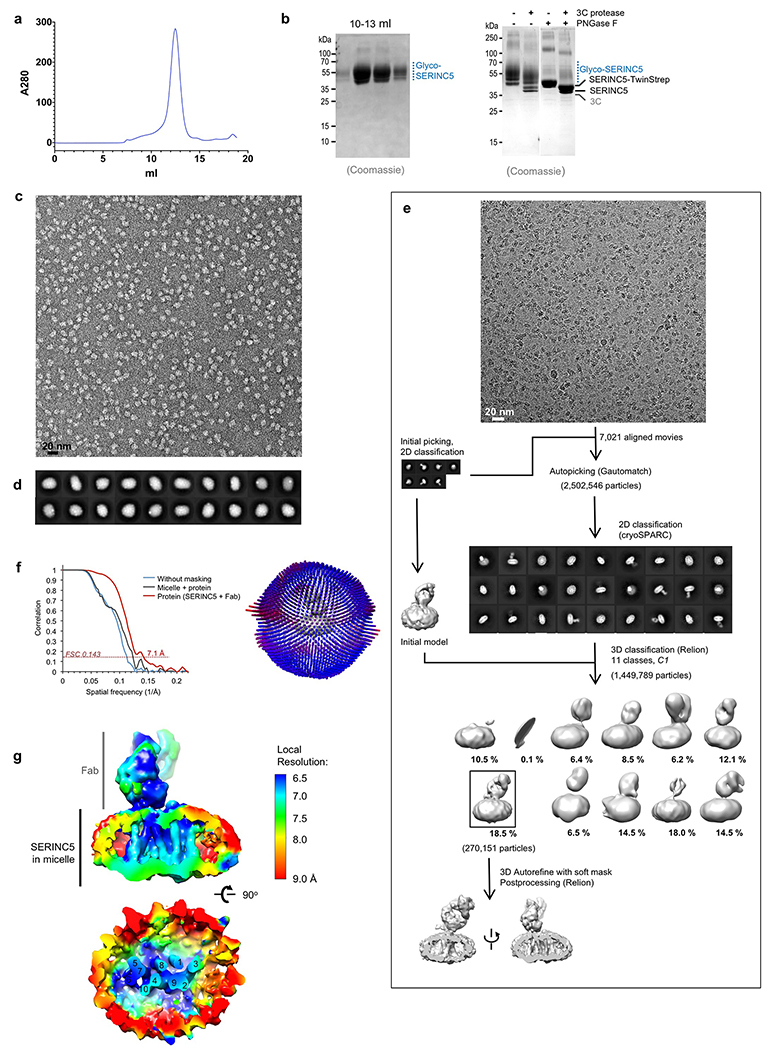
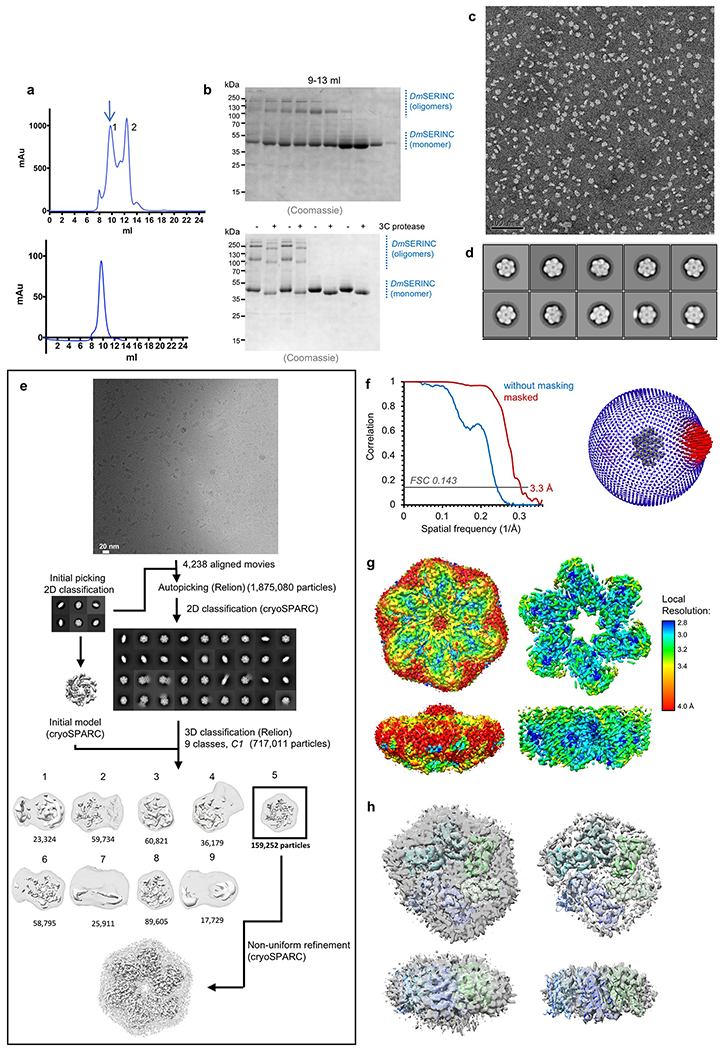
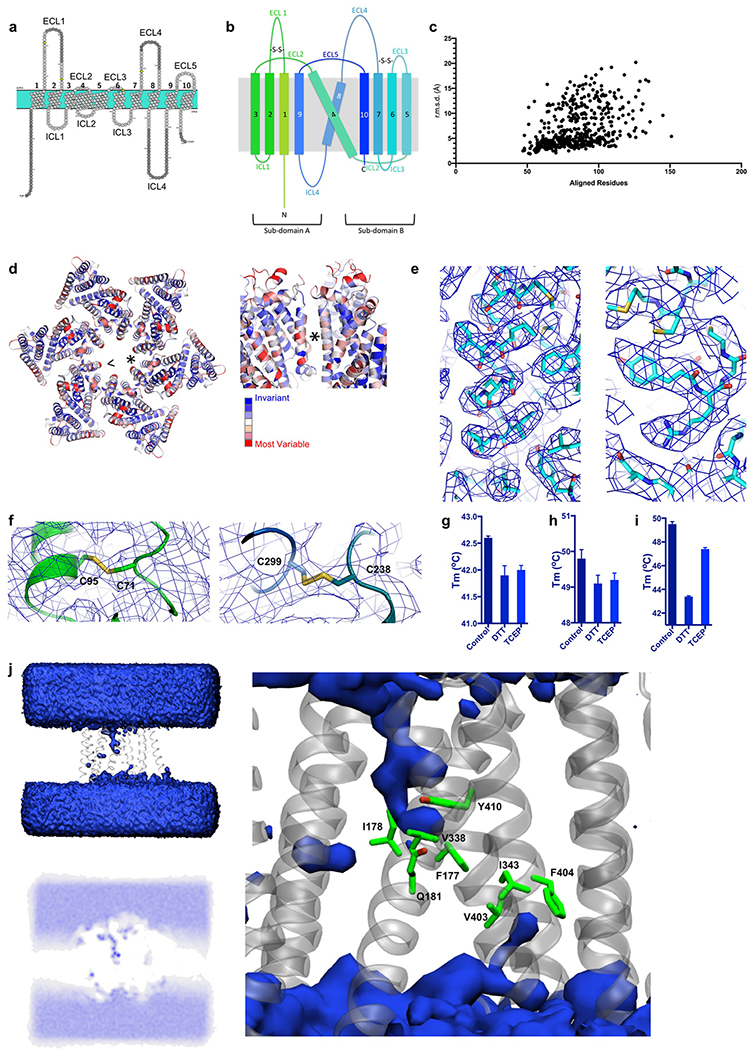
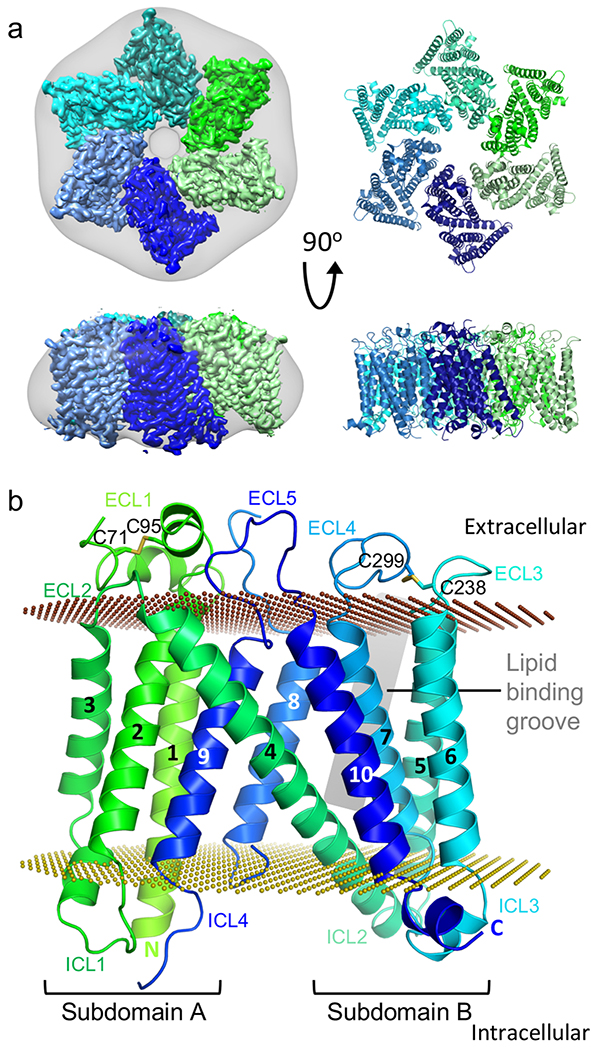
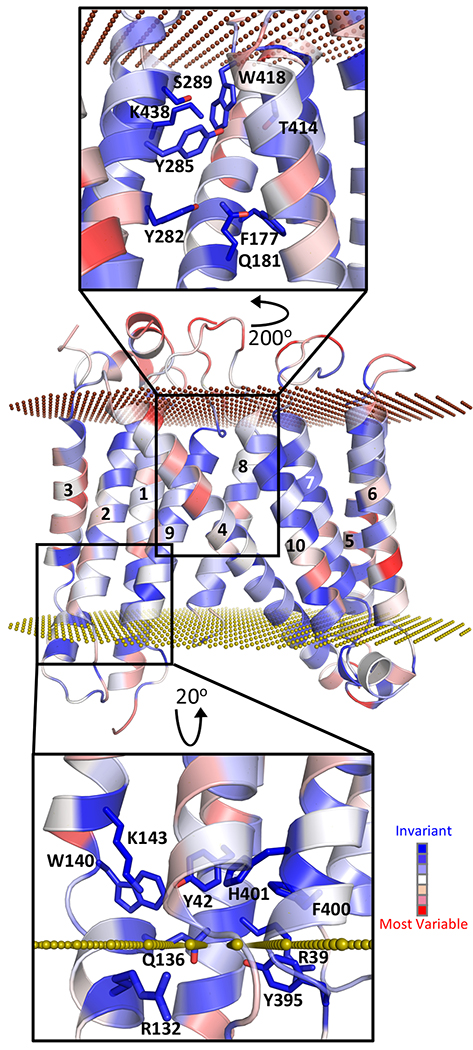
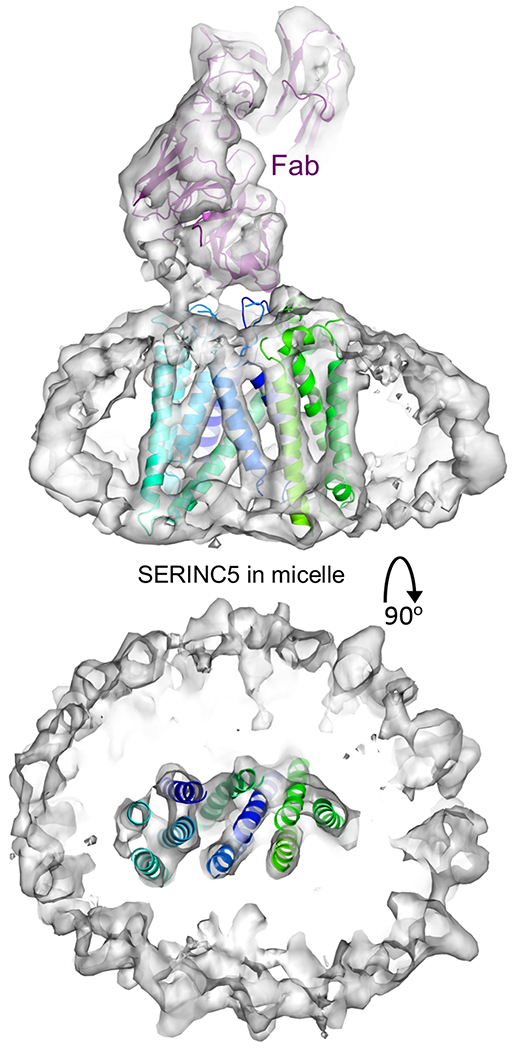
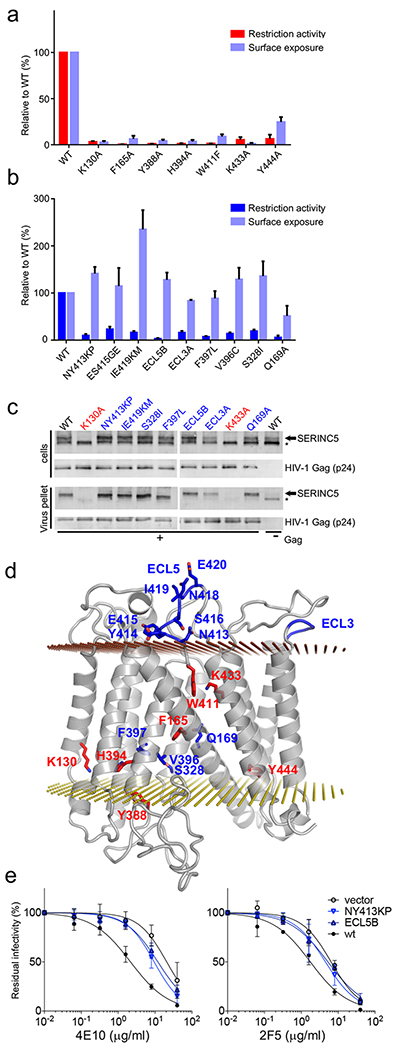
The human integral membrane protein SERINC5 potently restricts HIV-1 infectivity and sensitizes the virus to antibody-mediated neutralization. Here, using cryo-EM, we determine the structures of human SERINC5 and its orthologue from Drosophila melanogaster at subnanometer and near-atomic resolution, respectively. The structures reveal a novel fold comprised of ten transmembrane helices organized into two subdomains and bisected by a long diagonal helix. A lipid binding groove and clusters of conserved residues highlight potential functional sites. A structure-based mutagenesis scan identified surface-exposed regions and the interface between the subdomains of SERINC5 as critical for HIV-1-restriction activity. The same regions are also important for viral sensitization to neutralizing antibodies, directly linking the antiviral activity of SERINC5 with remodeling of the HIV-1 envelope glycoprotein.


Conflict of interest statement

Competing interests

The authors declare no competing interests.

Figures

Extended Data Fig. 1
Extended Data Fig. 1. Restriction activity and surface exposure of SERINC.
a,b, HIV-1 restriction activity of DmSERINC compared with human SERINC5 and SERINC2. Human and DmSERINC proteins with HA tags at their C-termini were expressed in HEK293T cells with two different expression vectors (pcDNA and pBJ6) which provide high and low expression, respectively. Levels of the indicated SERINC proteins were assessed by Western blotting using an anti-HA antibody (uncropped blot images are shown in the Source Data) (a) and by flow cytometry (b) to detect the proteins surface expression (b, top) or total expression (b, bottom) using an anti-FLAG antibody on non-permeabilzed and permeabilized cells respectively. c, Effect of SERINC expression on infectivity of HIV-1 produced in HEK293T cells transfected to express the indicated SERINC-iFLAG-HA and Nef-deficient HIV-1NL4-3. (Data shown are mean and s.d. of n=4 technical repeats. Data are provided in the Source Data). d, Insertion of the FLAG epitope into ECL4 does not interfere with the anti-HIV-1 restriction activity of SERINC5. Infectivity of Nef-deficient HIV-1NL4-3 produced in HEK293T cells transfected to express unmodified human SERINC5-HA or a variant modified by inserting a FLAG tag within its ECL4 (SERINC5-iFLAG-HA). Two different expression vectors (pcDNA and pBJ6) were used in order to obtain high and low SERINC5 expression as shown above (Data shown are mean and s.d. of n=4 technical repeats. Data are provided in the Source Data). e, Effect of ECL5 SERINC5 variants on HIV-1 susceptibility to neutralization. IC50 values derived from fitted sigmoidal curves shown in figure 4, obtained from quadruplicate repeats using antibodies 2F5 and 4E10 on Nef-defective HIV-1NL4-3 pseudotyped with the envelope glycoprotein derived from HIV-1JR-FL, produced by transfecting HEK293T cells with the indicated PBJ5-SERINC5-iFLAG-HA variants or the empty vector control (Data shown are mean and 95% confidence interval of n=4 technical repeats. Data are provided in the Source Data).
Extended Data Fig. 2
Extended Data Fig. 2. Human SERINC5 purification and EM
a, Size exclusion chromatography profile. b, Left: SDS-PAGE analysis of resulting fractions; right: cleavage of TwinStrep tag and deglycosylation (uncropped gel images are shown in the Source Data). c, Sample micrograph of negatively stained particles. d, Representative 2D class averages. e, Schematic of image processing and reconstruction of the human SERINC5 cryo-EM structure. Details are given in Extended Methods. f, Left: Gold standard FSC curve for the cryo-EM reconstruction of SERINC5, Right: Euler angle distribution plot for particles included in the final 3D reconstruction; 3DFCS reports a sphericity of 0.976. g, The map colored according to local resolution estimated with blocres.
Extended Data Fig. 3
Extended Data Fig. 3. DmSERINC purification and EM.
a, Left: chromatography profile of DmSERINC on a Superdex 200 column; the blue arrow highlights elution of the material, which was re-injected onto the column. Right: elution profile of hexameric DmSERINC. b, Left: SDS PAGE analysis of chromatography fractions; Right: purified hexamer (first 4 lanes) and monomer (last four lanes) uncleaved vs cleaved sample showing higher oligomeric states in hexamer sample shift upon cleavage of the C-terminal TwinStrep tag (uncropped gel images are shown in the Source Data). c, Sample micrograph of negatively stained DmSERINC sample from 9.8-ml peak. d, 2D class averages of negatively stained DmSERINC. e, Schematic of image processing and 3D reconstruction of the DmSERINC hexamer. Volumes are shown at two contour levels, towards the protein level in solid white and the outline of the detergent micelle in transparent grey. Details of the image processing and reconstruction are given in Extended Methods. f, Left: Gold-standard FSC curve for the refined DmSERINC cryo-EM map. f, Right: Euler angle distribution plot for aligned particles contributing to the 3D reconstruction; bar lengths and color (blue low, red high) correspond to numbers of particles in corresponding orientations. g, Cryo-EM map colored according to local resolution estimated with blocres and shown at high (left) and low (right) contour levels. h, Cryo-EM maps of the asymmetrical DmSERINC hexamer (corresponding to 3D classes 3 and 8 in Extended Data Fig. 3e) with fitted model: viewed down 6-fold axis (top) or from side (bottom). The map is contoured to highlight the protein components (right) or the detergent micelle (left).
Extended Data Fig. 4
Extended Data Fig. 4. Structural features of DmSERINC
a, Transmembrane topology diagram of DmSERINC structure with residues not resolved in the cryo-EM map shaded grey. b, Topology diagram of the SERINC protein fold, colored as in Fig. 1b. ECLs and ICLs are labelled along with disulphide bonds and subdomains A and B. c, Scatter plot of top 500 results from analysis using Dali server, showing numbers of aligned residues versus root mean square deviations (Å) of Cα atom positions. d, DmSERINC hexamer colored by conservation; Guillemet indicates the viewpoint on the protomer-protomer interface labeled with asterisk that is shown in the sideview on the right. e, Examples of DmSERINC cryo-EM map with fitted model. f, Two disulphide bonds identified on the extracellular side of DmSERINC. Left: Cryo-EM map showing profile of Cys71-Cys91 disulphide bond within ECL1. Right: Cryo-EM map showing profile of Cys238-Cys299 disulphide bond between ECL3 and ECL4. Thermostability of the DmSERINC hexamer (g), monomer (h), and SERINC5 (i) with the addition of reducing agents (0.5 mM DTT and 0.5 mM TCEP); data shown are mean and s.d. n=3-4 technical repeats, data are provided in source data. j, Molecular dynamic simulations of solvation. Left top: Density analysis of waters (blue surface) around DmSERINC (grey cartoon) in one repeat of atomistic 230-ns simulation. Left bottom: Water density shown as a 2D heatmap slice. Right: DmSERINC residues implicated in controlling water wire highlighted in green.
Extended Data Fig. 5
Extended Data Fig. 5. Lipidomics of DmSERINC structure
a, Cryo-EM map features of DmSERINC displaying similarities with cardiolipin viewed with (right) and without (left) coordinates built, from two angles. b, Positions of the tentative cardiolipin sandwiched between the protomers of the hexamer. c-e, Identification of lipids associated with DmSERINC by mass spectrometry: c, Lipidomics LC-MS analysis of hexameric DmSERINC5 purified from yeast cells. Ions corresponding to phospholipids (PE, PC, PI) and cardiolipin compositions are indicated. d, Structures within each lipid class are confirmed by MS/MS fragmentation. Neutral loss fragments, such as R1COO- and R2COO- ions, are diagnostic for PE, PC, PI and cardiolipin (CL). e, Native mass spectra of DmSERINC monomers (10+ to 15+ charge state distribution) isolated from LMNG micelles spiked with PC, PG, PE or CL lipids added at a 1:1 molar ratio. Up to two equivalents of bound CL were observed whereas no distinct binding was detected for PC, PG, or PE.
Extended Data Fig. 6
Extended Data Fig. 6. Lipid screening
a, Lipid binding groove apparent in DmSERINC structure, top left: Surface representation of DmSERINC monomer revealing a groove formed between TMs 5, 7, 8 and 4. top right: Lipid moiety modeled into the groove, shown in spheres, illustrating complementary size, shape and location for lipid binding. bottom left: Cartoon representation of the same view with helices labelled and colored as Fig. 1b. bottom right: Cartoon representation with lipid shown in stick format. b, Cryo-EM map has lipid-like features in this groove, left: map with PS modelled in, right: map carved to 2.5 Å around the modelled PS to highlight the lipid-like map features. e. View of DmSERINC in a POPC membrane, following 215 ns of atomistic simulation. The protein is shown as blue cartoon and transparent surface, and the POPC lipids as red, orange and grey spheres. Lipids in front of the protein have been removed to reveal how the protein sits in the membrane. d, Post 215 ns view of DmSERINC from atomistic MD simulation, showing a POPC lipid bound to the groove between TM 5 and 8. The protein is shown in white cartoon, the lipid in green, red and gold spheres. Note that this lipid remains bound for the full simulation. e-g, Lipid thermostability assay. e, Change in thermostability of DmSERINC hexamer upon the addition of specific lipid. f, Change in thermostability of DmSERINC monomer upon the addition of a specific lipid; g, Change in thermostability of SERINC5 upon the addition of a specific lipid (select sample of lipids). Data shown in e-f are mean and s.d. of 3-6 technical repeats, data are provided in Source Data.
Extended Data Fig. 7
Extended Data Fig. 7. HDX of lipid interactions with DmSERINC
a, Left: Peptide coverage of DmSERINC monomer for HDX. Right: Structure of DmSERINC (with undefined loops modeled in using SWISS MODEL) with coverage highlighted in blue. b-e, HDX profile of purified monomeric DmSERINC in LMNG micelles prior to (b) or after spiking with exogenous DPPS (c), sulfatides (d), or PC (e) Peptide residue numbers are shown on the x-axis. f, Protected regions determined by HDX mapped onto the DmSERINC structure and highlighted in red (with undefined loops modelled in using SWISS MODEL). g, surface representation of DmSERINC structure colored as in Fig. 1b. with protected regions highlighted in red.
Extended Data Fig. 8
Extended Data Fig. 8. Juxtaposition of SERINC5 and the trimeric HIV-1 envelope spike.
The model of human SERINC5 is shown in grey cartoons with residues important for restriction highlighted in blue and modeled loops in white transparent. The illustrative model of full-length trimeric HIV-1 Env was assembled using PDB 6E8W (model 1; pinks) and PDB 5FUU (gp41 browns; gp120 purples), MPER (653-683) is shown in cyans, all structures shown in cartoons; membrane is in cream. a, Side-by-side comparison; b, Models shown in closer proximity, c, 90o rotation and zoom of model in panel b showing the distance between ECL5 and ECL3 is approximately the same distance (~30 Å) as that between MPER α helices in gp41.
Figure 1 |
Figure 1 |. The structure of DmSERINC.
a, Cryo-EM map of the hexamer with each protomer individually colored; the map was Gaussian filtered with a standard deviation of 5 Å to represent the detergent micelle, grey (left) and a cartoon representation of the DmSERINC hexamer (right). b, Detailed representation of an isolated monomer, colored in green to dark blue gradient from N- to C-terminus with transmembrane alpha helices numbered and loops labelled (intracellular loops (ICL) and extracellular loops (ECL)). The position of the lipid groove is indicated by a grey rectangle. Disulphide bonds are labelled and shown in stick format. The outer and inner plasma membrane surfaces are depicted as chocolate and olive dotted planes, respectively.
Figure 2 |
Figure 2 |. Potential functional sites identified in SERINC structure.
Sequence conservation mapped onto the DmSERINC structure, with invariant residues in dark blue and most variable in red; the outer and inner plasma membrane surfaces are depicted as chocolate and olive dotted planes, respectively. The insets show details of the hydrophilic cleft between the subdomains (top) and a highly conserved pocket (bottom).
Figure 3 |
Figure 3 |. Structure of human SERINC5 bound to Fab.
The cryo-EM map is shown as a semi-transparent white surface, with fitted atomic models of DmSERINC (cartoons colored as in Fig. 1b) and Fab (purple cartoons). Top view shows transmembrane helices traversing the detergent micelle and bottom view is a perpendicular slice showing SERINC5 surrounded by the micelle.
Figure 4 |
Figure 4 |. SERINC5 residues critical for HIV-1 restriction activity.
a and b, restriction activity and surface expression of human SERINC5 variants relative to SERINC5 wt (data shown are mean and s.d. of n=3 independent experiments). a, Class 1 amino acid substitutions interfere with Nef-defective HIV-1NL4-3 restriction and surface expression. b, Class 2 amino acid substitutions do not affect surface expression but compromise Nef-defective HIV-1 restriction. c, SERINC5 incorporation into virion particles. Immunoblots of Nef-defective HIV-1 particles and corresponding producer cell lysates expressing the indicated SERINC5 variants. The right-most lane contains a Gag-defective provirus control. Arrowheads and asterisks indicate migration position of glycosylated and non-glycosylated SERINC5, respectively. Note the selective incorporation of the glycosylated form into viral particles d, Class 1 and 2 residues mapped onto a model of SERINC5, in red and blue, respectively. e, Neutralisation of Nef-deficient HIV-1NL4-3 carrying the JRFL envelope by 2F5 and 4E10 monoclonal antibodies. Residual infectivity is relative to that of untreated viruses (n=4, mean ± 95% confidence interval, technical repeats), IC50 values are shown in Extended Data Fig. 1e. Uncropped images for panel c and data for graphs a, b and e are available as Source Data.

References

    1. Duggal NK & Emerman M Evolutionary conflicts between viruses and restriction factors shape immunity. Nat Rev Immunol 12, 687–95 (2012). - PMC - PubMed
    1. Rosa A et al. HIV-1 Nef promotes infection by excluding SERINC5 from virion incorporation. Nature 526, 212–7 (2015). - PMC - PubMed
    1. Usami Y, Wu Y & Gottlinger HG SERINC3 and SERINC5 restrict HIV-1 infectivity and are counteracted by Nef. Nature 526, 218–23 (2015). - PMC - PubMed
    1. Chande A et al. S2 from equine infectious anemia virus is an infectivity factor which counteracts the retroviral inhibitors SERINC5 and SERINC3. Proc Natl Acad Sci U S A 113, 13197–13202 (2016). - PMC - PubMed
    1. Ahmad I et al. The retroviral accessory proteins S2, Nef, and glycoMA use similar mechanisms for antagonizing the host restriction factor SERINC5. J Biol Chem 294, 7013–7024 (2019). - PMC - PubMed

Publication types

LinkOut - more resources