. 2020 Jan;26(1):59-64.
doi: 10.1038/s41591-019-0709-7. Epub 2020 Jan 6.

High-resolution mycobiota analysis reveals dynamic intestinal translocation preceding invasive candidiasis

Affiliations

High-resolution mycobiota analysis reveals dynamic intestinal translocation preceding invasive candidiasis

Bing Zhai et al. Nat Med. 2020 Jan.

Abstract

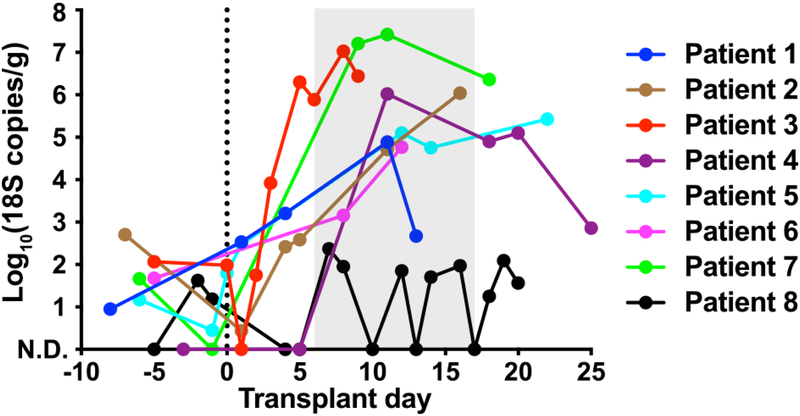
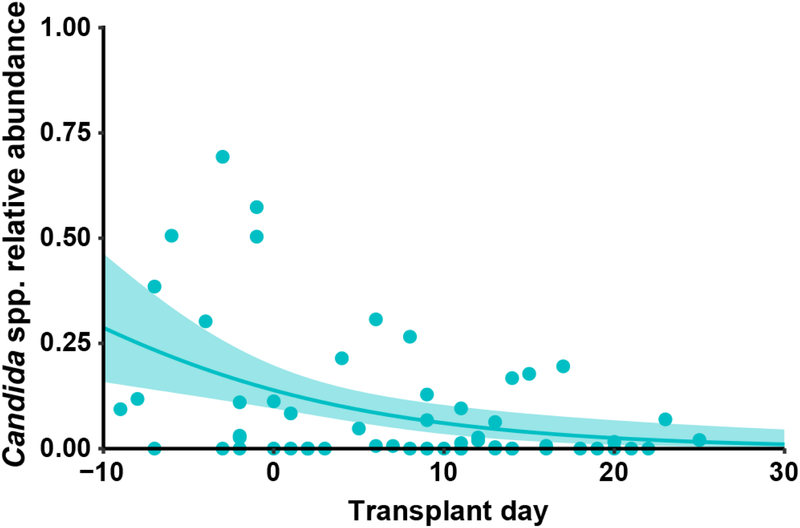
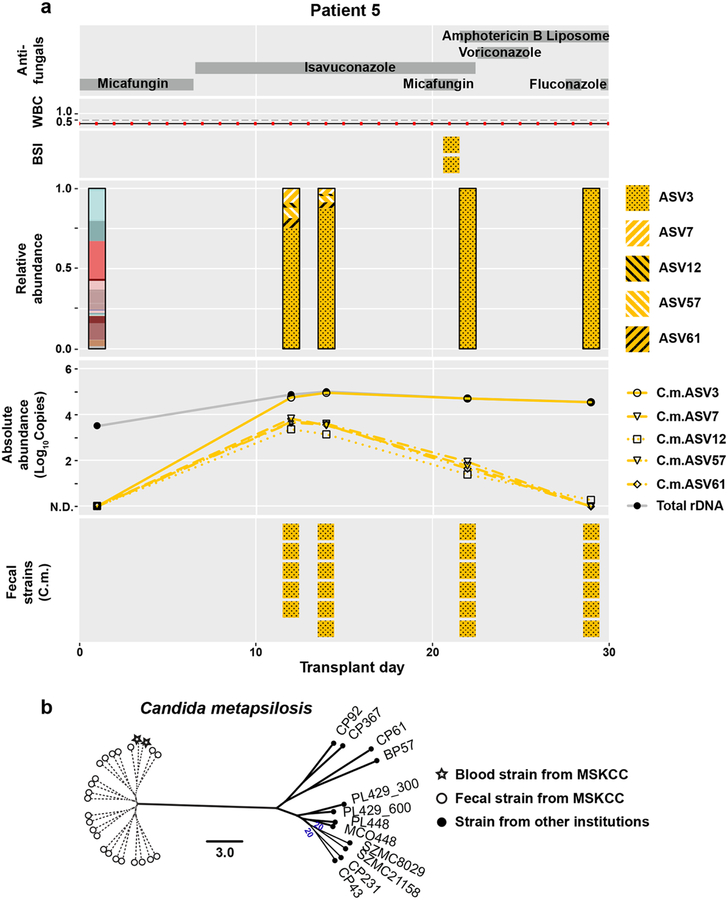
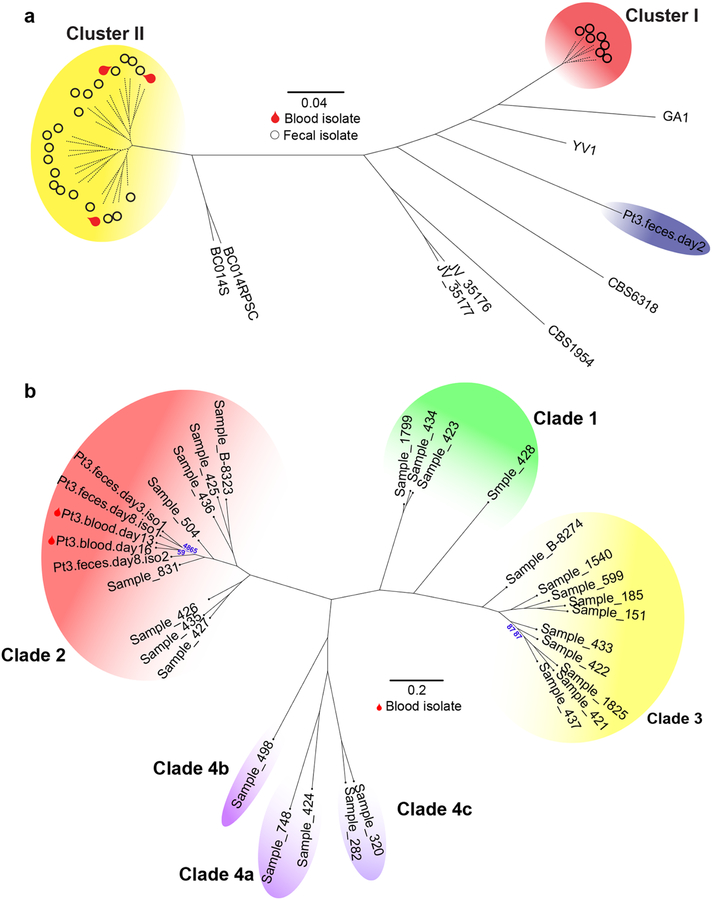
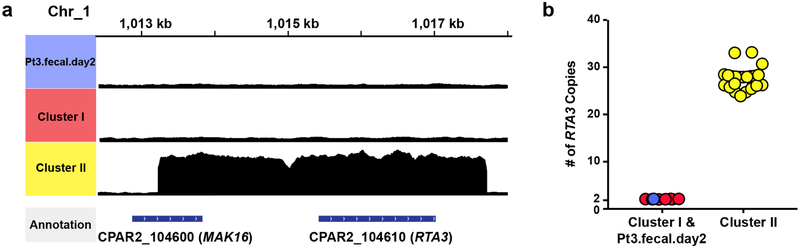
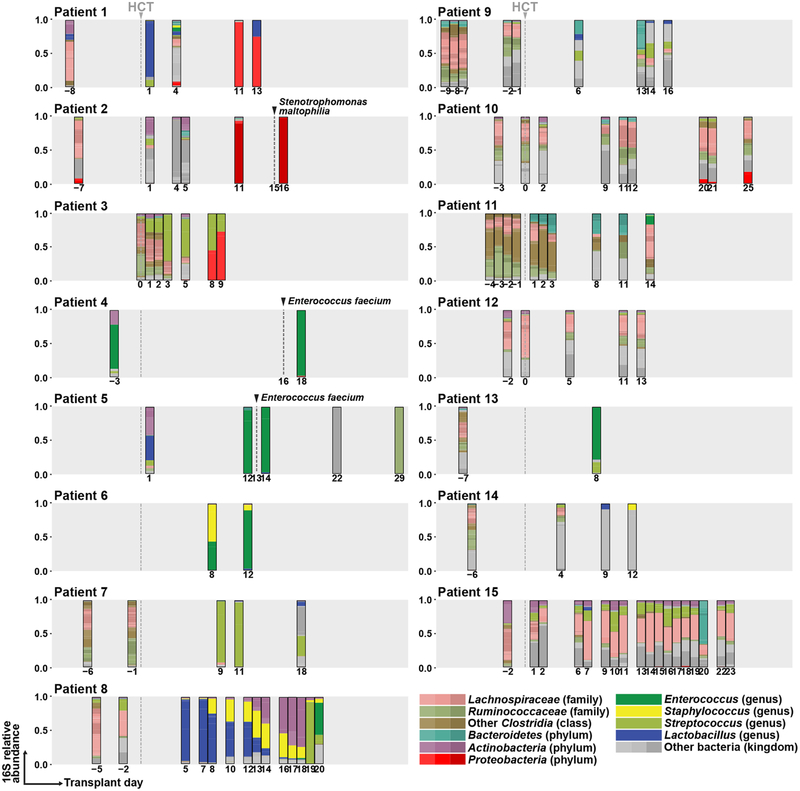
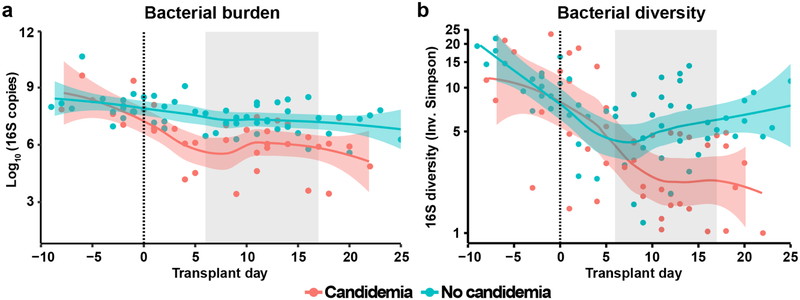
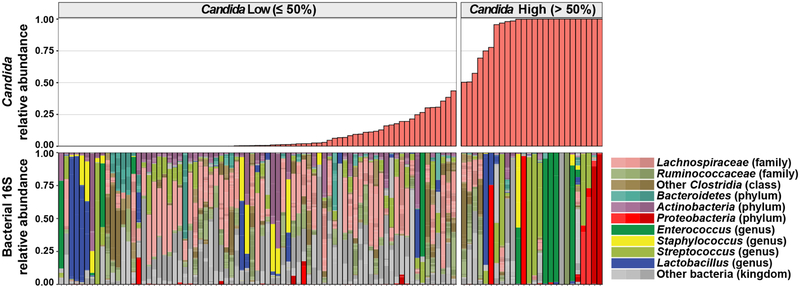
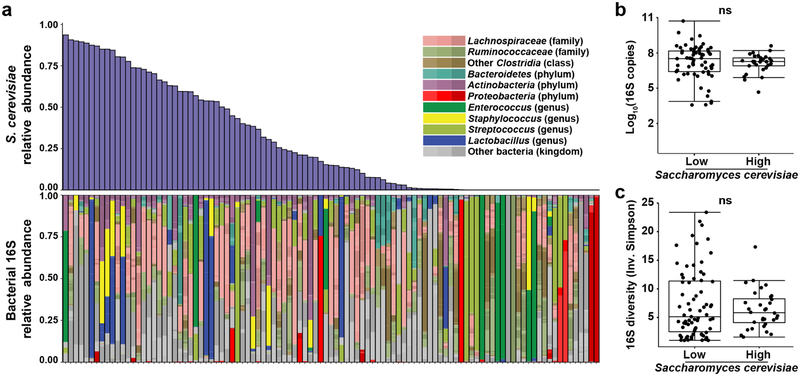
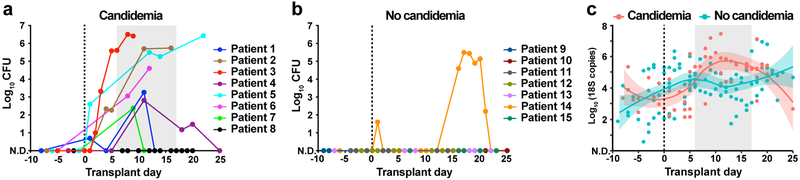
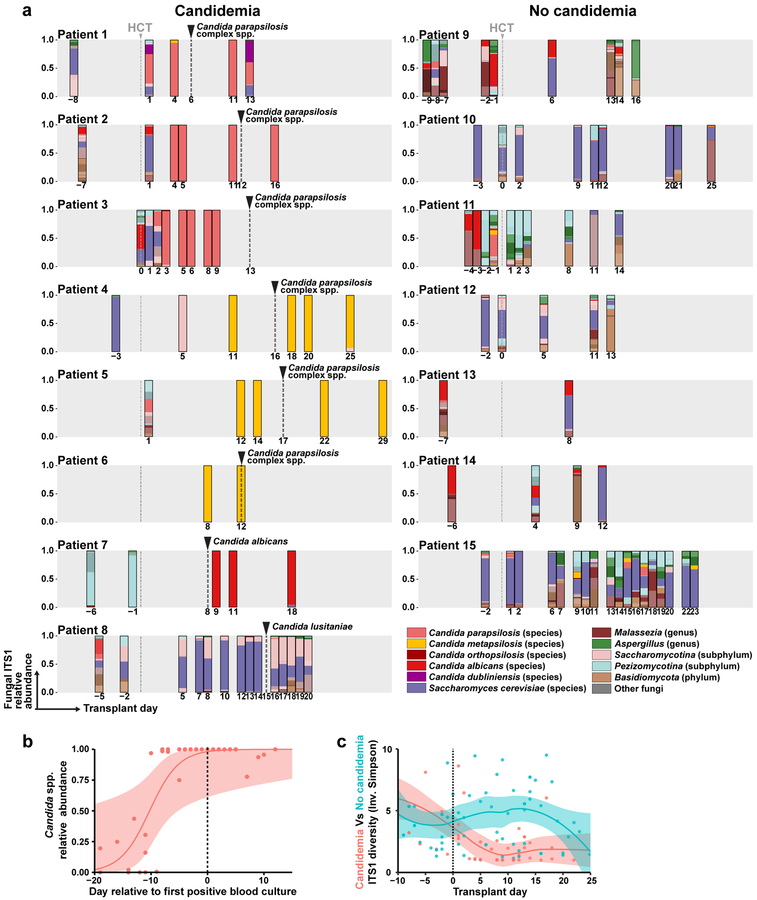
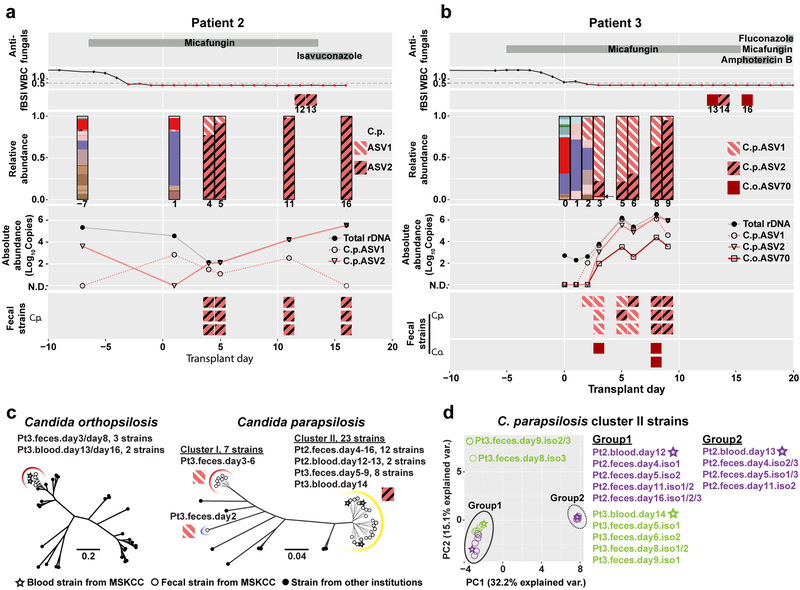
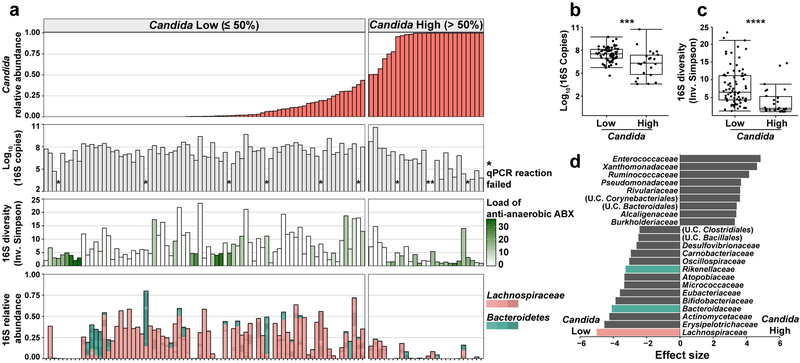
The intestinal microbiota is a complex community of bacteria, archaea, viruses, protists and fungi1,2. Although the composition of bacterial constituents has been linked to immune homeostasis and infectious susceptibility3-7, the role of non-bacterial constituents and cross-kingdom microbial interactions in these processes is poorly understood2,8. Fungi represent a major cause of infectious morbidity and mortality in immunocompromised individuals, although the relationship of intestinal fungi (that is, the mycobiota) with fungal bloodstream infections remains undefined9. We integrated an optimized bioinformatics pipeline with high-resolution mycobiota sequencing and comparative genomic analyses of fecal and blood specimens from recipients of allogeneic hematopoietic cell transplant. Patients with Candida bloodstream infection experienced a prior marked intestinal expansion of pathogenic Candida species; this expansion consisted of a complex dynamic between multiple species and subspecies with a stochastic translocation pattern into the bloodstream. The intestinal expansion of pathogenic Candida spp. was associated with a substantial loss in bacterial burden and diversity, particularly in the anaerobes. Thus, simultaneous analysis of intestinal fungi and bacteria identifies dysbiosis states across kingdoms that may promote fungal translocation and facilitate invasive disease. These findings support microbiota-driven approaches to identify patients at risk of fungal bloodstream infections for pre-emptive therapeutic intervention.


Conflict of interest statement

Competing Interests Statement: T.M.H. has participated in scientific advisory boards for Merck & Co, Inc. and Partner Therapeutics. J.U.P. reports research funding, intellectual property fees, and travel reimbursement from Seres Therapeutics. M.R.M.v.d.B. has received research support from Seres Therapeutics; has consulted, received honorarium from or participated in advisory boards for Seres Therapeutics, Flagship Ventures, Novartis, Evelo, Jazz Pharmaceuticals, Therakos, Amgen, Magenta Therapeutics, Merck & Co, Inc., Acute Leukemia Forum (ALF) and DKMS Medical Council (Board); has IP Licensing with Seres Therapeutics and Juno Therapeutics. All other authors have no competing interests.

Figures

Extended Data Fig. 1
Extended Data Fig. 1. Quantitative Candida genus-specific18S rDNA levels in fecal samples of candidemic patients.
The grey shade indicates the time range of first positive fungal blood cultures. N.D.: not detected.
Extended Data Fig. 2
Extended Data Fig. 2. Quantitation of relative abundance of pathogenic Candida species in patients without candidemia.
The solid line represents the dynamic trend, with the shaded area indicating the 95% confidence intervals, n = 57.
Extended Data Fig. 3
Extended Data Fig. 3. C. parapsilosis ASV1 and ASV2 sequence alignment.
The box indicates the single nucleotide difference between ASV1 and ASV2. This level of variation (1/279) cannot be differentiated with methods based on OTU clustering.
Extended Data Fig. 4
Extended Data Fig. 4. Patient example with C. metapsilosis BSI.
a, The panel shows clinical data, ITS rDNA sequencing results, quantification of amplicons of 5 different ASVs, and genotyping results of fecal and blood strains from patient 5. b, Phylogenic trees of C. metapsilosis strains from patient 5 and from other institutions. Solid lines indicate the calculated distance between strains (bootstrap support of 100%, or otherwise labeled). Dashed lines indicate the bootstrap value of 0, suggesting that the fecal and blood strains are highly similar.
Extended Data Fig. 5
Extended Data Fig. 5. SNP trees of C. parapsilosis and C. orthopsilosis strains with complete information on previously sequenced strains.
The bootstrap values are 100% for all the solid lines and 0% for all the dashed lines in the C. parapsilosis tree. For the C. orthopsilosis tree, the bootstrap values are 100% for the lines except those with specific bootstrap value labeled.
Extended Data Fig. 6
Extended Data Fig. 6. The amplification of RTA3 and the adjacent region on the genomics sequences of C. parapsilosis cluster II strains.
a, The graph shows the enrichment of reads aligned with RTA3 and the adjacent region of chromosome 1 in the genome of cluster II strains, compared to cluster I strains and strain Pt3.fecal.day2. b, Quantitation of RTA3 copy number of all sequenced C. parapsilosis strains from this study (cluster I strains and the strain from patient 2: n = 8; cluster II strains: n = 23).
Extended Data Fig. 7
Extended Data Fig. 7. Bacterial 16S rDNA sequencing data of candidemic and non-candidemic patients.
The grey dashed line and arrow indicate the day of transplant. The grey box indicates day −10 to day +30 of transplant. The black dashed line and arrow indicate the day of the first positive bacterial blood culture. Five samples (one from patient 3, four from patient 5) failed 16S rDNA sequencing and were excluded from the bacterial diversity or LEfSe analysis. A subset of the 16S rDNA sequencing data has been previously reported,.
Extended Data Fig. 8
Extended Data Fig. 8. Bacterial 16S rDNA burden and α-diversity in patient fecal samples.
a, Quantitative bacterial 16S rDNA levels in candidemic (red, n = 38) and non-candidemic (green, n = 54) patient groups at indicated time points during allo-HCT. Ten samples were further excluded from Fig. 7 since they failed the 16S rDNA qPCR reaction. b, α-diversity of bacterial 16S rDNA in candidemic (red, n = 45) and non-candidemic (green, n = 57) patient groups, measured by Inverse Simpson index. The solid line represents the dynamic trend, with the shaded area indicating the 95% confidence intervals. The grey shaded area indicates the day of first positive fungal blood culture. The yaxis in panel (b) is rescaled with Logε. A subset of the 16S rDNA sequencing data has been previously reported,.
Extended Data Fig. 9
Extended Data Fig. 9. Full bacterial sequencing data aligned according to Candida relative abundance.
Alignment of bacterial (16S) rDNA sequencing data from all 15 study patients, according to the relative abundance of pathogenic Candida species. The bacterial 16S rDNA sequencing data of each sample are presented in the bottom row. A subset of the 16S rDNA sequencing data has been previously reported,.
Extended Data Fig. 10
Extended Data Fig. 10. Characterization of intestinal bacterial microbiota with high Saccharomyces cerevisiae relative abundance.
a, 16S rDNA Alignment of bacterial (16S) rDNA sequencing data from all 15 study patients, according to the relative abundance of S. cerevisiae. b, quantification of bacterial burden (two-sided Wilcoxon rank sum p = 0.36) in samples with high (n = 29) and low (n = 64) S. cerevisiae relative abundance. Box plots represent median, IQR and range. c, quantification of bacterial diversity (two-sided Wilcoxon rank sum p = 0.87) in samples with high (n = 32) and low (n = 71) S. cerevisiae relative abundance. Box plots represent median, IQR and range. A subset of the 16S rDNA sequencing data has been previously reported,.
Fig. 1:
Fig. 1:. Intestinal fungal burden in allo-HCT patients.
a,b, Quantitative fungal cultures of fecal samples from (a) candidemic and (b) non-candidemic patients at indicated time points during allo-HCT. c, Quantitative fungal 18S rDNA levels in candidemic (red, n = 55) and non-candidemic (green, n = 99) patient groups during allo-HCT. The solid line represents the dynamic trend using moving average filtering, with the shaded area indicating the 95% confidence intervals. Each dot represents an individual sample (a-c) and each color a unique patient (a, b). The grey shade in panels (a) and (c) indicate the time range of first positive fungal blood cultures. N.D.: not detected.
Fig. 2:
Fig. 2:. Mycobiota dynamics in allo-HCT patients.
a, Species-level taxonomy of fecal mycobiota (average: 7 samples per patient, range: 2 – 18) from allo-HCT patients with (left column) and without (right column) candidemia, colored according to the legend. Frequent species, e.g. Candida species and Saccharomyces cerevisiae, were individually color-coded. The grey box indicates day −10 to day +30 of transplant and the grey dashed line indicates the day of transplant. The number below each bar graph indicates the day of sampling. The black dashed line and arrow indicate the day of first fungal BSI in the candidemia group. b, Quantification of total relative abundance of pathogenic Candida species of each fecal sample (n = 37) from patients 1 to 7, a solid line represents the dynamic trend, with the shaded area indicating the 95% confidence interval. c, α-diversity of mycobiota in each sample, measured by the Inverse Simpson index. Red dots and line: candidemia group (n = 51); green dots and line: non-candidemia group (n = 57).
Fig. 3:
Fig. 3:. High-resolution mycobiota analysis in allo-HCT patients with fungal BSI.
Longitudinal clinical and mycobiota data from patient 2 (a) and patient 3 (b) include antifungal administration (1st row), white blood cell counts (WBC; 2nd row), the identity of C. parapsilosis and C. orthopsilosis ASVs amplified from blood culture isolates (fBSI; 3rd row), the fungal relative (4th row) and absolute (5th row) abundance in fecal samples, and the ASV identities of C. parapsilosis (6th row) and C. orthopsilosis (7th row in b) from fecal culture isolates. The absolute abundance was calculated by multiplying the relative abundance of indicated C. parapsilosis and C. orthopsilosis ASVs with the total fungal rDNA abundance. With exception of indicated C. parapsilosis and C. orthopsilosis ASVs, mycobiota constituents (3rd row) are colored according to the key in Fig. 2. c, Phylogenic trees of C. parapsilosis and C. orthopsilosis strains from MSKCC patients and from other institutions. Solid lines indicate the calculated distance between strains (bootstrap support of > 85%). Dashed lines in the C. orthopsilosis tree indicate a bootstrap value ≤ 65% (for complete information of the bootstrap value, see Extended Data Fig. 5). In the C. parapsilosis tree, dashed lines indicate highly similar strains that cannot be accurately resolved (bootstrap = 0%). The red arc indicates cluster I strains (only fecal strains from patient 3), the yellow arc indicates cluster II strains (fecal and blood strains from patient 2 and patient 3), and the blue arc indicates a more divergent fecal strain from patient 3. Cluster II strains carry the ASV2 pattern in their ITS1 region; other strains carry the ASV1 pattern. d, Principal Components Analysis of all 23 cluster II strains from patient 2 and patient 3. Circles: fecal strains; stars: blood strains; purple symbols: strains from patient 2; green symbols: strains from patient 3.
Fig. 4:
Fig. 4:. Characterization of bacteria in fecal samples with high and low levels of pathogenic Candida species.
a, Alignment of fecal samples according to the relative abundance of pathogenic Candida species (1st row), bacterial burden (by 16S rDNA qPCR; 2nd row), bacterial diversity (by Inverse Simpson Index; 3rd row), and relative abundance of Lachnospiraceae and Bacteroidetes (4th row). * indicates failed 16S qPCR reaction. Each bar in the bacterial diversity graph (3rd row) is colored to indicate the anti-anaerobic antibiotic load index prior to sample collection; this index reflects the sum of administered anti-anaerobic antibiotics (metronidazole, clindamycin, carbapenems, piperacillin/tazobactam, and oral vancomycin) multiplied by the number of treatment days. b, Comparison of bacterial burden in samples with high (> 50%, n = 22) or low (≤ 50%, n = 71) Candida relative abundance. ***: Two-sided Wilcoxon rank sum test p = 0.00073. c, Comparison of bacterial diversity in samples with high (> 50%, n = 26) or low (≤ 50%, n = 77) Candida relative abundance. ****: Two-sided Wilcoxon rank sum test p = 1.9 × 10⁻⁵. The box plots in b and c represent the median, interquartile range (IQR) and range. d, LEfSe analysis of bacteria taxa (at family level) present in samples with high (> 50%, n = 26) or low (≤ 50%, n = 77) relative Candida abundance. The effect size corresponds to the linear discriminant analysis (LDA) score. U.C.: unclassified. A subset of the 16S rDNA sequencing data has been previously reported,.

Comment in

References

    1. Paterson MJ, Oh S & Underhill DM Host-microbe interactions: commensal fungi in the gut. Curr Opin Microbiol 40, 131–137 (2017). - PMC - PubMed
    1. Richard ML & Sokol H The gut mycobiota: insights into analysis, environmental interactions and role in gastrointestinal diseases. Nat Rev Gastroenterol Hepatol 16, 331–345 (2019). - PubMed
    1. Blander JM, Longman RS, Iliev ID, Sonnenberg GF & Artis D Regulation of inflammation by microbiota interactions with the host. Nat Immunol 18, 851–860 (2017). - PMC - PubMed
    1. Koh AY The microbiome in hematopoietic stem cell transplant recipients and cancer patients: Opportunities for clinical advances that reduce infection. PLoS Pathog 13, e1006342 (2017). - PMC - PubMed
    1. Lewis BB & Pamer EG Microbiota-Based Therapies for Clostridium difficile and Antibiotic-Resistant Enteric Infections. Annu Rev Microbiol 71, 157–178 (2017). - PubMed

Publication types