. 2020 Jan;52(1):106-117.
doi: 10.1038/s41588-019-0559-8. Epub 2020 Jan 6.

The Indian cobra reference genome and transcriptome enables comprehensive identification of venom toxins

Affiliations

The Indian cobra reference genome and transcriptome enables comprehensive identification of venom toxins

Kushal Suryamohan et al. Nat Genet. 2020 Jan.

Abstract

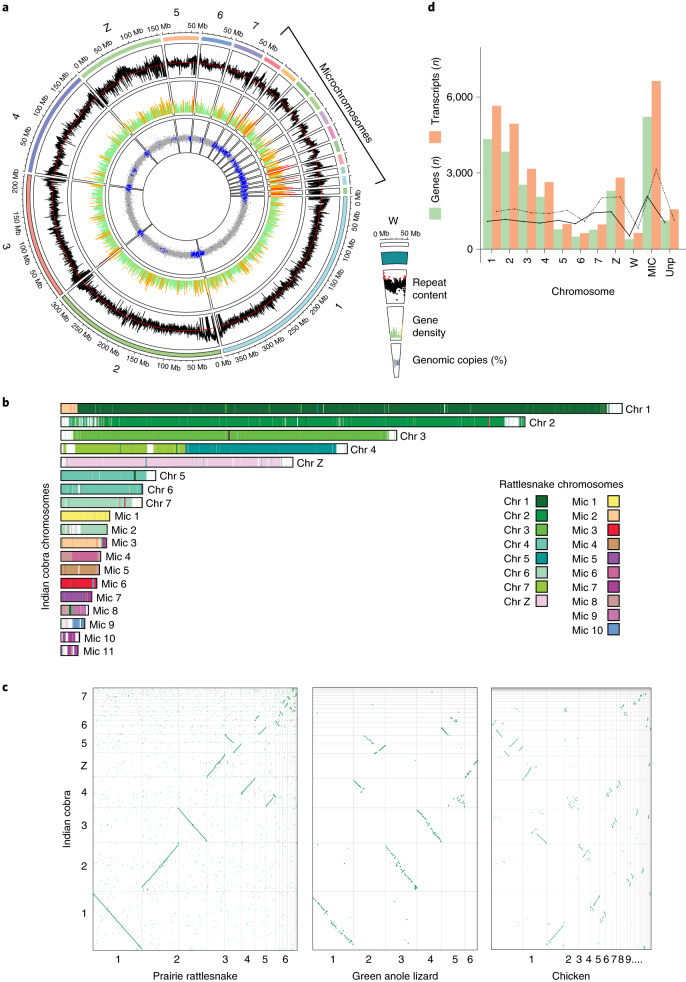
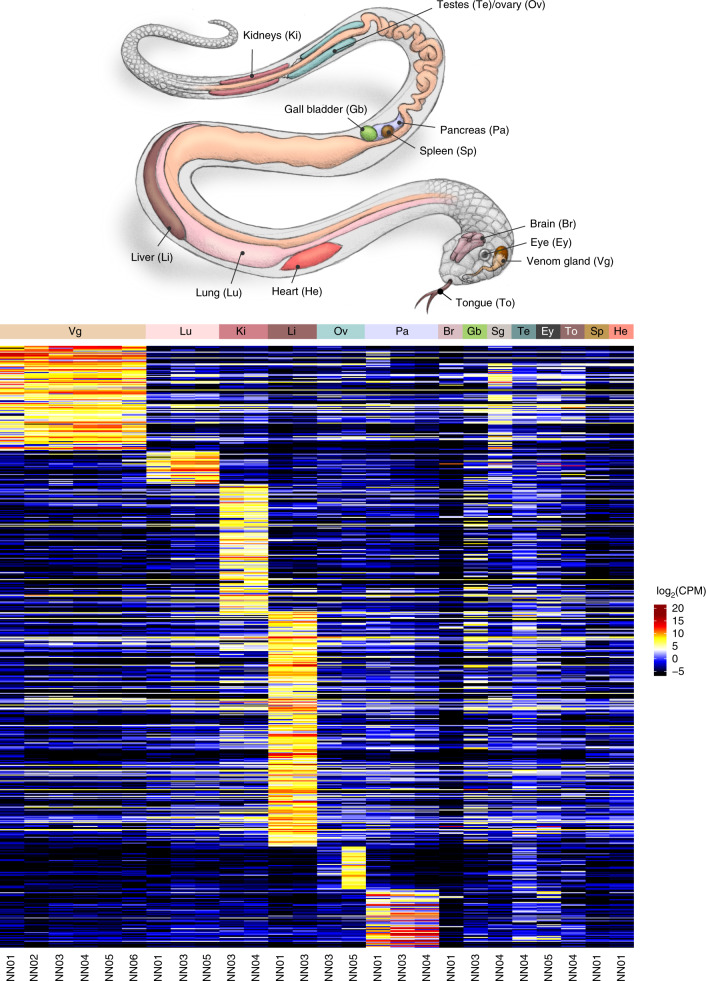
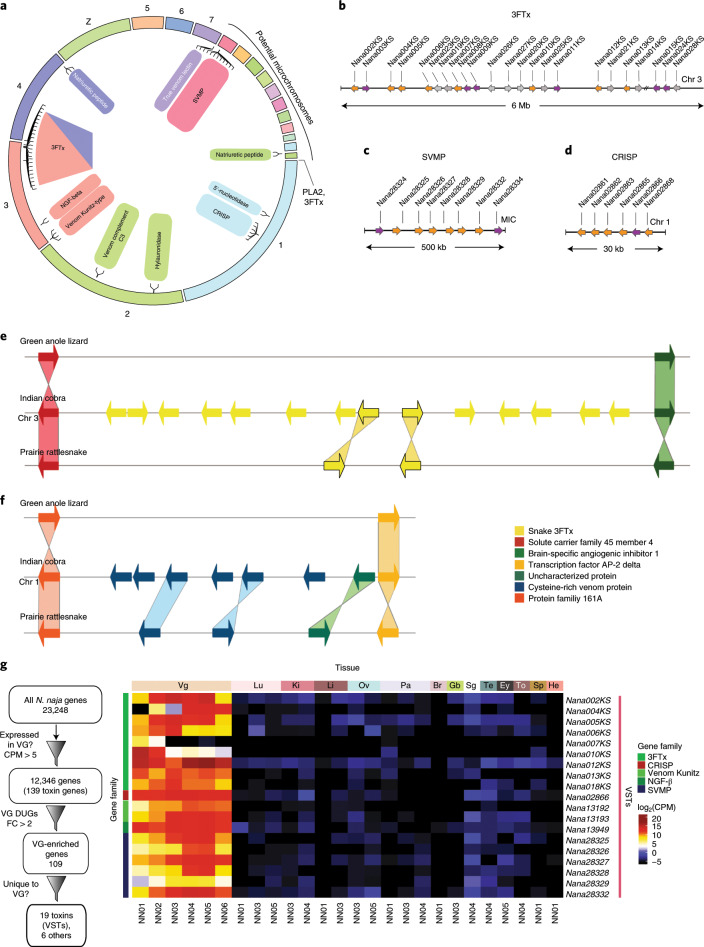
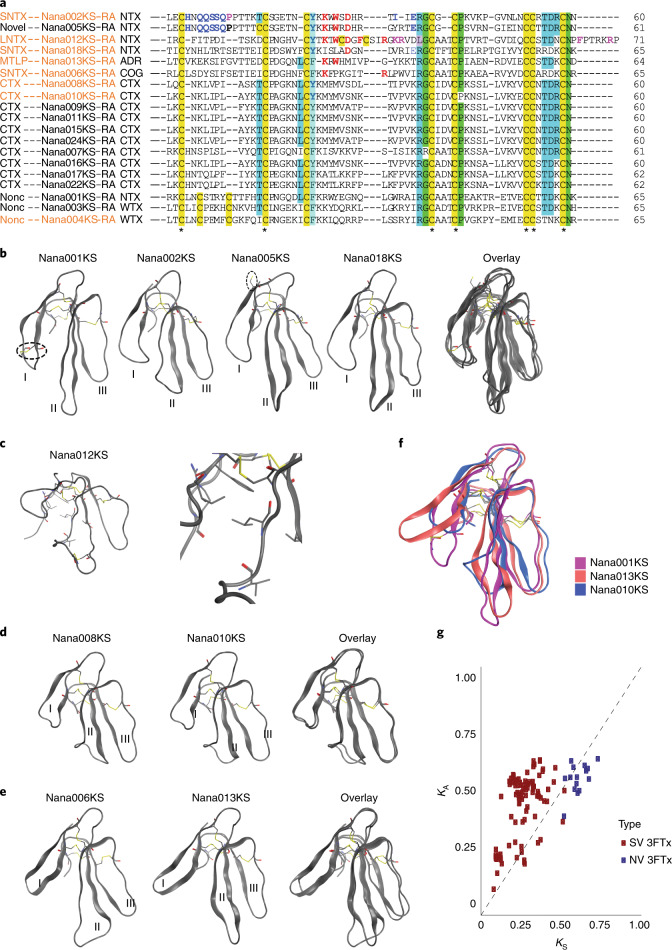
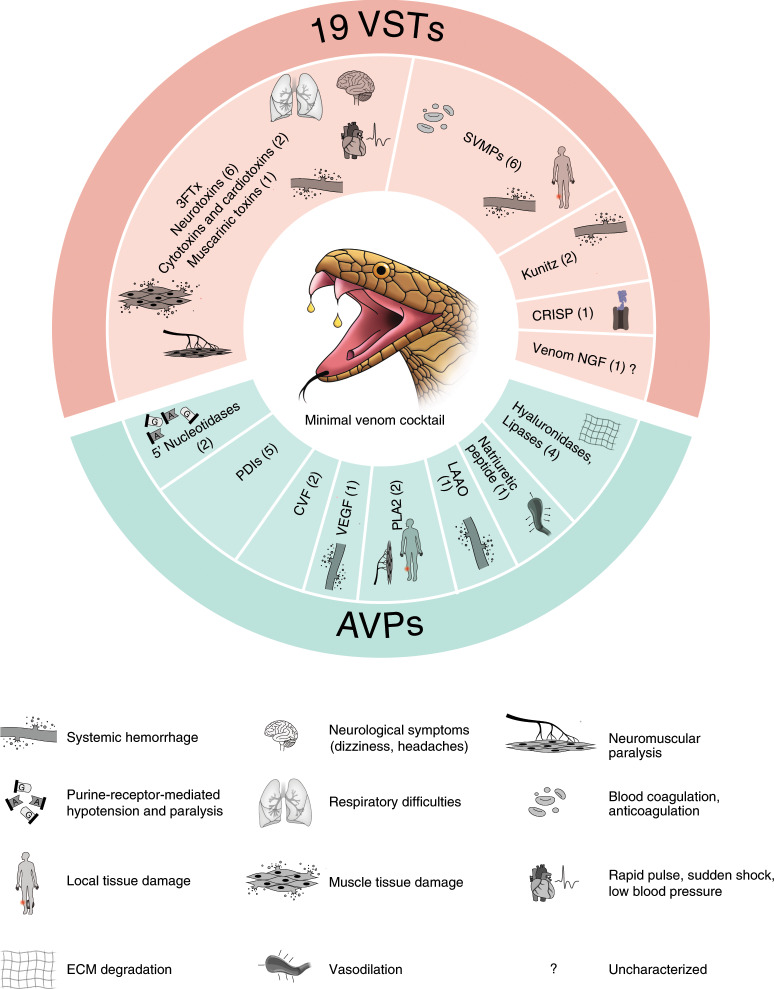
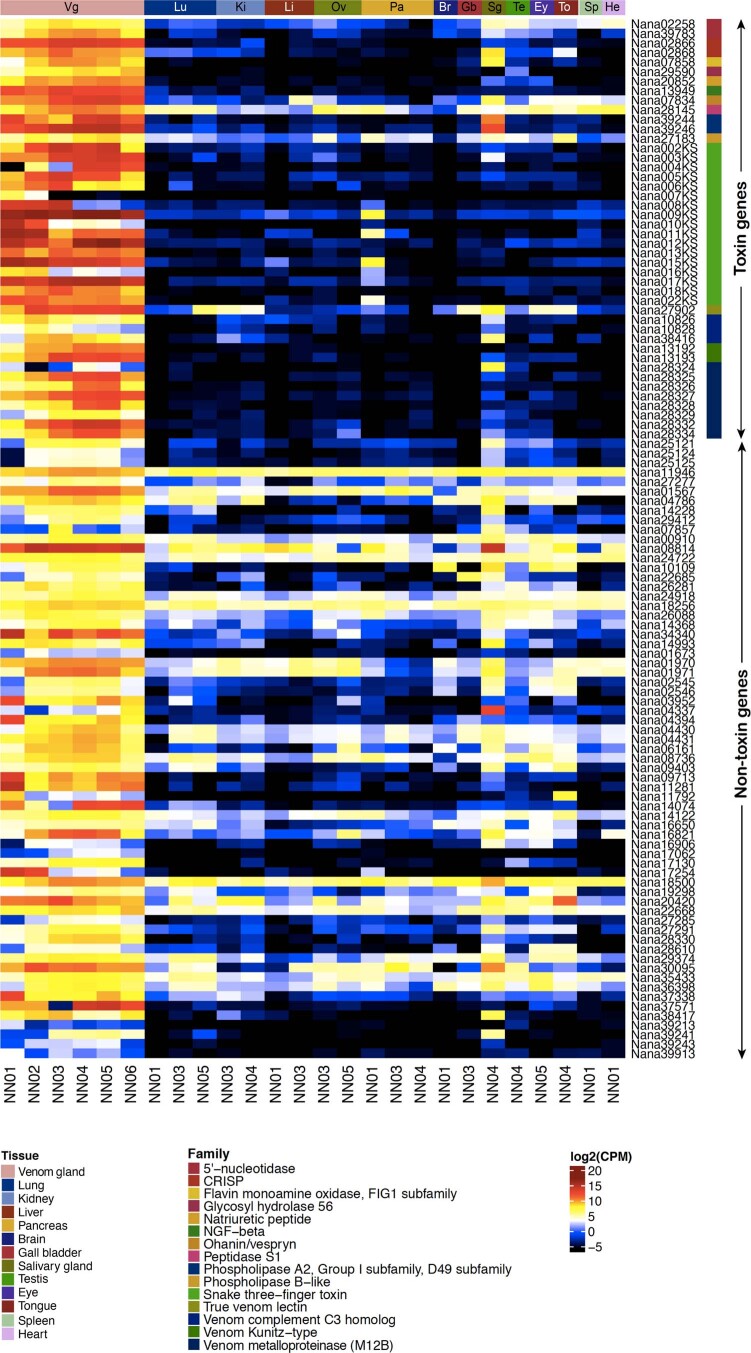
Snakebite envenoming is a serious and neglected tropical disease that kills ~100,000 people annually. High-quality, genome-enabled comprehensive characterization of toxin genes will facilitate development of effective humanized recombinant antivenom. We report a de novo near-chromosomal genome assembly of Naja naja, the Indian cobra, a highly venomous, medically important snake. Our assembly has a scaffold N50 of 223.35 Mb, with 19 scaffolds containing 95% of the genome. Of the 23,248 predicted protein-coding genes, 12,346 venom-gland-expressed genes constitute the 'venom-ome' and this included 139 genes from 33 toxin families. Among the 139 toxin genes were 19 'venom-ome-specific toxins' (VSTs) that showed venom-gland-specific expression, and these probably encode the minimal core venom effector proteins. Synthetic venom reconstituted through recombinant VST expression will aid in the rapid development of safe and effective synthetic antivenom. Additionally, our genome could serve as a reference for snake genomes, support evolutionary studies and enable venom-driven drug discovery.


Conflict of interest statement

Employees of Genentech hold Roche shares/options, and employees of MedGenome hold MedGenome shares/options.

Figures

Fig. 1
Fig. 1. Schematic of N. naja genome sequencing and assembly.
a,b, Long-read (PacBio and ONT) and short-read (lllumina) data (a) were used to build contigs that were then combined with Chicago chromatin interaction data (b) to generate scaffolds. c, Scaffolds from BNG optical mapping de novo assembly were combined with those from the previous step to generate super-scaffolds. d, Hi-C sequencing data were used to refine the assembly. e, Electronic fluorescence in situ hybridization (eFISH) was performed using cDNA FISH marker sequences from the Japanese rat snake, E. quadrivirgata. f, SChrom-seq data were used to assign scaffolds to chromosomes.
Fig. 2
Fig. 2. Genome architecture of N. naja genome.
a, Circos plot of the reference genome assembly (NN01, a male adult (n = 1)) representing N. naja chromosomes (outermost track) from the Nana_v5 assembly, repeat content, gene density and GC content (%). Regions of the genome with GC content higher than average (40.46%) are shown in blue. Regions within the gene density of more than 10 genes are shown as red spikes, while those with 5 to 10 genes are indicated by yellow spikes. Green spikes represent regions with fewer than five genes. The average repeat content is indicated by the red line. All data were plotted in 100-kb windows. The female-specific W-linked scaffold obtained using NN05 DNA is shown on the right. b, Chromosome painting depicting synteny between Indian cobra and rattlesnake genomes. c, Dot-plots showing synteny of the Indian cobra genome with the prairie rattlesnake, chicken or green anole lizard genomes. d, Bar plot of the number of predicted genes and corresponding transcripts observed in Nana_v5. Dashed and solid lines denote average number of genes and transcripts detected in each chromosome along 100-Mb windows, respectively. MICs were combined into one group. Unp, unplaced scaffolds (n = 1,878) containing predicted genes.
Fig. 3
Fig. 3. N. naja expression body map.
Heatmap showing log2(CPM) values of differentially upregulated genes (DUGs); FDR < 1% across 14 tissues (sample size n = 6) as indicated. NN01 and NN02 correspond to N. naja specimens obtained from Kerala, India. NN03, NN04, NN05 and NN06 correspond to N. naja specimens obtained from the Kentucky Reptile Zoo. Sg, salivary gland.
Fig. 4
Fig. 4. The N. naja venom gene repertoire.
a, Genomic organization of N. naja toxin gene families. bd, Arrayed venom gene organization of three major toxin gene families: 3FTx (b), SVMP (c) and CRISP (d). Genes that show venom-gland-specific expression are colored orange, and those with expression not restricted to venom glands are shown in magenta. Pseudogenes with no evidence for expression are shown in gray. e,f, Comparison showing the ancestral 3FTx (e) and CRISP (f) genes in lizard, and duplicated copies in the Indian cobra and prairie rattlesnake genomes. Orthologous gene pairs are indicated by shaded regions across the corresponding genomic regions. g, Schematic of filtering used to identify the 19 VSTs, and a heatmap showing the corresponding log2(CPM) values. NN01 and NN02 correspond to N. naja specimens obtained from Kerala, India. NN03, NN04, NN05 and NN06 correspond to N. naja specimens obtained from the Kentucky Reptile Zoo. FC, fold change; Chr, chomosome. Anatomical abbreviations as in Fig. 3.
Fig. 5
Fig. 5. Characterization of N. naja 3FTx gene family.
a, Multiple sequence alignment of the 19 3FTx proteins identified in the Indian cobra genome. Protein names in orange in the alignment indicate VSTs identified using RNA-seq. Conserved Cys residues are highlighted yellow in the alignment. be, Ribbon representations of representative 3FTxs from four different structural classes. Disulfide bonds are shown as sticks. The hydrophobic packing of Leu39 and surrounding residues is shown in c. Dashed circles highlight the additional disulfide bonds in Nana001KS, Nana012KS and the unpaired Cys in Nana005KS. f, Superimposition of ribbon models of Nana001KS, Nana003KS and Nana010KS highlighting the differences in loop length and conformation between the distinct classes of 3FTx found in the Indian cobra genome. g, Analysis of evolutionary rates on 3FTx venom genes and their non-venom paralogs. KA and KS values were calculated according to the Nei–Gojobori method. KA and KS with values <1 were not included in further analysis. SNTX, short neurotoxin; LNTX, long neurotoxin; MTLP, muscarinic toxin-like; CTX, cardiotoxin or cytotoxin; Nonc, non-conventional toxin; WTX, weak neurotoxin. SV, snake venom; NV, non-venom.
Fig. 6
Fig. 6. N. naja minimal venom cocktail.
The 19 VSTs, accessory venom proteins (AVPs) and their primary physiological targets. ECM, extracellular matrix; PDIs, protein disulfide isomerases. See Supplementary Table 6b (column L) for VST and AVP gene names.
Extended Data Fig. 1
Extended Data Fig. 1. Indian cobra genome size estimation by flow cytometry.
a, Gating strategy for Indian cobra (Naja naja) genome size estimation showing the propidium iodide (PI) positive sample within the elliptical gate. b, PI positive gated population in a histogram showing showing PI stained N. naja blood and Equus caballus (horse) lymphocytes. c, Table of median fluorescence intensities measured for Naja naja and Equus caballus and estimated genome size in Gb in 3 replicate experiments. A total of 3000 and 300 measurements were conducted for the Indian cobra and horse, respectively.
Extended Data Fig. 2
Extended Data Fig. 2. N. naja karyotyping.
Representative karyotype obtained from cultured red blood cells from a female animal NN03. A total of N = 15 cells were karyotyped.
Extended Data Fig. 3
Extended Data Fig. 3. Genomic repeat elements identified in the Indian cobra genome.
a, Bar plot of the percent distribution of the different classes of repeat elements in the N. naja genome (Nana_v5). b, Comparison of proportion of the repeat content among 4 published snake, green anole lizard genomes and the Indian cobra genome.
Extended Data Fig. 4
Extended Data Fig. 4. Syntenic comparisons of SVMP gene cluster.
Relevant syntenic genomic regions between the Indian cobra (Nana_v5), prairie rattlesnake and green anole lizard genomes are shown. Orthologous gene pairs are indicated by shaded regions across the corresponding genomic regions. Yellow arrows with blue border indicate gene synteny, while those without colored borders represent potential species-specific duplications. SVMP, snake venom metalloproteinase.
Extended Data Fig. 5
Extended Data Fig. 5. Heatmap of differentially upregulated genes in the N. naja venom gland transcriptome.
Protein families are indicated in colored bars. NN01 and NN02 correspond to N. naja specimens obtained from Kerala, India. NN03, NN04, NN05 and NN06 correspond to N. naja specimens obtained from the Kentucky reptile zoo. Expression values plotted as log2 transformed CPM values with FDR cutoff set at 1% used for differential expression analysis.
Extended Data Fig. 6
Extended Data Fig. 6. Pairwise structural comparison of representative N. naja 3FTxs.
RMSD matrix for the structural models from 9 representative 3FTxs.
Extended Data Fig. 7
Extended Data Fig. 7. nAChR polymorphism in Indian cobra.
Multiple sequence alignment showing the region surrounding the alpha neurotoxin binding site in nAChR of seven vertebrate animals and N. naja nAChR (Nana03380-RA) identified a SNP at residue 189 in the N. naja nAChR indicated by the blue arrow. nAChR – nicotinic acetylcholine receptor; DANRE – Danio rerio; CHICK, Gallus gallus; HERIC, Herpestes ichneumon; HUMAN, Homo sapiens; PANTR, Pan troglodytes; RAT, Rattus norvegicus; MOUSE, Mus musculus.
Extended Data Fig. 8
Extended Data Fig. 8. Molecular evolution of Indian cobra SVMP genes.
KA and KS values were calculated according to the Nei-Gojobori method. KA and KS with values < 0.1 were not included in further analysis for reliable analysis. NVMP, Non-venomous metalloproteinase genes; SVMP, Snake venom metalloproteinase genes.
Extended Data Fig. 9
Extended Data Fig. 9. SVMP expression and comparative protein sequence alignment.
a, Multiple sequence alignment of SVMP proteins from the Indian cobra, and representative SVMPs from other Elapid and Viperid species and human ADAM28. Arrows indicate additional cysteine residues typically present in the M12 domain of Viperidae SVMPs. b, Phylogenetic tree reveals distinct clusters formed by elapid and viperid SVMPs. The bar indicates 0.03 substitutions per nucleotide position. Elapid species - OPHHA, Ophiophagus hannah; NAJAT, Naja atra; NAJMO, Naja mossambica; NAJKA, Naja kaouthia; Viperid species - DABRR, Daboia ruselli; AGKCL, Agkistrodon contortrix laticinctus; DEIAC, Deinagkistrodon acutus; BOTJA, Bothrops jararaca; HUMAN, Homo sapiens.
Extended Data Fig. 10
Extended Data Fig. 10. Genetic polymorphisms in 6 N. naja specimens.
ad, Pairwise similarity (PWS) matrices based on (a), all genome-wide protein-altering variants, (b), all venom gland-expressed genes, (c), core venom-ome genes, and (d), all 3FTx genes identified in this study. e, Distribution of protein altering variants in 106 venom gland-specific toxin genes. f, Distribution of protein altering variants in 3FTx genes located on chromosome 3 across all six study animals (NN01-NN06). Within each track in (b-f), homozygous variants are shown as blue vertical lines while heterozygous variants are shown as red vertical lines. NN01 and NN02 correspond to N. naja specimens obtained from Kerala, India. NN03, NN04, NN05 and NN06 correspond to N. naja specimens obtained from the Kentucky reptile zoo. MIC, microchromosomes.

Comment in

References

    1. Hsiang, A. Y. et al. The origin of snakes: revealing the ecology, behavior, and evolutionary history of early snakes using genomics, phenomics, and the fossil record. BMC Evol. Biol.15, 87 (2015). - PMC - PubMed
    1. Fry, B. G. & Wuster, W. Assembling an arsenal: origin and evolution of the snake venom proteome inferred from phylogenetic analysis of toxin sequences. Mol. Biol. Evol.21, 870–883 (2004). - PubMed
    1. Fry, B. G. From genome to “venome”: molecular origin and evolution of the snake venom proteome inferred from phylogenetic analysis of toxin sequences and related body proteins. Genome Res.15, 403–420 (2005). - PMC - PubMed
    1. Zaher, H. et al. Large-scale molecular phylogeny, morphology, divergence-time estimation, and the fossil record of advanced caenophidian snakes (Squamata: Serpentes). PLoS ONE14, e0216148 (2019). - PMC - PubMed
    1. Pyron, R. A., Burbrink, F. T. & Wiens, J. J. A phylogeny and revised classification of Squamata, including 4161 species of lizards and snakes. BMC Evol. Biol.13, 93 (2013). - PMC - PubMed

Publication types