

DNA methylation is involved in the regulation of pepper fruit ripening and interacts with phytohormones
- PMID: 31907544
- PMCID: PMC7242076
- DOI: 10.1093/jxb/eraa003
DNA methylation is involved in the regulation of pepper fruit ripening and interacts with phytohormones
Abstract
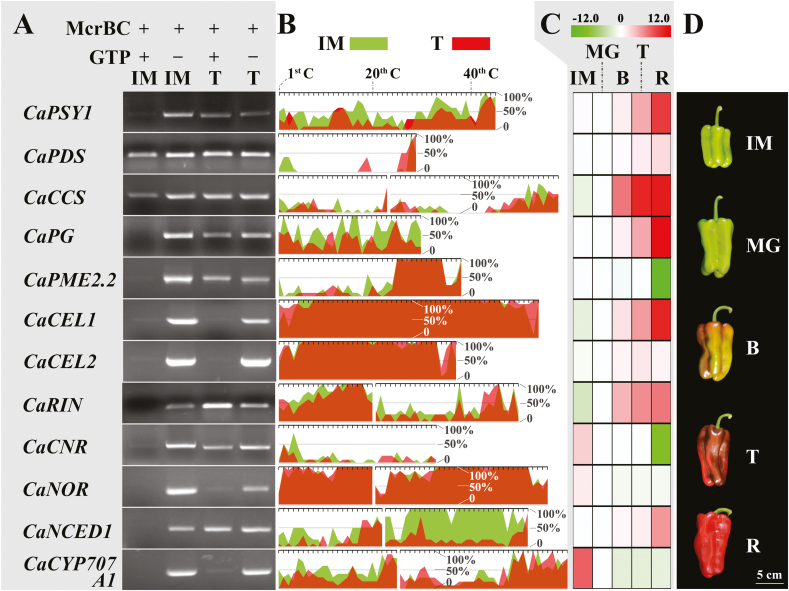
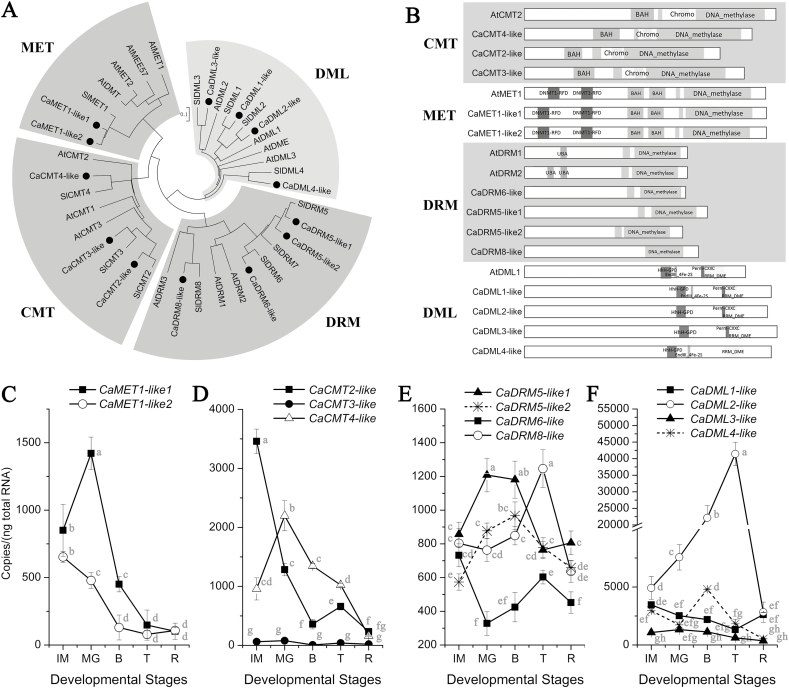
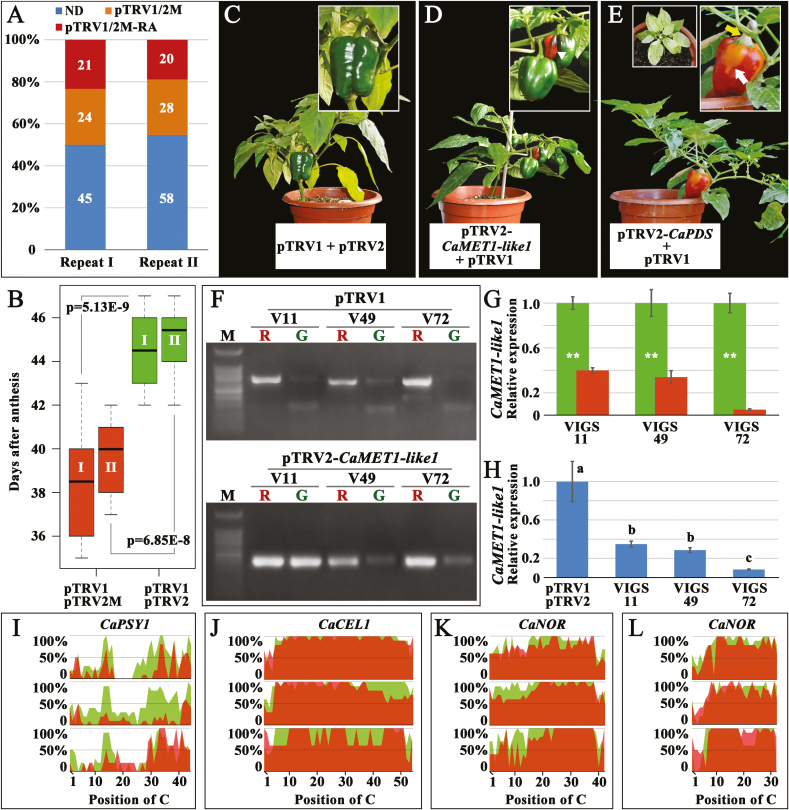
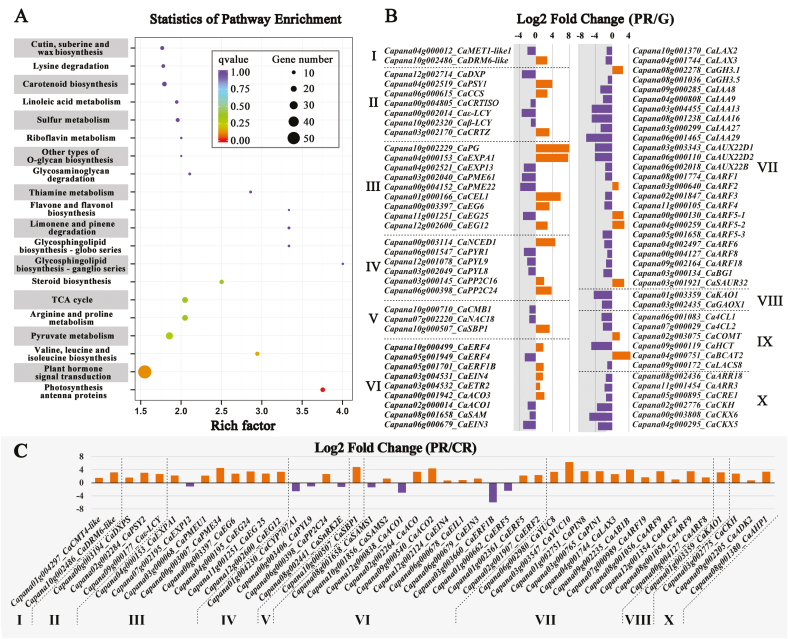
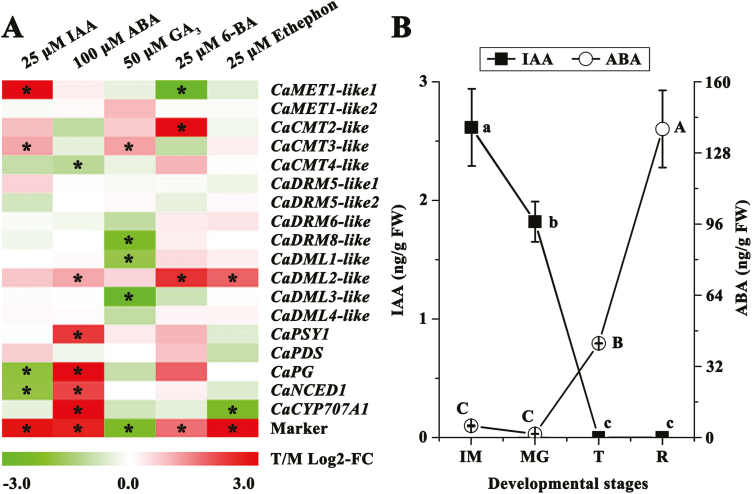
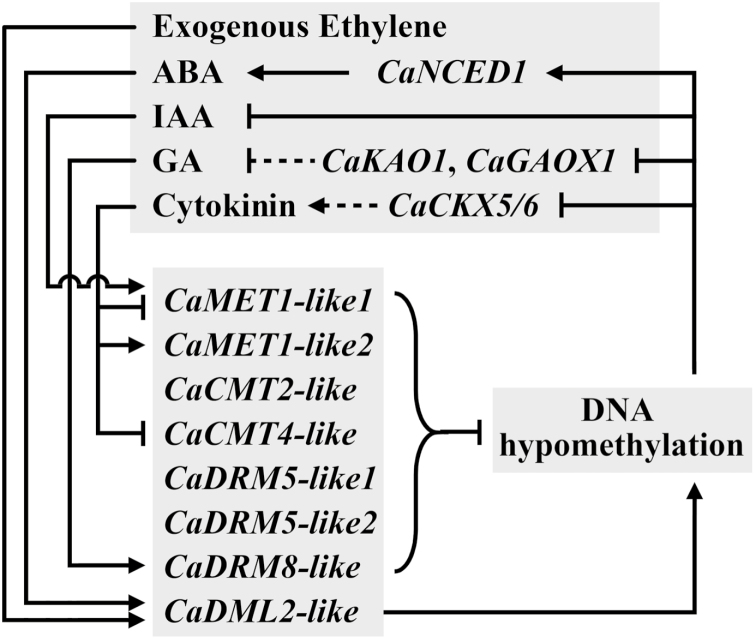
There is growing evidence to suggest that epigenetic tags, especially DNA methylation, are critical regulators of fruit ripening. To examine whether this is the case in sweet pepper (Capsicum annuum) we conducted experiments at the transcriptional, epigenetic, and physiological levels. McrBC PCR, bisulfite sequencing, and real-time PCR demonstrated that DNA hypomethylation occurred in the upstream region of the transcription start site of some genes related to pepper ripening at the turning stage, which may be attributed to up-regulation of CaDML2-like and down-regulation of CaMET1-like1, CaMET1-like2, CaCMT2-like, and CaCMT4-like. Silencing of CaMET1-like1 by virus-induced gene silencing led to DNA hypomethylation, increased content of soluble solids, and accumulation of carotenoids in the fruit, which was accompanied by changes in expression of genes involved in capsanthin/capsorubin biosynthesis, cell wall degradation, and phytohormone metabolism and signaling. Endogenous ABA increased during fruit ripening, whereas endogenous IAA showed an opposite trend. No ethylene signal was detected during ripening. DNA hypomethylation repressed the expression of auxin and gibberellin biosynthesis genes as well as cytokinin degradation genes, but induced the expression of ABA biosynthesis genes. In mature-green pericarp, exogenous ABA induced expression of CaDML2-like but repressed that of CaCMT4-like. IAA treatment promoted the transcription of CaMET1-like1 and CaCMT3-like. Ethephon significantly up-regulated the expression of CaDML2-like. Treatment with GA3 and 6-BA showed indistinct effects on DNA methylation at the transcriptional level. On the basis of the results, a model is proposed that suggests a high likelihood of a role for DNA methylation in the regulation of ripening in the non-climacteric pepper fruit.
Keywords: Carotenoids; DNA methylation; fruit ripening; gene expression; pepper; plant hormone.
© The Author(s) 2020. Published by Oxford University Press on behalf of the Society for Experimental Biology. All rights reserved. For permissions, please email: journals.permissions@oup.com.
Figures
Similar articles
-
Characterization of the hot pepper (Capsicum frutescens) fruit ripening regulated by ethylene and ABA.BMC Plant Biol. 2018 Aug 10;18(1):162. doi: 10.1186/s12870-018-1377-3. BMC Plant Biol. 2018. PMID: 30097017 Free PMC article.
-
Analysis of eight phytohormone concentrations, expression levels of ABA biosynthesis genes, and ripening-related transcription factors during fruit development in strawberry.J Plant Physiol. 2019 Aug;239:52-60. doi: 10.1016/j.jplph.2019.05.013. Epub 2019 Jun 3. J Plant Physiol. 2019. PMID: 31185317
-
An R-R-type MYB transcription factor promotes non-climacteric pepper fruit carotenoid pigment biosynthesis.Plant J. 2023 Aug;115(3):724-741. doi: 10.1111/tpj.16257. Epub 2023 May 11. Plant J. 2023. PMID: 37095638
-
Transcriptional Regulation of Ripening in Chili Pepper Fruits (Capsicum spp.).Int J Mol Sci. 2021 Nov 10;22(22):12151. doi: 10.3390/ijms222212151. Int J Mol Sci. 2021. PMID: 34830031 Free PMC article. Review.
-
Non-climacteric fruit development and ripening regulation: 'the phytohormones show'.J Exp Bot. 2023 Oct 31;74(20):6237-6253. doi: 10.1093/jxb/erad271. J Exp Bot. 2023. PMID: 37449770 Free PMC article. Review.
Cited by
-
Multi-Omics Landscape of DNA Methylation Regulates Browning in "Fuji" Apple.Front Nutr. 2022 Feb 7;8:800489. doi: 10.3389/fnut.2021.800489. eCollection 2021. Front Nutr. 2022. PMID: 35198585 Free PMC article.
-
Plant carotenoids: recent advances and future perspectives.Mol Hortic. 2022 Jan 21;2(1):3. doi: 10.1186/s43897-022-00023-2. Mol Hortic. 2022. PMID: 37789426 Free PMC article. Review.
-
Genome and transcriptome-wide study of carbamoyltransferase genes in major fleshy fruits: A multi-omics study of evolution and functional significance.Front Plant Sci. 2022 Nov 3;13:994159. doi: 10.3389/fpls.2022.994159. eCollection 2022. Front Plant Sci. 2022. PMID: 36407603 Free PMC article.
-
DNA Methylation and RNA-Sequencing Analysis Show Epigenetic Function During Grain Filling in Foxtail Millet (Setaria italica L.).Front Plant Sci. 2021 Aug 27;12:741415. doi: 10.3389/fpls.2021.741415. eCollection 2021. Front Plant Sci. 2021. PMID: 34512708 Free PMC article.
-
Hypermethylation in the promoter regions of flavonoid pathway genes is associated with skin color fading during 'Daihong' apple fruit development.Hortic Res. 2024 Feb 15;11(3):uhae031. doi: 10.1093/hr/uhae031. eCollection 2024 Mar. Hortic Res. 2024. PMID: 38481937 Free PMC article.
References
-
- Alós E, Cercós M, Rodrigo MJ, Zacarías L, Talón M. 2006. Regulation of color break in citrus fruits. Changes in pigment profiling and gene expression induced by gibberellins and nitrate, two ripening retardants. Journal of Agricultural and Food Chemistry 54, 4888–4895. - PubMed
-
- Bender J. 2004. DNA methylation and epigenetics. Annual Review of Plant Biology 55, 41–68. - PubMed
-
- Biale JB. 1978. On the interface of horticulture and plant physiology. Annual Review of Plant Biology 29, 1–24.
-
- Böttcher C, Harvey KE, Forde CG, Boss PK, Davies C. 2011. Auxin treatment of pre-veraison grape (Vitis vinifera L.) berries both delays ripening and increases the synchronicity of sugar accumulation. Australian Journal of Grape and Wine Research 17, 1–8.
Publication types
MeSH terms
Substances
LinkOut - more resources
Full Text Sources
