

Hyaluronan deposition in islets may precede and direct the location of islet immune-cell infiltrates
- PMID: 31907557
- PMCID: PMC7002022
- DOI: 10.1007/s00125-019-05066-7
Hyaluronan deposition in islets may precede and direct the location of islet immune-cell infiltrates
Abstract
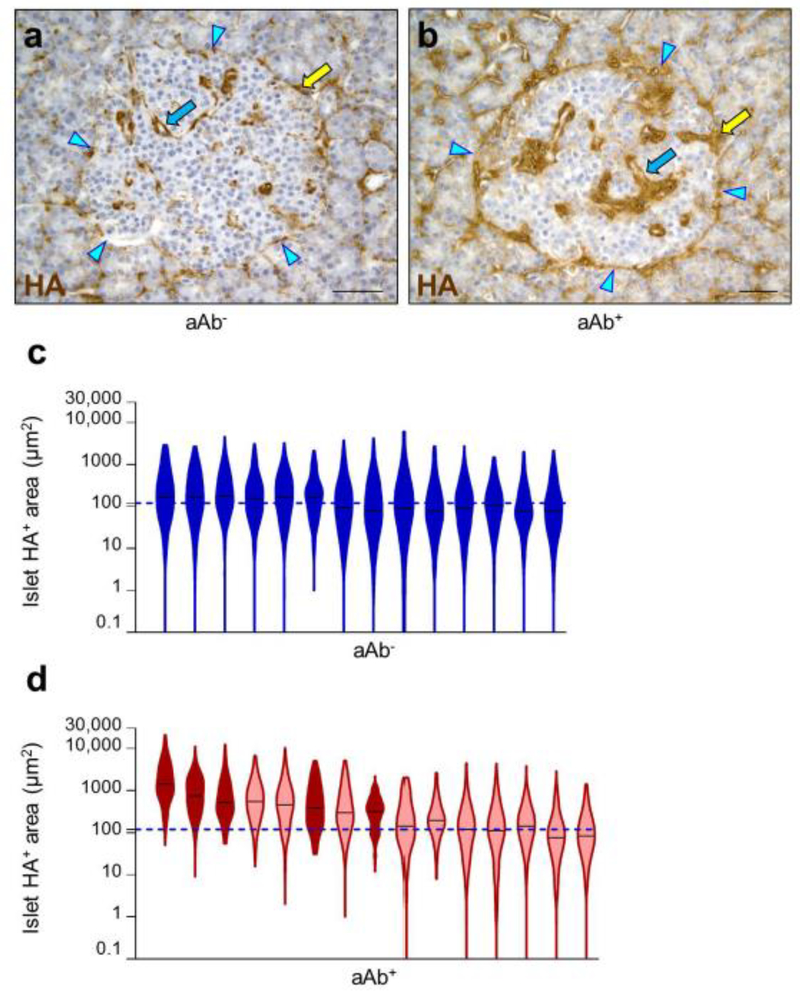
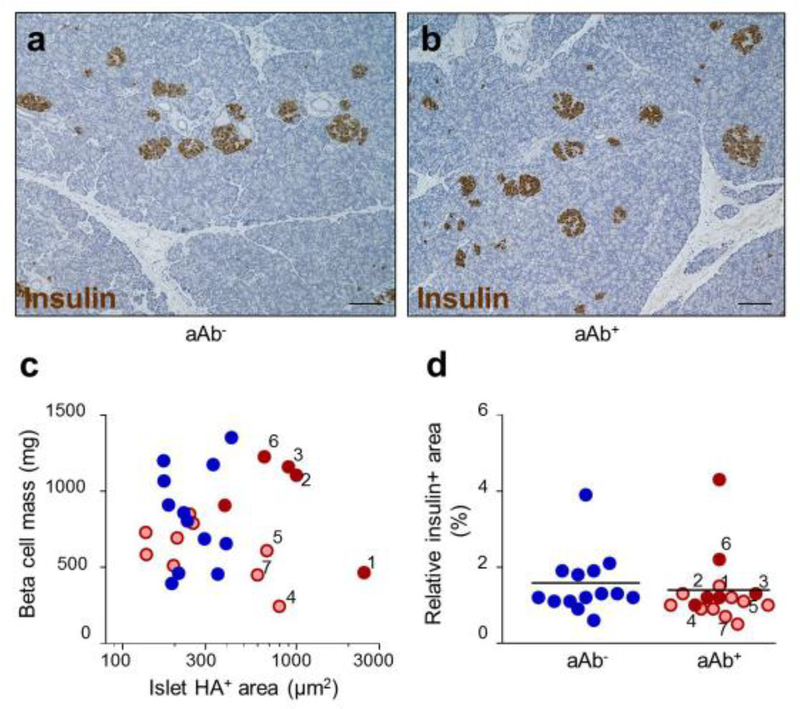
Aims/hypothesis: Substantial deposition of the extracellular matrix component hyaluronan (HA) is characteristic of insulitis in overt type 1 diabetes. We investigated whether HA accumulation is detectable in islets early in disease pathogenesis and how this affects the development of insulitis and beta cell mass.
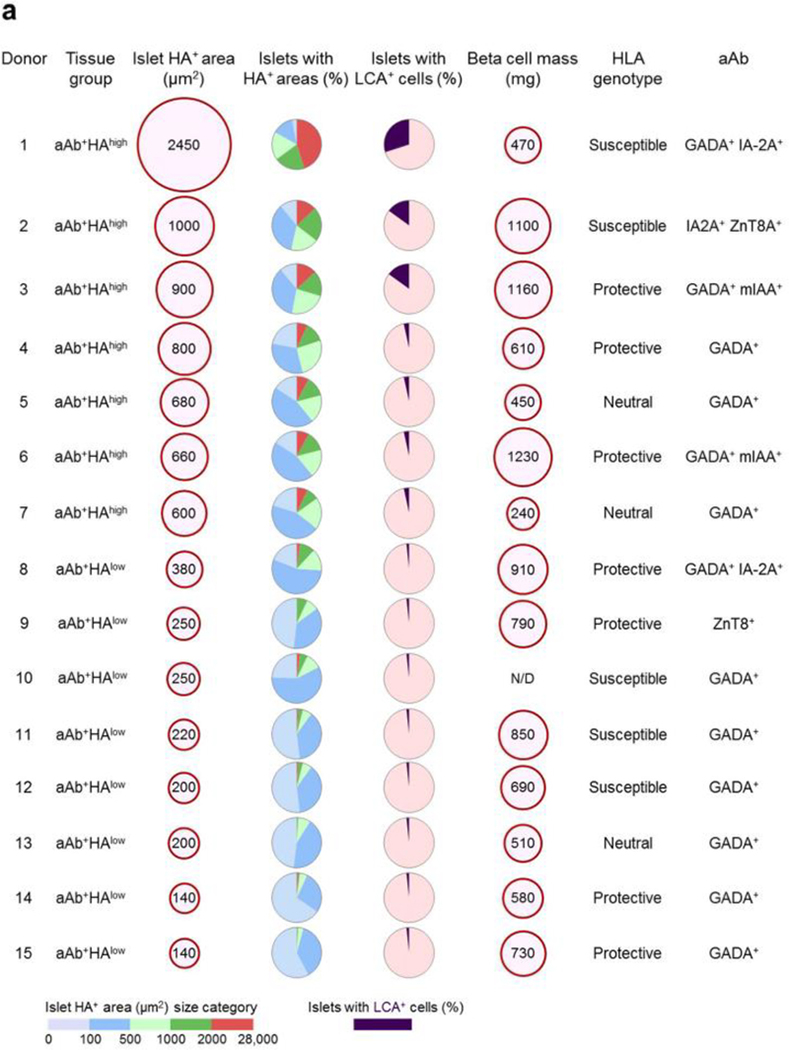
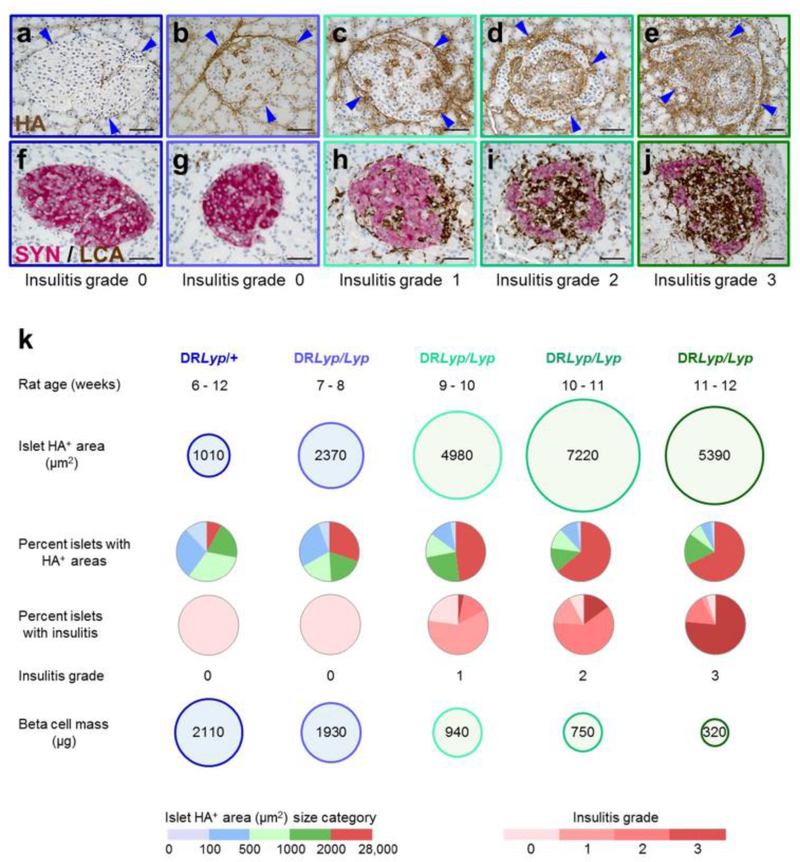
Methods: Pancreas tissue from 15 non-diabetic organ donors who were positive for islet autoantibodies (aAbs) and from 14 similarly aged aAb- control donors were examined for the amount of islet HA staining and the presence of insulitis. The kinetics of HA deposition in islets, along with the onset and progression of insulitis and changes in beta cell mass, were investigated in BioBreeding DRLyp/Lyp rats (a model of spontaneous autoimmune diabetes) from 40 days of age until diabetes onset.
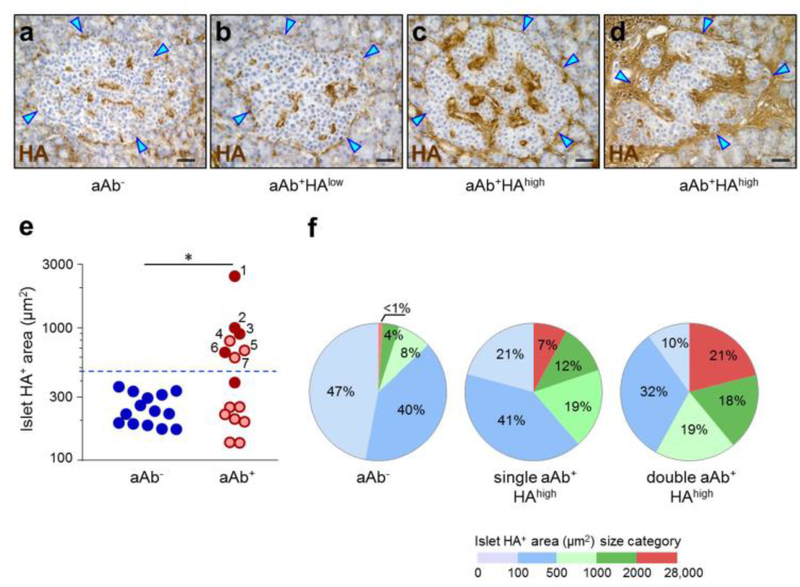
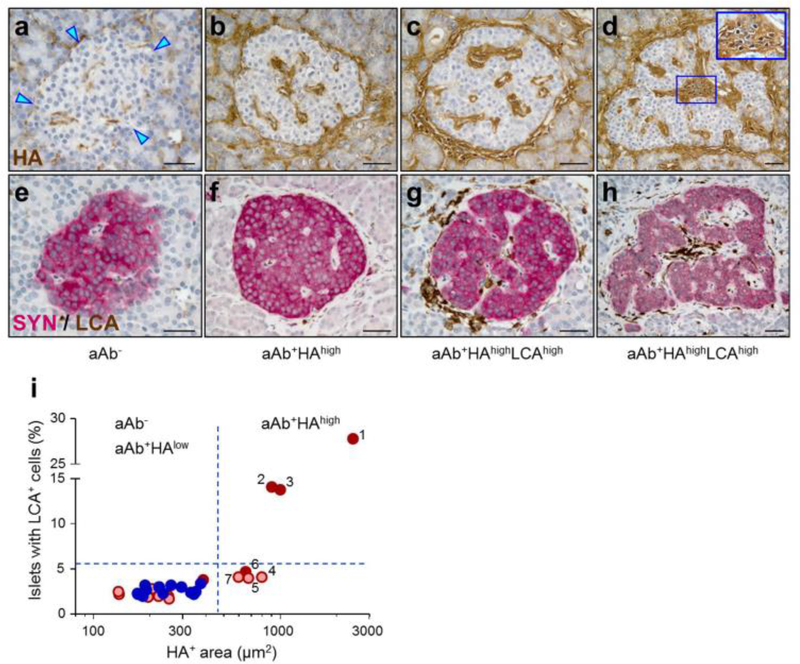
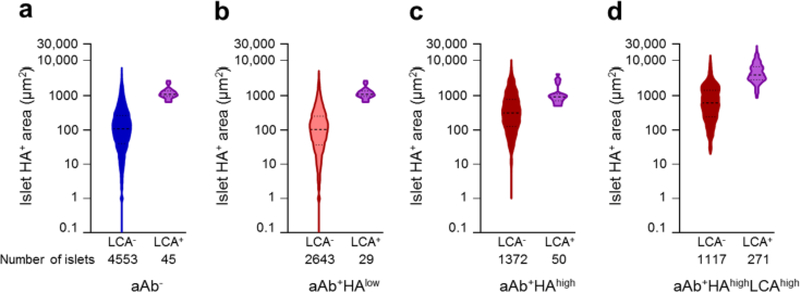
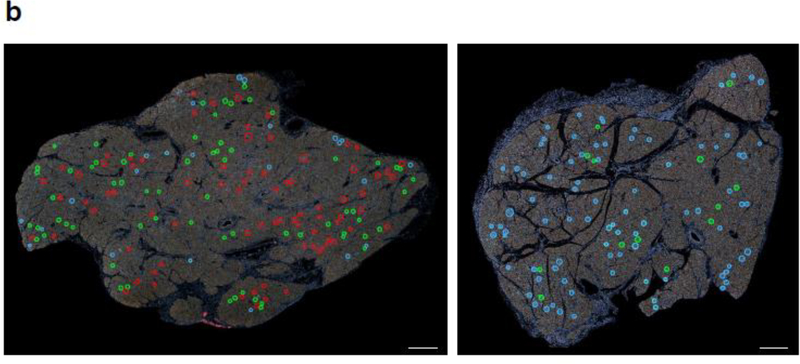
Results: Abundant islet HA deposits were observed in pancreas tissues from n = 3 single- and n = 4 double-aAb+ donors (aAb+HAhigh). In these seven tissues, the HA-stained areas in islets measured 1000 ± 240 μm2 (mean ± SEM) and were fourfold larger than those from aAb- control tissues. The aAb+HAhigh tissues also had a greater prevalence of islets that were highly rich in HA (21% of the islets in these tissues contained the largest HA-stained areas [>2000 μm2] vs less than 1% in tissues from aAb- control donors). The amount of HA staining in islets was associated with the number of aAbs (i.e. single- or double-aAb positivity) but not with HLA genotype or changes in beta cell mass. Among the seven aAb+HAhigh tissues, three from single- and one from double-aAb+ donors did not show any islet immune-cell infiltrates, indicating that HA accumulates in aAb+ donors independently of insulitis. The three aAb+HAhigh tissues that exhibited insulitis had the largest HA-stained areas and, in these tissues, islet-infiltrating immune cells co-localised with the most prominent HA deposits (i.e. with HA-stained areas >2000 μm2). Accumulation of HA in islets was evident prior to insulitis in 7-8-week-old presymptomatic DRLyp/Lyp rats, in which the islet HA-stained area measured 2370 ± 170 μm2 (mean ± SEM), which was threefold larger than in 6-week-old rats. This initial islet HA deposition was not concurrent with beta cell loss. Insulitis was first detected in 9-10-week-old rats, in which the HA-stained areas were 4980 ± 500 μm2. At this age, the rats also exhibited a 44% reduction in beta cell mass. Further enlargement of the HA-positive areas (mean ± SEM: 7220 ± 880 μm2) was associated with invasive insulitis. HA deposits remained abundant in the islets of rats with destructive insulitis, which had lost 85% of their beta cells.
Conclusions/interpretation: This study indicates that HA deposition in islets occurs early in type 1 diabetes and prior to insulitis, and points to a potential role of HA in triggering islet immune-cell infiltration and the promotion of insulitis.
Keywords: Autoantibodies; Extracellular matrix; Hyaluronan; Insulitis; Islet; Type 1 diabetes.
Figures
Similar articles
-
Early deficits in insulin secretion, beta cell mass and islet blood perfusion precede onset of autoimmune type 1 diabetes in BioBreeding rats.Diabetologia. 2018 Apr;61(4):896-905. doi: 10.1007/s00125-017-4512-z. Epub 2017 Dec 6. Diabetologia. 2018. PMID: 29209740 Free PMC article.
-
Insulitis and β-Cell Mass in the Natural History of Type 1 Diabetes.Diabetes. 2016 Mar;65(3):719-31. doi: 10.2337/db15-0779. Epub 2015 Nov 18. Diabetes. 2016. PMID: 26581594 Free PMC article.
-
The Vbeta13 T Cell Receptor Monoclonal Antibody Reduces Hyaluronan and CD68+, CD3+, and CD8+ Cell Infiltrations to Delay Diabetes in Congenic BB DRLyp/Lyp Rats.Front Endocrinol (Lausanne). 2021 Mar 16;12:629242. doi: 10.3389/fendo.2021.629242. eCollection 2021. Front Endocrinol (Lausanne). 2021. PMID: 33815287 Free PMC article.
-
Hyaluronan: A Mediator of Islet Dysfunction and Destruction in Diabetes?J Histochem Cytochem. 2015 Aug;63(8):592-603. doi: 10.1369/0022155415576542. J Histochem Cytochem. 2015. PMID: 26216136 Free PMC article. Review.
-
The role of hyaluronan and the extracellular matrix in islet inflammation and immune regulation.Curr Diab Rep. 2012 Oct;12(5):471-80. doi: 10.1007/s11892-012-0297-0. Curr Diab Rep. 2012. PMID: 22810951 Free PMC article. Review.
Cited by
-
Modulation of hyaluronan signaling as a therapeutic target in human disease.Pharmacol Ther. 2022 Apr;232:107993. doi: 10.1016/j.pharmthera.2021.107993. Epub 2021 Sep 26. Pharmacol Ther. 2022. PMID: 34587477 Free PMC article. Review.
-
Detection of Glycosaminoglycans in Pancreatic Islets and Lymphoid Tissues.Methods Mol Biol. 2022;2303:695-717. doi: 10.1007/978-1-0716-1398-6_53. Methods Mol Biol. 2022. PMID: 34626417
-
The pathogenic "symphony" in type 1 diabetes: A disorder of the immune system, β cells, and exocrine pancreas.Cell Metab. 2023 Sep 5;35(9):1500-1518. doi: 10.1016/j.cmet.2023.06.018. Epub 2023 Jul 20. Cell Metab. 2023. PMID: 37478842 Free PMC article. Review.
-
Diabetes as a Pancreatic Microvascular Disease-A Pericytic Perspective.J Histochem Cytochem. 2024 Mar;72(3):131-148. doi: 10.1369/00221554241236535. Epub 2024 Mar 7. J Histochem Cytochem. 2024. PMID: 38454609 Free PMC article. Review.
-
Sulfation pathways in the maintenance of functional beta-cell mass and implications for diabetes.Essays Biochem. 2024 Dec 4;68(4):509-522. doi: 10.1042/EBC20240034. Essays Biochem. 2024. PMID: 39290144 Free PMC article. Review.
References
-
- Bingley PJ, Bonifacio E, Williams AJ, Genovese S, Bottazzo GF, Gale EA (1997) Prediction of IDDM in the general population: strategies based on combinations of autoantibody markers. Diabetes 46(11): 1701–1710 - PubMed
Publication types
MeSH terms
Substances
Grants and funding
LinkOut - more resources
Full Text Sources
Medical
Research Materials
