. 2020 Feb;34(2):2392-2407.
doi: 10.1096/fj.201902227R. Epub 2019 Dec 23.

Regulatory network mediated by RBP-J/NFATc1-miR182 controls inflammatory bone resorption

Affiliations

Regulatory network mediated by RBP-J/NFATc1-miR182 controls inflammatory bone resorption

Kazuki Inoue et al. FASEB J. 2020 Feb.

Abstract

Bone resorption is a severe consequence of inflammatory diseases associated with osteolysis, such as rheumatoid arthritis (RA), often leading to disability in patients. In physiological conditions, the differentiation of bone-resorbing osteoclasts is delicately regulated by the balance between osteoclastogenic and anti-osteoclastogenic mechanisms. Inflammation has complex impact on osteoclastogenesis and bone destruction, and the underlying mechanisms of which, especially feedback inhibition, are underexplored. Here, we identify a novel regulatory network mediated by RBP-J/NFATc1-miR182 in TNF-induced osteoclastogenesis and inflammatory bone resorption. This network includes negative regulator RBP-J and positive regulators, NFATc1 and miR182, of osteoclast differentiation. In this network, miR182 is a direct target of both RBP-J and NFATc1. RBP-J represses, while NFATc1 activates miR182 expression through binding to specific open chromatin regions in the miR182 promoter. Inhibition of miR182 by RBP-J servers as a critical mechanism that limits TNF-induced osteoclast differentiation and inflammatory bone resorption. Inflammation, such as that which occurs in RA, shifts the expression levels of the components in this network mediated by RBP-J/NFATc1-miR182-FoxO3/PKR (previously identified miR182 targets) towards more osteoclastogenic, rather than healthy conditions. Treatment with TNF inhibitors in RA patients reverses the expression changes of the network components and osteoclastogenic potential. Thus, this network controls the balance between activating and repressive signals that determine the extent of osteoclastogenesis. These findings collectively highlight the biological significance and translational implication of this newly identified intrinsic regulatory network in inflammatory osteoclastogenesis and osteolysis.

Keywords: inflammatory bone resorption; osteoclast; osteoimmunology; rheumatoid arthritis.


Conflict of interest statement

Disclosures: The authors have no conflict of interest.

Figures

Figure 1.
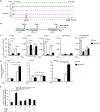
Figure 1.. RBP-J directly targets miR182 and represses its expression.
A. miRNA-seq aligned reads at murine miR182/96/183 locus displayed by Integrative Genomics Viewer (IGV). The Ctrl or RbpjΔM/ΔM BMMs were stimulated or not with TNFα (40 ng/ml) for 48 h, and miRNAs were extracted and subjected to miRNA-seq. A representative of read signals at the miR182/96/183 locus from two independent miRNA-seq datasets (GSE72966) is shown. B. A diagram depicting three putative RBP-J-binding motifs in the mouse miR-182 promoter region. C. ChIP analysis of RBP-J occupancy at the indicated loci in the Ctrl or RbpjΔM/ΔM BMMs stimulated or not with TNFα (40 ng/ml) for 48 h. D. FAIRE analysis of chromatin accessibility at the miR-182 promoter in the Ctrl or RbpjΔM/ΔM BMMs stimulated or not with TNFα (40 ng/ml) for 48 h. E. miR-182 promoter activities measured from the RAW264.7 cells transfected with the miR182 promoter reporter plasmid and/or RBP-J expression plasmid in the absence or presence of TNFα (40 ng/ml) for 48 h (n=3). Data are mean ± SEM. *p < 0.05; **p < 0.01; n.s., not statistically significant.
Figure 2.
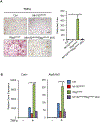
Figure 2.. Overexpression of miR182 promotes TNF-induced osteoclastogenesis.
A. Osteoclast differentiation using BMMs derived from Ctrl and Mir182mTg mice stimulated with or without TNFα (40 ng/mL) for three days. TRAP staining (left panel) was performed and the area of TRAP-positive MNCs (≥ 3 nuclei/cell) per well relative to the control was calculated (right panel). TRAP-positive cells appear red in the photographs. Scale bar: 200 μm. B. Quantitative real-time PCR (qPCR) analysis of mRNA expression of Nfatc1 (encoding NFATc1), Prdm1 (encoding Blimp1), Ctsk (encoding cathepsin K), Calcr (encoding calcitonin receptor) and Acp5 (encoding TRAP) during osteoclastogenesis using BMMs from the Ctrl and Mir182mTg mice treated with or without TNFα for two days. C. Immunoblot analysis of the expression of NFATc1, Blimp1 and IRF8 induced by TNFα at the indicated times. GAPDH was used as a loading control. Data are mean ± SEM. **p < 0.01.
Figure 3.
Figure 3.. miR182 deficiency abolishes RBP-J inhibited osteoclastogenesis.
A. Osteoclast differentiation using BMMs derived from Ctrl, Mir182ΔM/ΔM, RbpjΔM/ΔM, and Mir182ΔM/ΔMRbpjΔM/ΔM dKO mice stimulated with TNFα (40 ng/mL) for three days. TRAP staining (left panel) was performed and the area of TRAP-positive MNCs (≥ 3 nuclei/ cell) per well was quantified (right panel). TRAP-positive cells appear red in the photographs. Scale bar: 200 μm. B. qPCR analysis of mRNA expression of Calcr and Atp6v0d2 (encoding V-type proton ATPase subunit d 2) during osteoclastogenesis using BMMs from Ctrl, Mir182ΔM/ΔM, RbpjΔM/ΔM, and Mir182ΔM/ΔMRbpjΔM/ΔM dKO mice stimulated with TNFα (40 ng/mL) for three days. Data are mean ± SEM. **p < 0.01; n.s., not statistically significant.
Figure 4.
Figure 4.. miR182 deficiency rescues the TNF-induced bone resorption in RbpjΔM/ΔM mice.
A. μCT images (left panel) and the quantification of pit area (right panel) of the surface of whole calvaria, B. TRAP staining of calvarial histological sections and C. histomorphometric analysis of calvarial slices obtained from Ctrl, Mir182ΔM/ΔM, RbpjΔM/ΔM, and Mir182ΔM/ΔMRbpjΔM/ΔM dKO mice after the application of TNFα daily for five days to the calvarial periosteum. n=5 per group. Oc.S/BS, osteoclast surface per bone surface; N.Oc/B.Pm, number of osteoclasts per bone perimeter. Data are mean ± SEM. **p < 0.01; n.s., not statistically significant. Scale bars: A, 1.0 mm ; B, 200 μm.
Figure 5.
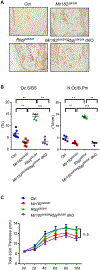
Figure 5.. miR182 deficiency protects Mir182ΔM/ΔMRbpjΔM/ΔM dKO mice from bone erosion in inflammatory arthritis.
A. TRAP staining of histological sections of tarsal joints (Scale bar: 200 μm) and B. histomorphometric analysis of the tarsal joint sections obtained from the indicated mice that developed K/BxN serum-induced arthritis. ES/BS, erosion surface per bone surface. Oc.S/BS, osteoclast surface per bone surface; N.Oc/B.Pm, number of osteoclasts per bone perimeter. n = 5 per group. Data are mean ± SEM. **p < 0.01; n.s., not statistically significant. C. Time course of joint swelling of inflammatory arthritis developed in Ctrl, Mir182ΔM/ΔM, RbpjΔM/ΔM, and Mir182ΔM/ΔMRbpjΔM/ΔM dKO mice. For each mouse, joint swelling was calculated as the sum of measurements of joint thickness of two wrists and two ankles. n = 5 per group. Joint swelling is represented as the mean ± SD for each group. n.s., not statistically significant.
Figure 6.
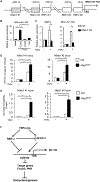
Figure 6.. NFATc1 directly targets miR182 and activates its expression.
A. A diagram depicting two putative NFATc1 binding sites and three RBPJ binding motifs in the mouse miR-182 promoter region. B. qPCR analysis of mature mouse miR-182 (mmu-mir-182) expression using BMMs from the WT mice treated with FK506 (10 ug/ml), CsA (10 ug/ml) or the control DMSO vehicle for two days in the presence or absence of TNFα. C. qPCR analysis of mature mouse miR182 (mmu-mir-182) expression using BMMs from the control and Nfatc1 KO mice treated with or without TNFα for two days. D. ChIP analysis of NFATc1 occupancy at the indicated loci in the miR182 promoter in the Ctrl or RbpjΔM/ΔM BMMs stimulated or not with TNFα (40 ng/ml) for 48 h. E. FAIRE analysis of chromatin accessibility at the NFATc1 binding sites in the miR-182 promoter in the Ctrl or RbpjΔM/ΔM BMMs stimulated or not with TNFα (40 ng/ml) for 48 h. F. A model showing a regulatory network, in which RBPJ suppresses the expression of NFATc1 and miR182, miR182 as a direct target receives negative regulatory signals from RBP-J but positive signals from NFATc1, and miR182 further regulates osteoclastogenesis via its targets, PKR and FoxO3. Data are mean ± SEM. **p < 0.01.
Figure 7.
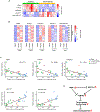
Figure 7.. The RBP-J/NFATc1-miR182-PKR/FoxO3 network is significantly correlated with RA.
A. Heat map showing gene expression of RBPJ, FOXO3, EIF2AK2, NFATC1, Hsa-miR-182 in human CD14(+) PBMCs from healthy donors and RA patients. n = 10/group. B. Heat maps showing gene expressions of RBPJ, FOXO3, EIF2AK2, NFATC1, Hsa-miR-182 in human CD14(+) PBMCs from RA patients before (basal) and after TNFi (Enbrel) for 1 and 2 months. n = 10/group. C. Scatter plots showing that the relative TRAP-positive osteoclast area obtained from RA CD14(+) PBMC cell cultures has a significant negative correlation with RBP-J (upper left), FOXO3 (upper middle) or EIF2AK2 (upper right) expression, and a significant positive correlation with NFATC1 (lower left) or Hsa-mir-182 (lower right) expression. Each triangle represents an RA patient in the indicated conditions. Pearson’s R = −0.771 (RBPJ), −0.663 (FOXO3), - 0.611 (EIF2AK2), 0.7764 (NFATC1) and 0.748 (Hsa-miR-182). p value = 0.0000108 (RBPJ), 0.0000658 (FOXO3), 0.000332 (EIF2AK2), 0.000000456 (NFATC1) or 0.00000388 (Hsa-miR-182). D. A model showing the expression changes of the key components of the RBP-J/NFATc1-miR182 network under RA inflammatory conditions, in which the negative regulators RBP-J, FOXO3 and PKR are downregulated while positive osteoclastogenic factors NFATC1 and miR-182 are upregulated, leading to an overall enhanced osteoclastogenesis in RA.

Similar articles

Cited by

References

    1. Schett G, and Gravallese E (2012) Bone erosion in rheumatoid arthritis: mechanisms, diagnosis and treatment. Nat Rev Rheumatol 8, 656–664 - PMC - PubMed
    1. Novack DV, and Teitelbaum SL (2008) The osteoclast: friend or foe? Annu Rev Pathol 3, 457–484 - PubMed
    1. Schett G, and Teitelbaum SL (2009) Osteoclasts and arthritis. Journal of bone and mineral research : the official journal of the American Society for Bone and Mineral Research 24, 1142–1146 - PubMed
    1. Boyce BF, Yao Z, Zhang Q, Guo R, Lu Y, Schwarz EM, and Xing L (2007) New roles for osteoclasts in bone. Ann N Y Acad Sci 1116, 245–254 - PubMed
    1. Sato K, and Takayanagi H (2006) Osteoclasts, rheumatoid arthritis, and osteoimmunology. Current opinion in rheumatology 18, 419–426 - PubMed

Publication types

MeSH terms

Substances

LinkOut - more resources