. 2020 Jan 7:9:e49555.
doi: 10.7554/eLife.49555.

Decreasing human body temperature in the United States since the industrial revolution

Affiliations

Decreasing human body temperature in the United States since the industrial revolution

Myroslava Protsiv et al. Elife. .

Abstract

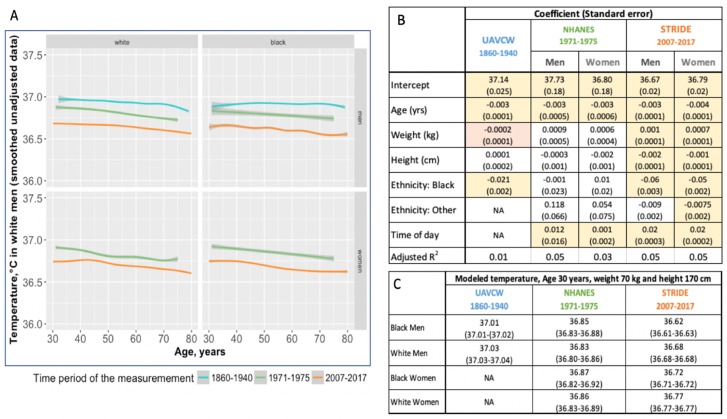
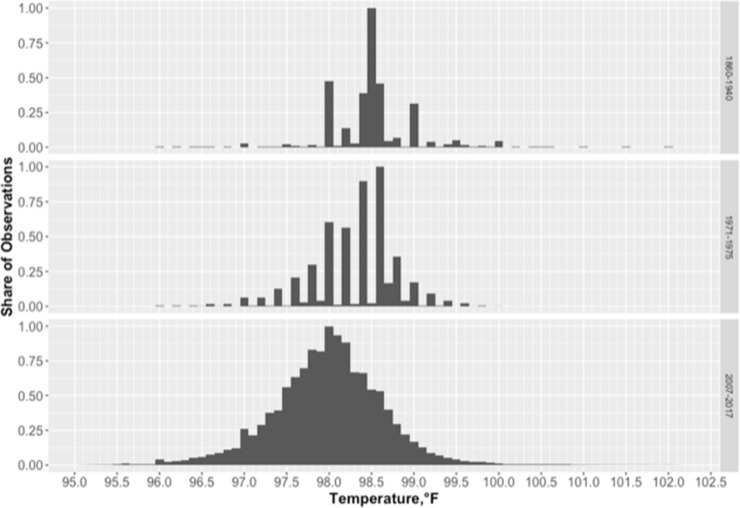
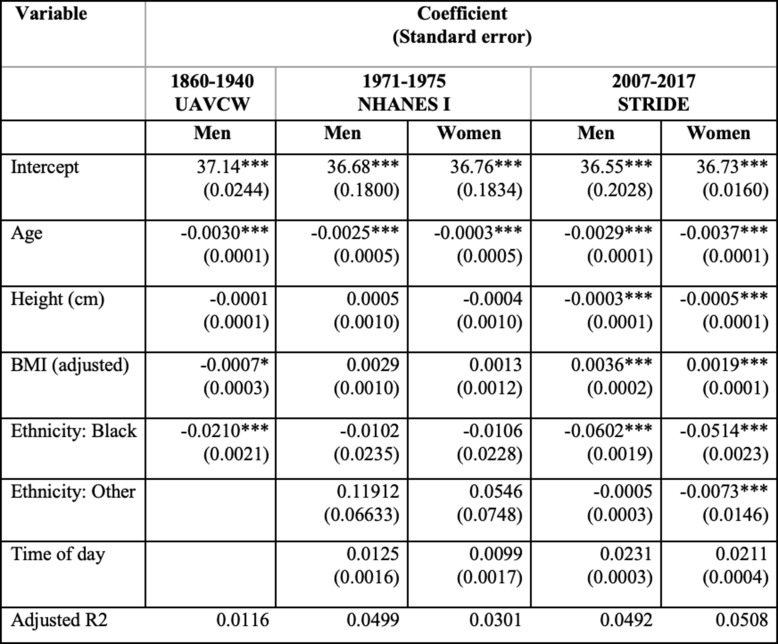
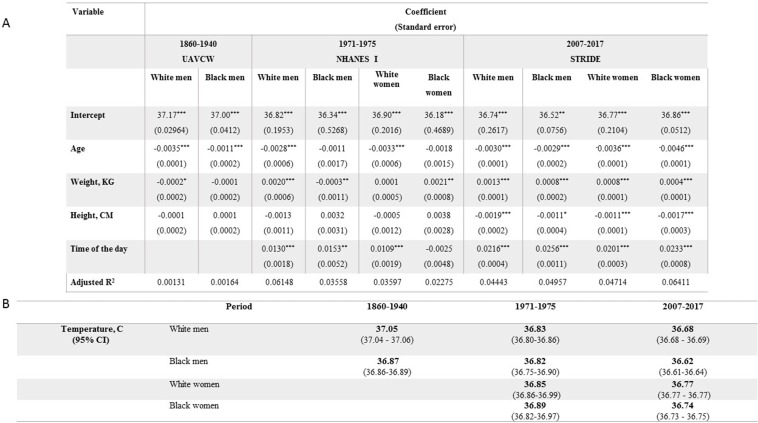
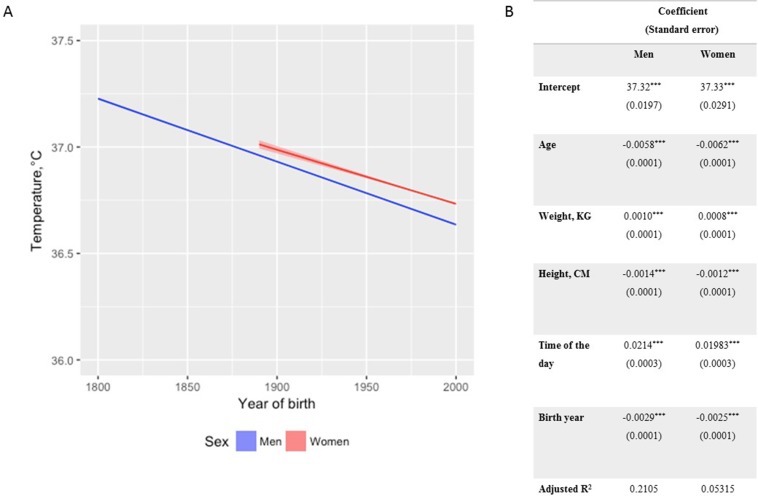
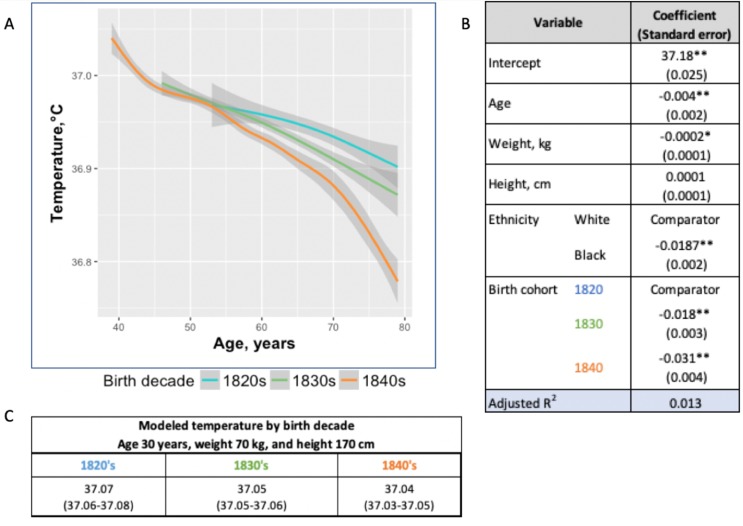
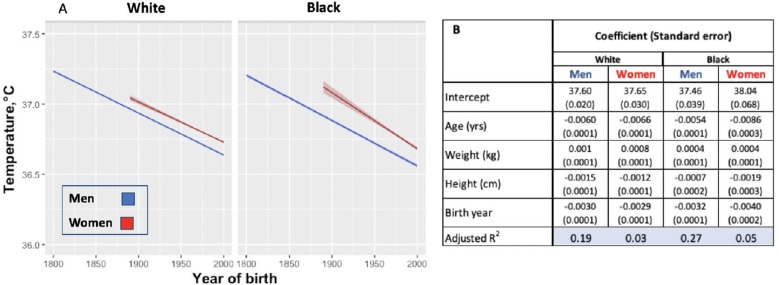
In the US, the normal, oral temperature of adults is, on average, lower than the canonical 37°C established in the 19th century. We postulated that body temperature has decreased over time. Using measurements from three cohorts--the Union Army Veterans of the Civil War (N = 23,710; measurement years 1860-1940), the National Health and Nutrition Examination Survey I (N = 15,301; 1971-1975), and the Stanford Translational Research Integrated Database Environment (N = 150,280; 2007-2017)--we determined that mean body temperature in men and women, after adjusting for age, height, weight and, in some models date and time of day, has decreased monotonically by 0.03°C per birth decade. A similar decline within the Union Army cohort as between cohorts, makes measurement error an unlikely explanation. This substantive and continuing shift in body temperature-a marker for metabolic rate-provides a framework for understanding changes in human health and longevity over 157 years.

Keywords: cohort studies; historical trends; human; human biology; human body temperature; medicine; resting metabolic rate.


Conflict of interest statement

MP, CL, JL, TH, JP No competing interests declared

Figures

Figure 1.
Figure 1.. Body temperature measurements by age as observed in three different time periods: 1860–1940 (UAVCW), 1971–1975 (NHANES 1), and 2007–2017 (STRIDE).
(A) Unadjusted data (local regression) for temperature measurements, showing a decrease in temperature across age in white men, black men, white women, and black women, in the three cohorts. (B) Coefficients and standard errors from multivariate linear regression models for each cohort including age, weight, height, ethnicity group and time of day as available. Yellow cells are statistically significant at a p value of < 0.01, orange cells are of borderline significance (p<0.1 but>0.05), and remaining uncolored cells are not statistically significant. (C) Expected body temperature for 30 year old men and women with weight 70 kg and height 170 cm in each time period/cohort.
Figure 1—figure supplement 1.
Figure 1—figure supplement 1.. Distribution of temperature measures (oF) for each cohort: UAVCW (1860–1940), NHANES I (1971–1975) and STRIDE (2007–2017).
Figure 1—figure supplement 2.
Figure 1—figure supplement 2.. Analysis using BMI adjusted for height.
Coefficients (and standard errors) are from multivariate linear regression models for each cohort including age, height, BMI adjusted for height and time of day (as available). NHANES I includes population weights. *, **, *** indicates significance at the 90%, 95%, and 99% level, respectively.
Figure 1—figure supplement 3.
Figure 1—figure supplement 3.. Model of mean body temperature in black and white ethnicity groups in three different time periods (cohorts): 1860–1940 (UAVCW), 1971–1975 (NHANES 1), and 2007–2017 (STRIDE).
(A) Coefficients (and standard errors) from multivariate linear regression models for each cohort including age, body weight, height and time of day. Separate regression models were fitted for men and women, in black and white ethnicity groups. NHANES I includes population weights. *, **, *** indicates significance at the 90%, 95%, and 99% level, respectively. (B) Expected body temperature (and associated 95% confidence interval) for 30 year old men and women with body weight 70 kg and height 170 cm in each time period/cohort. These values derive from the regression models presented in A.
Figure 1—figure supplement 4.
Figure 1—figure supplement 4.. Model of mean body temperature over time in three cohorts by birth year controlling for the time of the day of the temperature measurement (white men and women).
(A) Graph shows a decrease of predicted body temperature by birth year for both white men (blue line) and white women (red line) based on the linear regression coefficients displayed in B. No data for women were available for the period 1800–1890. For all measurements from UACWV, where time of the day was not available, the values of 12:00 PM (noon) were imputed. (B) Coefficients (and standard errors) from linear regression model including age, weight in kg, height in cm and birth year.
Figure 1—figure supplement 5.
Figure 1—figure supplement 5.. Effect of the month of temperature measurement.
Mixed effect predictions and confidence intervals of the month during which the measurement was taken on the measured temperature. (A) White men in UACWV, (B) white men in NHANES I, (C) white men in STRIDE, (D) white women in NHANES I, and (E) white women in STRIDE.
Figure 1—figure supplement 6.
Figure 1—figure supplement 6.. Analysis using both month and location.
Coefficients (and standard errors) are from a multivariate linear regression model for the UAVCW cohort including age, weight, height, month and state climate classification (cold, moderate-cold, moderate, warm or hot). While UAVCW provided state information, NHANES I provided general region only and STRIDE was in Northern California only. *, **, *** indicates significance at the 90%, 95%, and 99% level, respectively.
Figure 2.
Figure 2.. Temperature trends within birth cohorts of the UAVCW, 1860–1940 (black and white men).
(A) Smoothed unadjusted data (local regression) for temperature measurement trends within birth cohorts. The different colors represent different birth cohorts (green: 1820s, blue: 1830s, orange: 1840s). (B) Coefficients (and standard errors) from multivariate linear regression including age, body weight, height and decade of birth (1820–1840) (these coefficients do not correspond to the graph as here the trajectories are approximated by linear functions). Only the three birth cohorts with more than 8000 members are included. * and ** indicate significance at the 90%, and 99% level, respectively. (C) Expected body temperature (and associated 95% confidence interval) for 30 year old men with body weight 70 kg and height 170 cm in each birth cohort. These values derive from the regression models presented in B.
Figure 3.
Figure 3.. Modeled body temperature over time in three cohorts by birth year (black and white ethnicity groups).
(A) Body temperature decreases by birth year in white and black men and women. No data for women were available for the birth years from 1800 to 1890. (B) Coefficients (and standard errors) used for the graph from multivariate linear regression including age, body weight, height and birth year. All cells are significant at greater than 99% significance level.

Comment in

Similar articles

Cited by

References

    1. Adhi M, Hasan R, Noman F, Mahmood SF, Naqvi A, Rizvi AU. Range for normal body temperature in the general population of Pakistan. Journal of the Pakistan Medical Association. 2008;58:580–584. - PubMed
    1. Capilouto ML, Douglass CW. Trends in the prevalence and severity of periodontal diseases in the US: a public health problem? Journal of Public Health Dentistry. 1988;48:245–251. doi: 10.1111/j.1752-7325.1988.tb03206.x. - DOI - PubMed
    1. Centers for Disease Control, National Center for Health Statistics . National Health and Nutrition Examination Survey Data, 1971-1974. US Department of Health and Human Services, Centers for Disease Control and Prevention; 1975.
    1. Costa DL. Union army data: early indicators of later work levels, disease and death. [February 23, 2018];2019 http://uadata.org/cite/
    1. Du Bois EF. Basal Metabolism in Health and Disease. Lea & Febiger; 1936.

Publication types