. 2019 Dec 26:10:e00120.
doi: 10.1016/j.mec.2019.e00120. eCollection 2020 Jun.

Evaluation of freely available software tools for untargeted quantification of 13C isotopic enrichment in cellular metabolome from HR-LC/MS data

Affiliations

Evaluation of freely available software tools for untargeted quantification of 13C isotopic enrichment in cellular metabolome from HR-LC/MS data

Manohar C Dange et al. Metab Eng Commun. .

Erratum in

Abstract

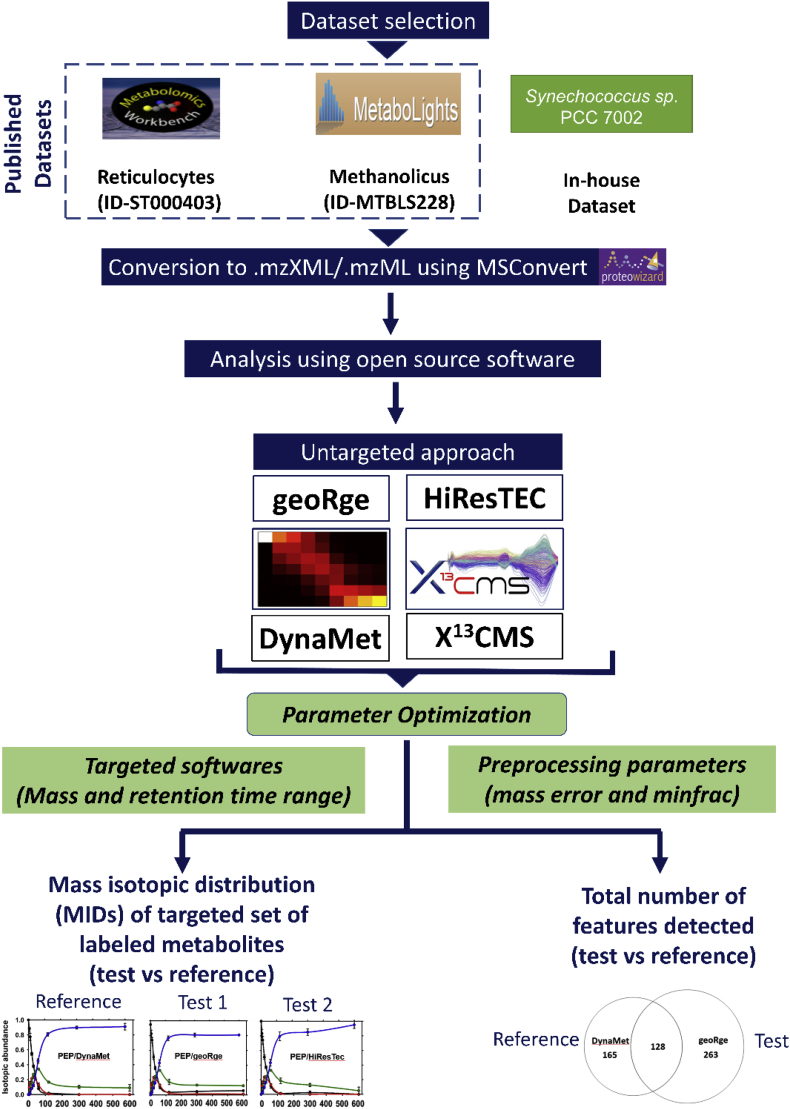
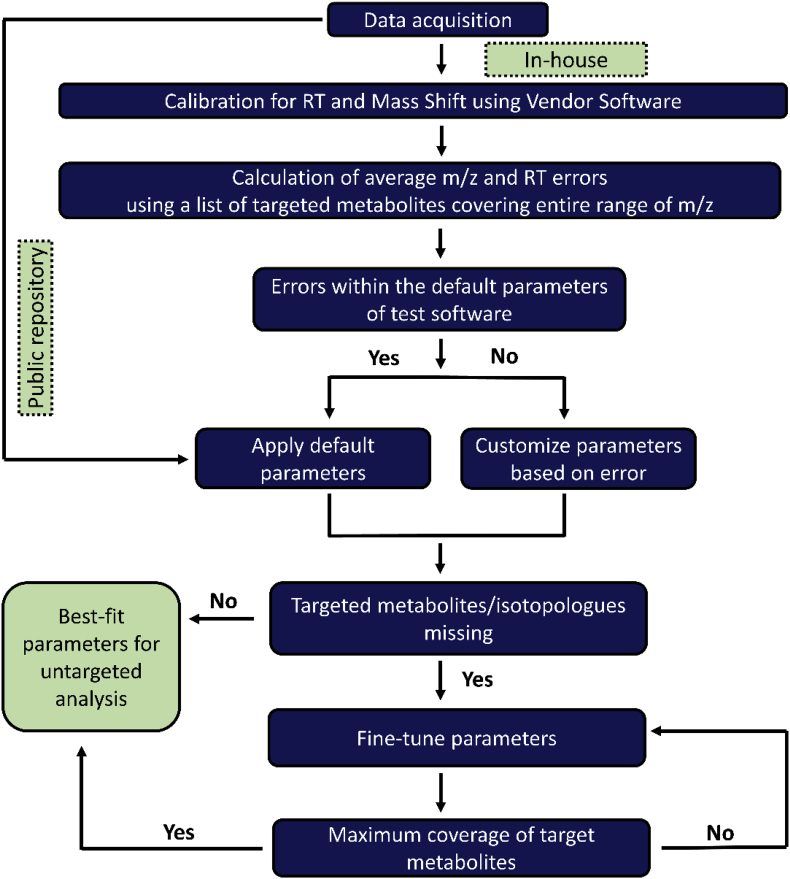
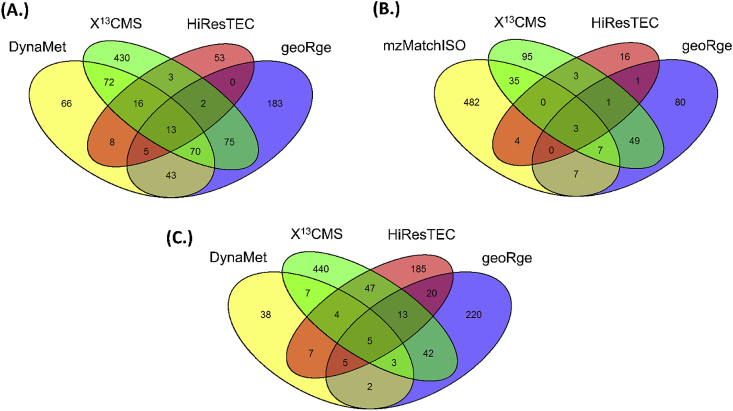
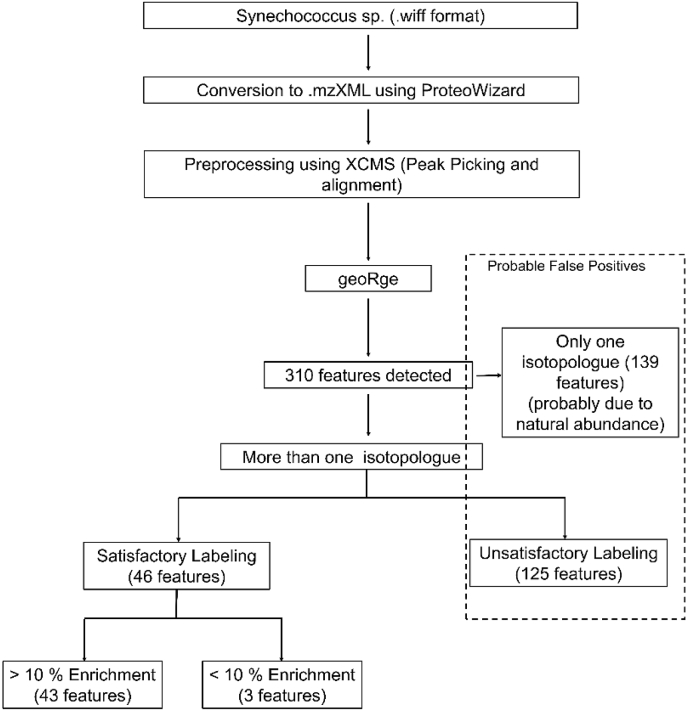
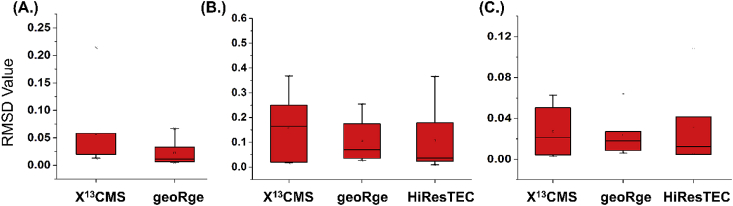
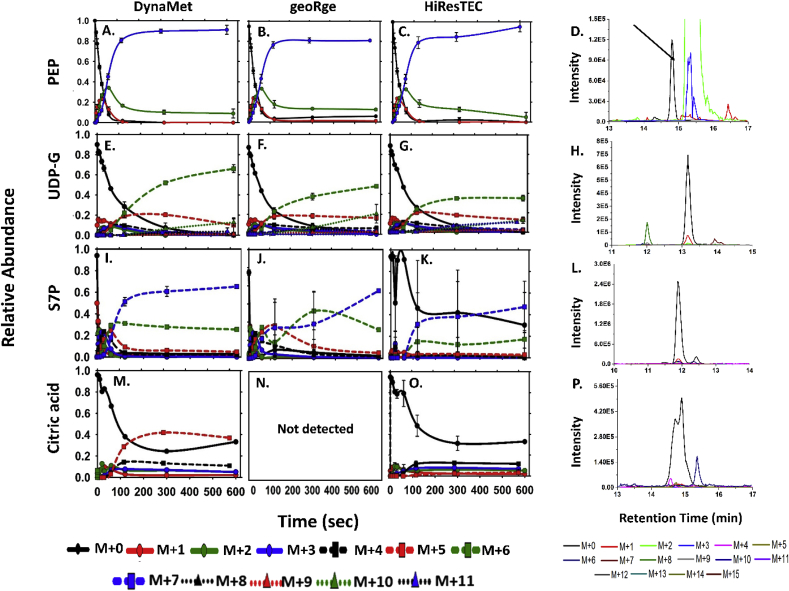
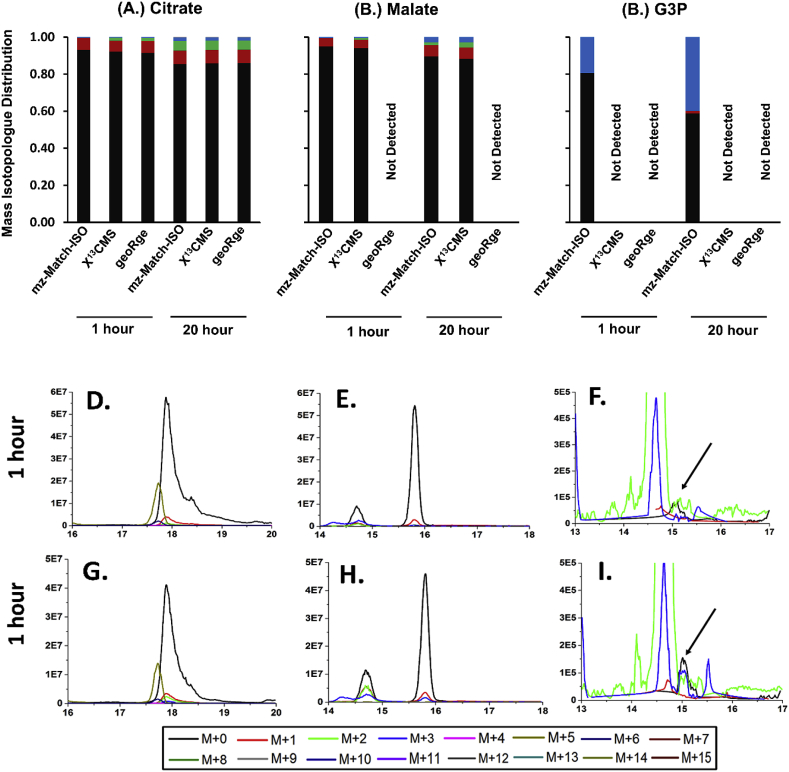
13C Metabolic Flux Analysis (13C-MFA) involves the quantification of isotopic enrichment in cellular metabolites and fitting the resultant data to the metabolic network model of the organism. Coverage and resolution of the resultant flux map depends on the total number of metabolites and fragments in which 13C enrichment can be quantified accurately. Experimental techniques for tracking 13C enrichment are evolving rapidly and large volumes of data are now routinely generated through the use of Liquid Chromatography coupled with High-Resolution Mass Spectrometry (HR-LC/MS). Therefore, the current manuscript is focused on the challenges in high-throughput analyses of such large datasets. Current 13C-MFA studies often have to rely on the targeted quantification of a small subset of metabolites, thereby leaving a large fraction of the data unexplored. A number of public domain software tools have been reported in recent years for the untargeted quantitation of isotopic enrichment. However, the suitability of their application across diverse datasets has not been investigated. Here, we test the software tools X13CMS, DynaMet, geoRge, and HiResTEC with three diverse datasets. The tools provided a global, untargeted view of 13C enrichment in metabolites in all three datasets and a much-needed automation in data analysis. Some inconsistencies were observed in results obtained from the different tools, which could be partially ascribed to the lack of baseline separation and potential mass conflicts. After removing the false positives manually, isotopic enrichment could be quantified reliably in a large repertoire of metabolites. Of the software tools explored, geoRge and HiResTEC consistently performed well for the untargeted analysis of all datasets tested.

Keywords: 13C metabolic flux analysis; Cyanobacteria; Methanolicus; Reticulocytes; Synechococcus sp. PCC 7002; Untargeted analysis.


Figures

Image 1
Graphical abstract
Fig. 1
Fig. 1
Workflow used in this study. Three datasets were selected, two published (‘Methanolicus’ and ‘Reticulocytes’) and one generated in-house (Synechococcus sp.). Software tools DynaMet, X13CMS, geoRge and HiResTEC were used for untargeted MID analysis of the 3 datasets and the total features detected were compared between them. A targeted MID analysis was also carried out with all three datasets, using benchmarked metabolites obtained with the ‘reference’ software (DynaMet for the Methanolicus dataset and mzMatch-ISO for the Reticulocyte dataset) and subjected to reanalysis by one or more ‘test’ software. In case of the in-house dataset, the vendor provided software tool MultiQuantTM was considered the ‘reference’.
Fig. 2
Fig. 2
Flow chart representing the strategy used for optimizing parameters for the datasets used.
Fig. 3
Fig. 3
Comparison of the total number of features detected in an untargeted analysis of a given dataset by different software tools. Venn diagrams for (A) Methanolicus data, (B) Reticulocytes data and (C) Synechococcus sp. data.
Fig. 4
Fig. 4
Workflow for the untargeted analysis of the Synechococcus sp. dataset using geoRge. False positives were removed on the basis of number of isotopologues detected for each feature and their respective labeling patterns. Satisfactory labeling refers to a gradual progression in the 13C enrichment while unsatisfactory labeling refers to unexpected progressions in 13C enrichment, conflicts in masses, and more than expected number of isotopologues.
Fig. 5
Fig. 5
Comparison of quantitated MIDs for benchmarked metabolites between different test software using Root Mean Square Deviation (RMSD). A.) The RMSD values for quantitated MIDs of benchmarked metabolites was calculated for ‘Reticulocytes’ dataset using the test software X13CMS and geoRge and MIDs obtained from mzMatch-ISO were considered as the reference. B.) The RMSD values for MIDs quantitated using test software X13CMS, geoRge and HiResTEC for ‘Methanolicus’ dataset in comparison to DynaMet as reference C.) The RMSD values for MIDs quantitated using X13CMS, geoRge, and HiResTEC for the Synechococcus sp. dataset in comparison to MultiQuant (reference).
Fig. 6
Fig. 6
Comparison of the dynamic labeling patterns of selected metabolites 3-PGA, Tyrosine, S7P and Aspartate for the Synechococcus sp. dataset. These metabolites were identified and their MIDs quantitated using MultiQuant. The raw data was re-analysed using geoRge and HiResTEC. The XICs of all the relevant isotopologues of the metabolite for the t ​= ​0 ​min timepoint (the unlabeled sample), are shown to assess the peak quality and potential conflicts with isotopologues.
Fig. 7
Fig. 7
Comparison of the experimentally measured MIDs of PEP, UDP-G, S7P and citric acid which were obtained through the targeted analysis of the ‘Methanolicus’ dataset. The data for DynaMet has been taken from (Kiefer et al., 2015) and treated as reference software. The raw data was reanalyzed using geoRge and HiResTEC. The XICs of all the relevant isotopologues of the metabolite for the t ​= ​0 ​min timepoint (the unlabeled sample), are shown to assess the peak quality and potential conflicts with isotopologues. The arrow indicates the peak for PEP.
Fig. 8
Fig. 8
Comparison of the dynamic labeling patterns of Citrate, Malate and G3P which were obtained through the targeted analysis of the ‘reticulocytes’ dataset. The data for mzMatch-ISO has been taken from (Srivastava et al., 2017) and treated as reference software. The raw data was re-analysed using X13CMS and geoRge. The XICs of all the relevant isotopologues of the metabolites for two timepoints, t ​= ​0 ​h (unlabeled sample) and t ​= ​20 ​h (fully labeled sample), are both shown to assess the peak quality and potential conflicts with isotopologues. The arrow points to the peak for G3P.

References

    1. Alagesan S., Gaudana S.B., Sinha A., Wangikar P.P. Metabolic flux analysis of Cyanothece sp. ATCC 51142 under mixotrophic conditions. Photosynth. Res. 2013;118:191–198. - PubMed
    1. Bueschl C., Kluger B., Neumann N.K.N., Doppler M., Maschietto V., Thallinger G.G., Meng-Reiterer J., Krska R., Schuhmacher R. MetExtract II: a software suite for stable isotope-assisted untargeted metabolomics. Anal. Chem. 2017;89:9518–9526. - PMC - PubMed
    1. Capellades J., Navarro M., Samino S., Garcia-Ramirez M., Hernandez C., Simo R., Vinaixa M., Yanes O. GeoRge: a computational tool to detect the presence of stable isotope labeling in LC/MS-based untargeted metabolomics. Anal. Chem. 2016;88:621–628. - PubMed
    1. Choi J., Antoniewicz M.R. Tandem mass spectrometry: a novel approach for metabolic flux analysis. Metab. Eng. 2011;13:225–233. - PubMed
    1. Choi J., Antoniewicz M.R. Tandem mass spectrometry for 13 C metabolic flux analysis: methods and algorithms based on EMU framework. Front. Microbiol. 2019;10:1–8. - PMC - PubMed

LinkOut - more resources