

Micro-dystrophin Gene Therapy Partially Enhances Exercise Capacity in Older Adult mdx Mice
- PMID: 31909085
- PMCID: PMC6939027
- DOI: 10.1016/j.omtm.2019.11.015
Micro-dystrophin Gene Therapy Partially Enhances Exercise Capacity in Older Adult mdx Mice
Abstract
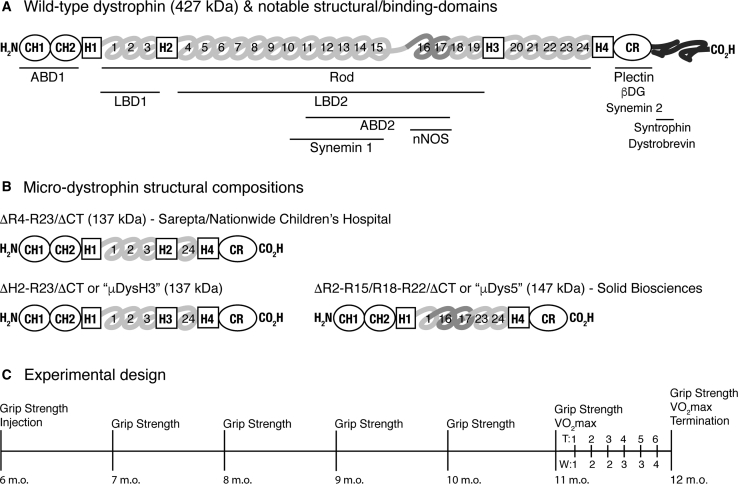
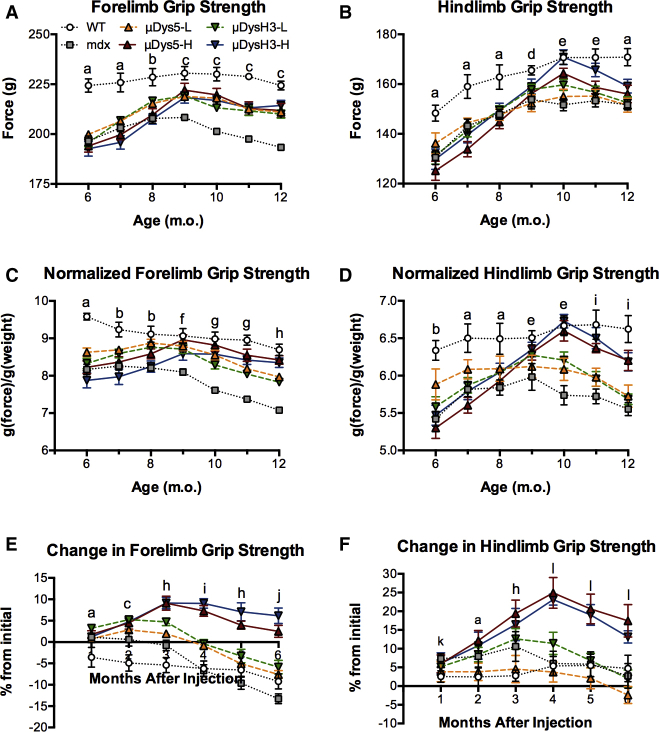
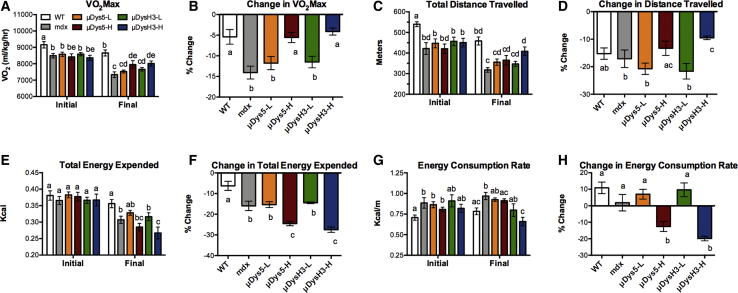
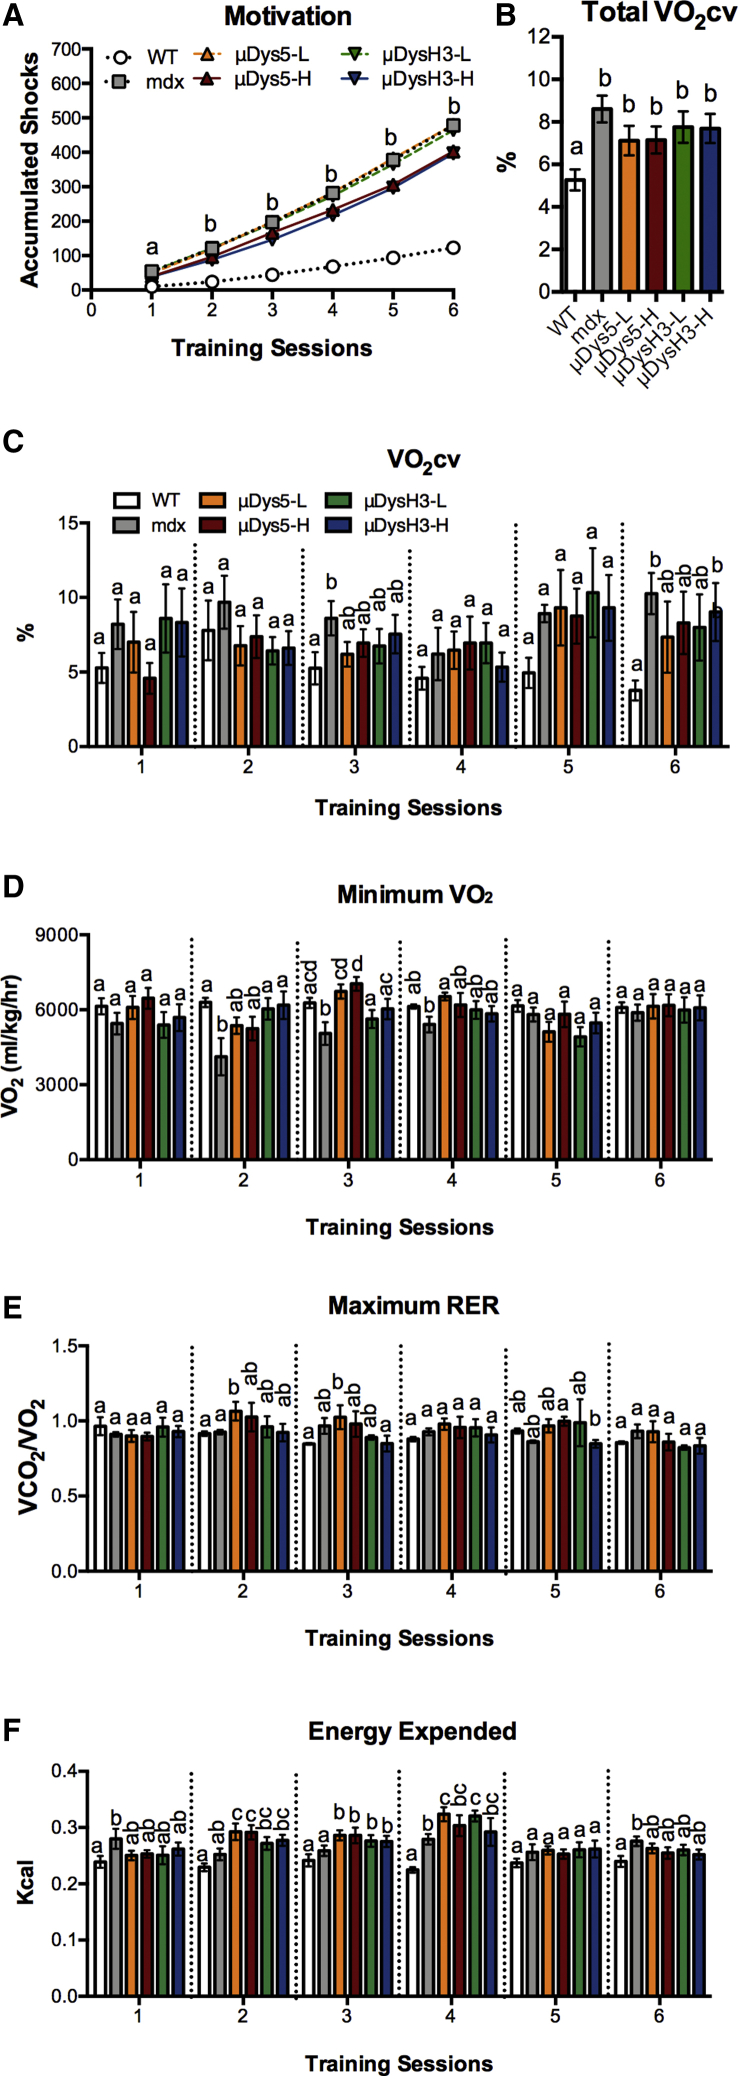
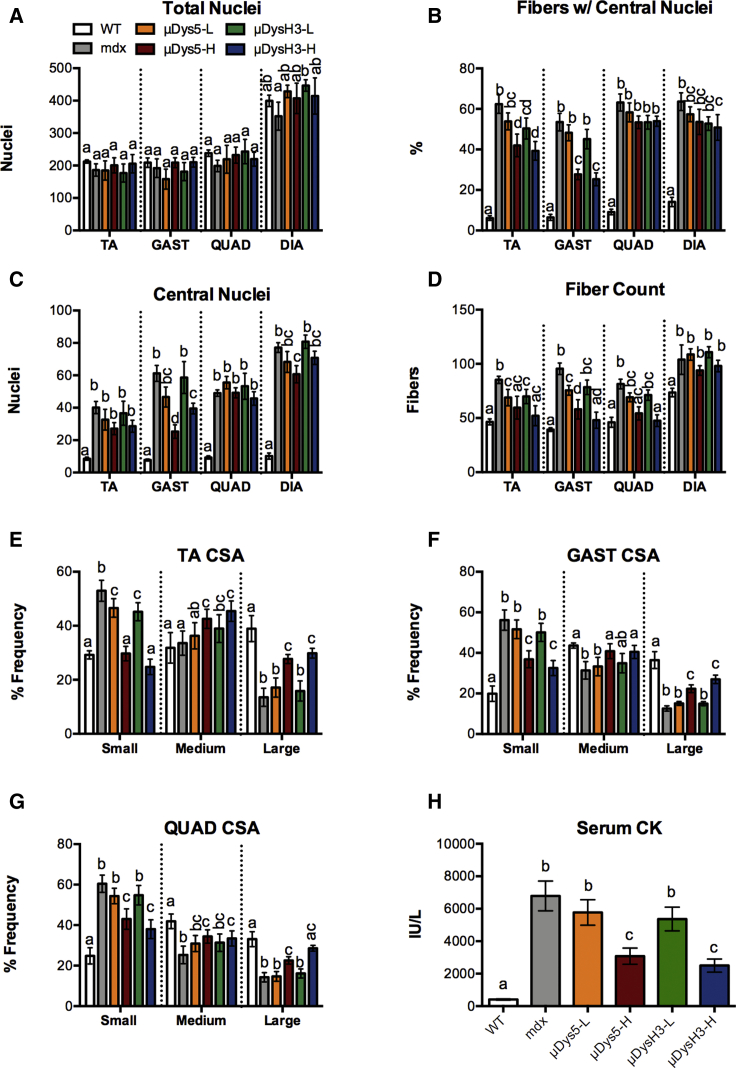
Micro-dystrophin (μDys) gene therapeutics can improve striated muscle structure and function in different animal models of Duchenne muscular dystrophy. Most studies, however, used young mdx mice that lack a pronounced dystrophic phenotype, short treatment periods, and limited muscle function tests. We, therefore, determined the relative efficacy of two previously described μDys gene therapeutics (rAAV6:μDysH3 and rAAV6:μDys5) in 6-month-old mdx mice using a 6-month treatment regimen and forced exercise. Forelimb and hindlimb grip strength, metabolic rate (VO2 max), running efficiency (energy expenditure), and serum creatine kinase levels similarly improved in mdx mice treated with either vector. Both vectors produced nearly identical dose-responses in all assays. They also partially prevented the degenerative effects of repeated high-intensity exercise on muscle histology, although none of the metrics examined was restored to normal wild-type levels. Moreover, neither vector had any consistent effect on respiration while exercising. These data together suggest that, although μDys gene therapy can improve isolated and systemic muscle function, it may be only partially effective when dystrophinopathies are advanced or when muscle structure is significantly challenged, as with high-intensity exercise. This further suggests that restoring muscle function to near-normal levels will likely require ancillary or combinatorial treatments capable of enhancing muscle strength.
Keywords: Duchenne muscular dystrophy; exercise; gene therapy; mdx; microdystrophin.
© 2019 The Authors.
Figures
Similar articles
-
Lifelong Outcomes of Systemic Adeno-Associated Virus Micro-Dystrophin Gene Therapy in a Murine Duchenne Muscular Dystrophy Model.Hum Gene Ther. 2023 May;34(9-10):449-458. doi: 10.1089/hum.2022.181. Epub 2023 May 2. Hum Gene Ther. 2023. PMID: 36515166 Free PMC article.
-
Phenotypic improvement of dystrophic muscles by rAAV/microdystrophin vectors is augmented by Igf1 codelivery.Mol Ther. 2005 Sep;12(3):441-50. doi: 10.1016/j.ymthe.2005.04.001. Mol Ther. 2005. PMID: 16099410
-
The Implication of Hinge 1 and Hinge 4 in Micro-Dystrophin Gene Therapy for Duchenne Muscular Dystrophy.Hum Gene Ther. 2023 May;34(9-10):459-470. doi: 10.1089/hum.2022.180. Epub 2023 Apr 6. Hum Gene Ther. 2023. PMID: 36310439 Free PMC article.
-
[Gene therapy for muscular dystrophy].No To Hattatsu. 2004 Mar;36(2):117-23. No To Hattatsu. 2004. PMID: 15031985 Review. Japanese.
-
[Current status and perspective of gene therapy on dystrophic animal model].Rinsho Shinkeigaku. 2004 Nov;44(11):911-3. Rinsho Shinkeigaku. 2004. PMID: 15651329 Review. Japanese.
Cited by
-
Prolonged voluntary wheel running reveals unique adaptations in mdx mice treated with microdystrophin constructs ± the nNOS-binding site.Front Physiol. 2023 Jun 26;14:1166206. doi: 10.3389/fphys.2023.1166206. eCollection 2023. Front Physiol. 2023. PMID: 37435312 Free PMC article.
-
Evaluation of an AAV9-mini-dystrophin gene therapy candidate in a rat model of Duchenne muscular dystrophy.Mol Ther Methods Clin Dev. 2023 May 18;30:30-47. doi: 10.1016/j.omtm.2023.05.017. eCollection 2023 Sep 14. Mol Ther Methods Clin Dev. 2023. PMID: 37746247 Free PMC article.
-
Striking Cardioprotective Effects of an Adiponectin Receptor Agonist in an Aged Mouse Model of Duchenne Muscular Dystrophy.Antioxidants (Basel). 2024 Dec 18;13(12):1551. doi: 10.3390/antiox13121551. Antioxidants (Basel). 2024. PMID: 39765879 Free PMC article.
-
The new challenge of "exercise + X″ therapy for Duchenne muscular dystrophy-Individualized identification of exercise tolerance and precise implementation of exercise intervention.Front Physiol. 2022 Aug 5;13:947749. doi: 10.3389/fphys.2022.947749. eCollection 2022. Front Physiol. 2022. PMID: 35991169 Free PMC article. Review.
-
Therapeutic Strategies for Duchenne Muscular Dystrophy: An Update.Genes (Basel). 2020 Jul 23;11(8):837. doi: 10.3390/genes11080837. Genes (Basel). 2020. PMID: 32717791 Free PMC article. Review.
References
-
- Michele D.E., Campbell K.P. Dystrophin-glycoprotein complex: post-translational processing and dystroglycan function. J. Biol. Chem. 2003;278:15457–15460. - PubMed
-
- Wheeler M.T., Allikian M.J., Heydemann A., McNally E.M. The sarcoglycan complex in striated and vascular smooth muscle. Cold Spring Harb. Symp. Quant. Biol. 2002;67:389–397. - PubMed
-
- Roberts R.G., Gardner R.J., Bobrow M. Searching for the 1 in 2,400,000: a review of dystrophin gene point mutations. Hum. Mutat. 1994;4:1–11. - PubMed
Grants and funding
LinkOut - more resources
Full Text Sources
