

Classification of traffic accidents datasets between 2003-2017 in Iraq
- PMID: 31909097
- PMCID: PMC6940704
- DOI: 10.1016/j.dib.2019.104902
Classification of traffic accidents datasets between 2003-2017 in Iraq
Abstract
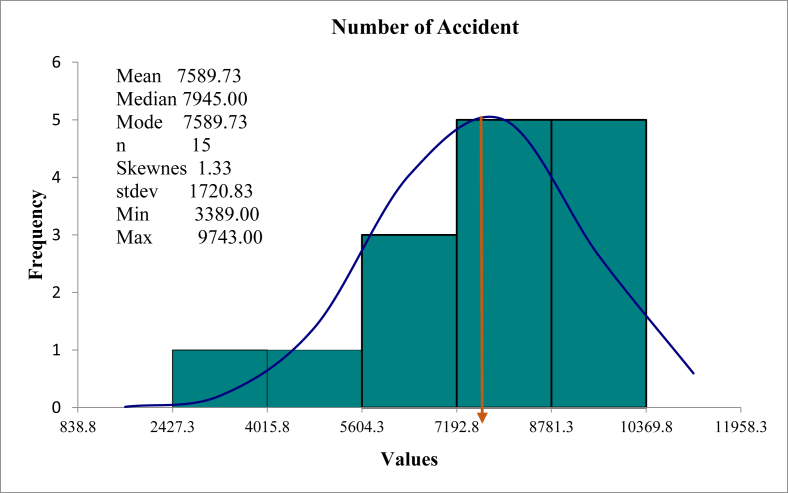
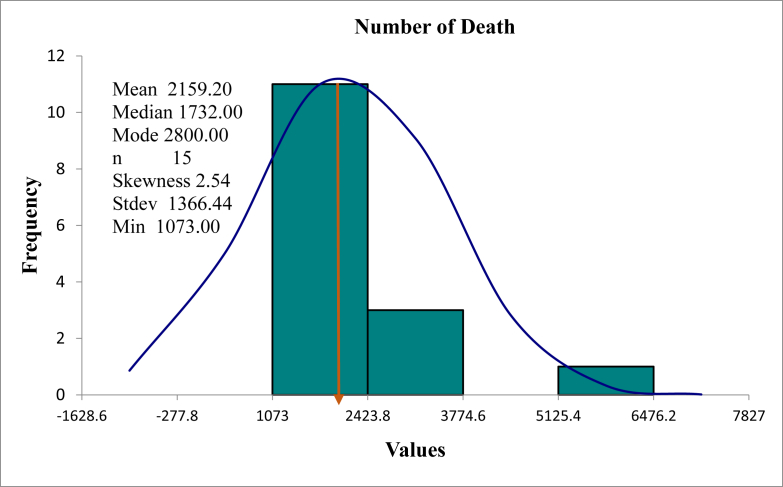
After the epidemic disease and the violence, the traffic injuries in Iraq has become a massive threat that menace the lives of the citizens and plagued the number of victims in Iraq after 2003. Iraq is seeing a catastrophic growth in the number of the traffic injuries reaching a high level during the previous ten years. Datasets results for the previous 10 years in Iraq were collected in this study. The data was arranged into spreadsheets creating a useful database for the prospectus studies. Classification of the traffic injuries was performed according to the number of fatalities, the number of injuries, and the number of accidents. Overall, traffic accidents were drastically growing from 2005 to 2017. In additional, the number of accidents recorded a relatively higher rate of accidents in a month with about 9%. However, the highest rates were observed during 2014, 2015, 2016 and 2017 consecutively. It may be attributed to the absence of security and safety precautions procedures. The number of injuries was as high was 12% and it increased during 2014, 2015, 2016 and 2017 respectively. whereas the number of fatalities recorded the highest number during 2017 with a ratio about 21%.
Keywords: Number of accidents; Number of fatalities; Number of injuries; Traffic accidents.
© 2019 Published by Elsevier Inc.
Figures


References
-
- D. Oña J., López G., Abellán J. Extracting decision rules from police accident reports through decision trees. Accid. Anal. Prev. 2013;50:1151–1160. - PubMed
-
- Abellán J., Ona D., López J. Analysis of traffic accident severity using decision rules via decision trees. Expert Syst. Appl. 2013;40:6047–6054.
-
- Mohammed Ali Ahmed, Ambak Kamarudin Bin, Mosa Ahmed Mancy, Syamsunur Deprizon. A review of the traffic accidents and related practices worldwide. Open Transp. J. 2019:1874. 4478/19.
-
- Ahmed A., Ambak K., Mancy A., Syamsunur D. Traffic accidents in Iraq: an analytical study. J. Adv. Civ. Environ. Eng. 2018;5:10–22.
-
- Yamamoto T., Hashiji J., Shankar V. Underreporting in traffic accident data, bias in parameters and the structure of injury severity models. Accid. Anal. Prev. 2008;40:1320–1329. - PubMed
LinkOut - more resources
Full Text Sources
