. 2019 Dec 31;6(1):e03067.
doi: 10.1016/j.heliyon.2019.e03067. eCollection 2020 Jan.

Profiling of lincRNAs in human pluripotent stem cell derived forebrain neural progenitor cells

Affiliations

Profiling of lincRNAs in human pluripotent stem cell derived forebrain neural progenitor cells

Daniela A Grassi et al. Heliyon. .

Abstract

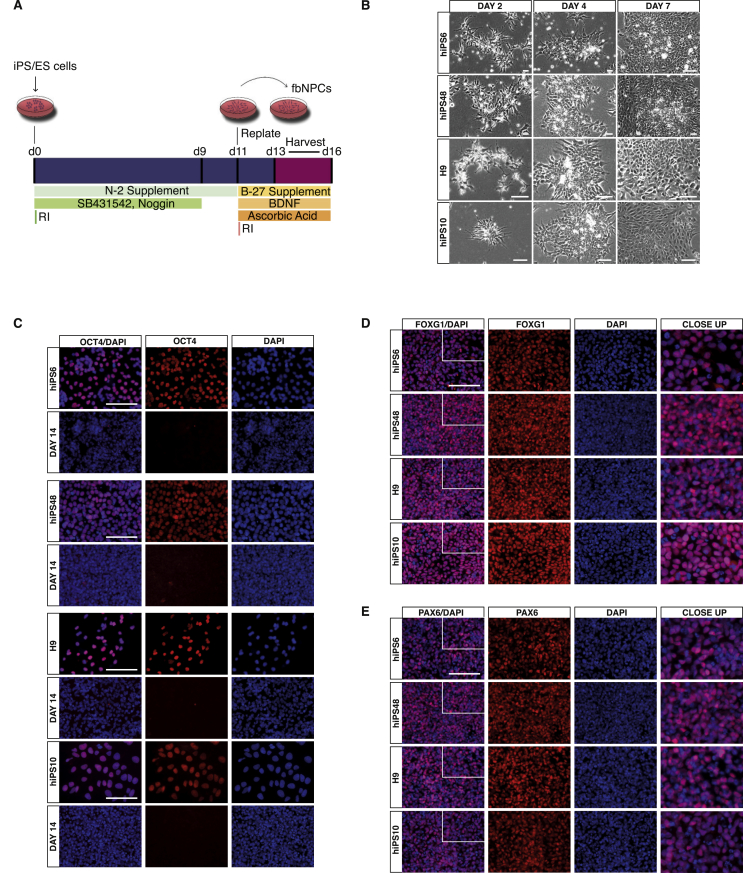
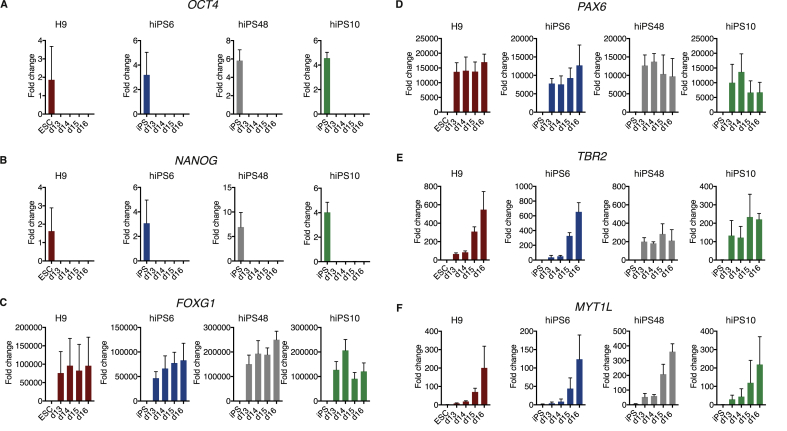
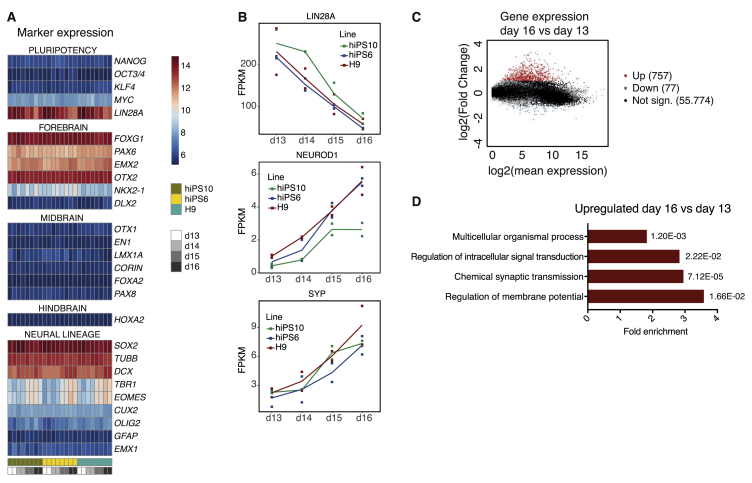
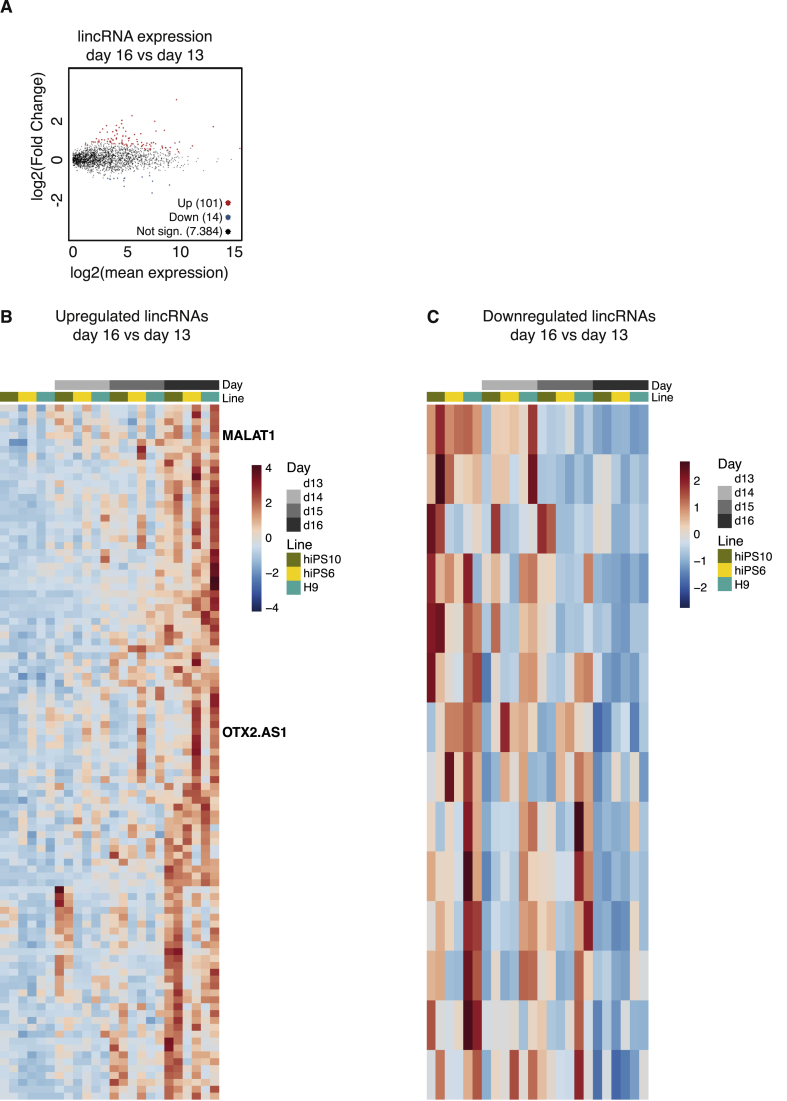
Human embryonic stem cells (hESCs) and induced pluripotent stem cells (iPSCs) can be differentiated into many different cell types of the central nervous system. One challenge when using pluripotent stem cells is to develop robust and efficient differentiation protocols that result in homogenous cultures of the desired cell type. Here, we have utilized the SMAD-inhibitors SB431542 and Noggin in a fully defined monolayer culture model to differentiate human pluripotent cells into homogenous forebrain neural progenitors. Temporal fate analysis revealed that this protocol results in forebrain-patterned neural progenitor cells that start to express early neuronal markers after two weeks of differentiation, allowing for the analysis of gene expression changes during neurogenesis. Using this system, we were able to identify many previously uncharacterized long intergenic non-coding RNAs that display dynamic expression during human forebrain neurogenesis.

Keywords: Cell biology; Cellular neuroscience; Developmental genetics; Differentiation; Forebrain development; Genetics; Induced pluripotent stem cells; Neural progenitor cells; Neuroscience; lincRNAs.


Figures

Figure 1
Figure 1
Differentiation overview and characterization of fbNPCs at day 14 by immunocytochemistry. (A) Overview of the differentiation procedure. (B) Brightfield images of the four cell lines used in this study show a similar morphology at day 2, 4, and 7 of differentiation. (C) Immunocytochemical labeling of OCT4 in undifferentiated cells and at day 14 of differentiation. (D) Immunocytochemistry of the forebrain marker FOXG1 at day 14 of differentiation. (E) Immunocytochemistry of the forebrain marker PAX6 at day 14 of differentiation. Nuclei are counterstained with DAPI, shown in blue. Scale bar represents 100 μm.
Figure 2
Figure 2
Characterization of fbNPCs by qRT-PCR at day 13 to 16 of differentiation. qRT-PCR data from undifferentiated cells and at day 13–16 of differentiation. The data represents the fold changes in relation to one of the H9 hESC samples for each gene. (A) OCT4. (B) NANOG. (C) FOXG1. (D) PAX6. (E) TBR2. (F) MYT1L. The bars and error bars represent mean with SD of three differentiation replicates.
Figure 3
Figure 3
Temporal transcriptome changes from day 13 to day 16. RNA-seq data of H9, hiPS6 and hiPS10 fbNPCs at day 13, 14, 15, and 16 of differentiation. (A) Heatmap displaying the marker expression profile between day 13 and day 16, two differentiation replicates per time-point. (B) Expression of LIN28A, NEUROD1, and SYP transcripts plotted as fragments per kilobase of transcript per million mapped reads (FPKM), the line represents average values for each time-point and the squares represent each differentiation replicate. (C) MA plot displaying significantly upregulated (p-adj. < 0.0001 & log2(FC) > 1) genes in day 16 compared to day 13 plotted in red, significantly downregulated (p-adj. < 0.0001 & log2(FC) < -1) genes in blue and non-significant genes in black. (D) Gene ontology analysis of upregulated genes (as shown in C) showing the fold enrichment and p-values for each parent term.
Figure 4
Figure 4
Expression of lincRNAs changes upon differentiation. (A) MA plot illustrating the log2 fold changes of lincRNAs between day 16 and day 13 fbNPCs, upregulated lincRNAs shown in red and downregulated in blue (p-adj < 0.001). (B) Heatmap of upregulated lincRNAs (p-adj < 0.001). (C) Heatmap of downregulated lincRNAs (p-adj < 0.001).

References

    1. Aprea J., Calegari F. Long non-coding RNAs in corticogenesis: deciphering the non-coding code of the brain. EMBO J. 2015;34:2865–2884. - PMC - PubMed
    1. Branco P.R., de Araujo G.S., Barrera J., Suarez-Kurtz G., de Souza S.J. Uncovering association networks through an eQTL analysis involving human miRNAs and lincRNAs. Sci. Rep. 2018;8:15050. - PMC - PubMed
    1. Campbell K. Dorsal-ventral patterning in the mammalian telencephalon. Curr. Opin. Neurobiol. 2003;13:50–56. - PubMed
    1. Chambers S.M., Fasano C.A., Papapetrou E.P., Tomishima M., Sadelain M., Studer L. Highly efficient neural conversion of human ES and iPS cells by dual inhibition of SMAD signaling. Nat. Biotechnol. 2009;27:275–280. - PMC - PubMed
    1. Dobin A., Davis C.A., Schlesinger F., Drenkow J., Zaleski C., Jha S., Batut P., Chaisson M., Gingeras T.R. STAR: ultrafast universal RNA-seq aligner. Bioinformatics. 2013;29:15–21. - PMC - PubMed