. 2019 Nov 27;4(8):940-958.
doi: 10.1016/j.jacbts.2019.07.004. eCollection 2019 Dec.

CFTR Therapeutics Normalize Cerebral Perfusion Deficits in Mouse Models of Heart Failure and Subarachnoid Hemorrhage

Affiliations

CFTR Therapeutics Normalize Cerebral Perfusion Deficits in Mouse Models of Heart Failure and Subarachnoid Hemorrhage

Darcy Lidington et al. JACC Basic Transl Sci. .

Abstract

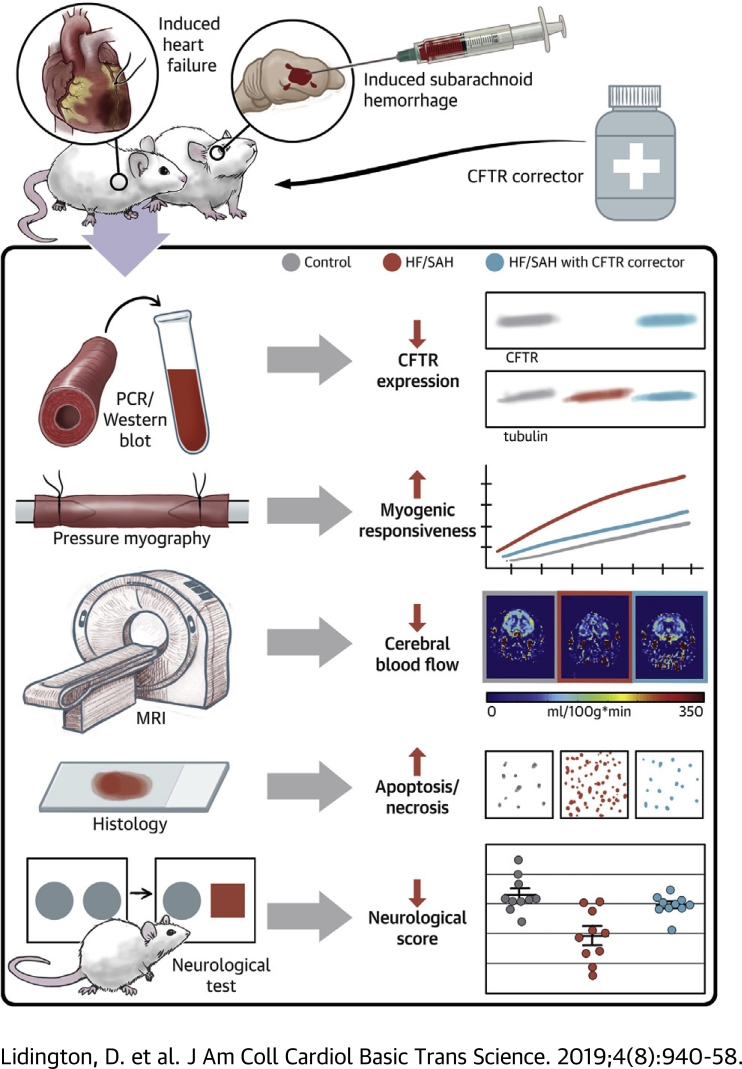
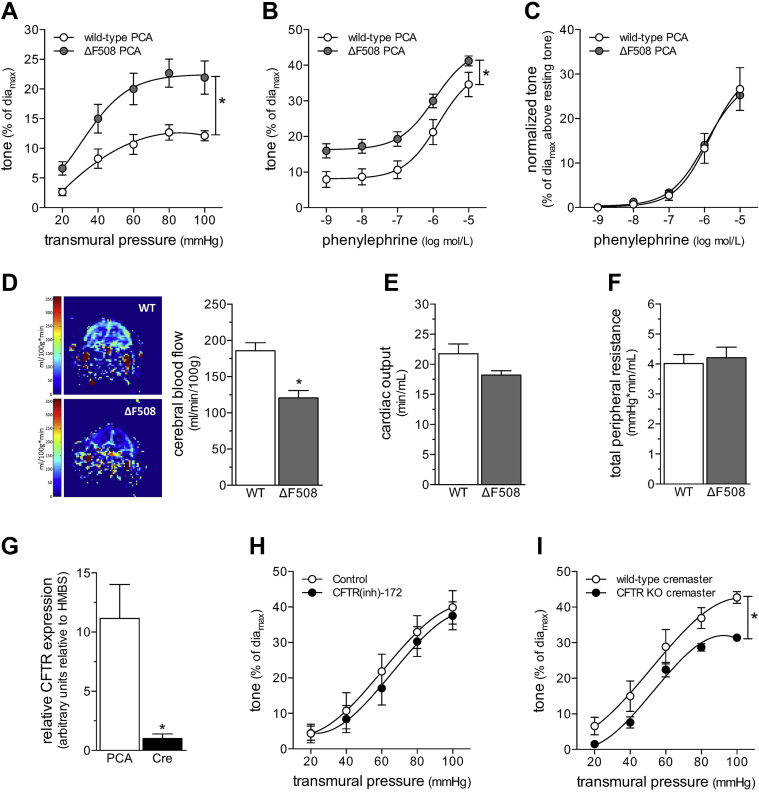
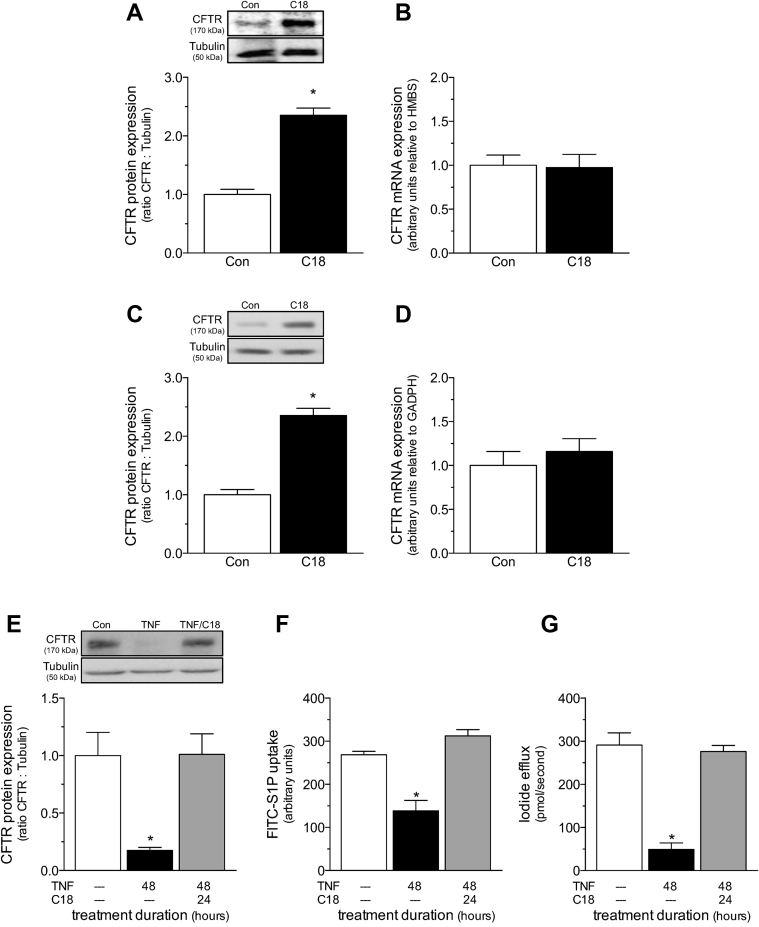
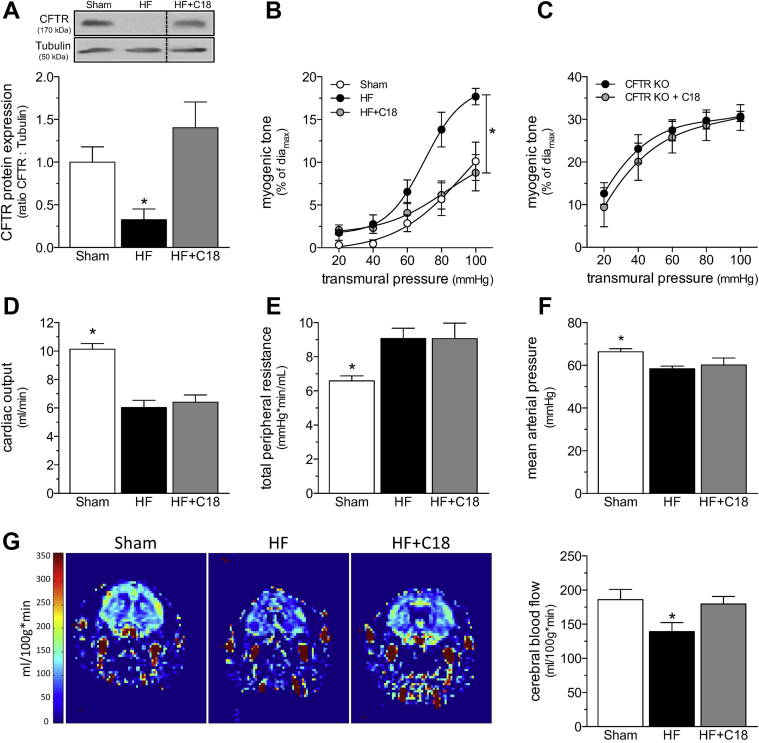
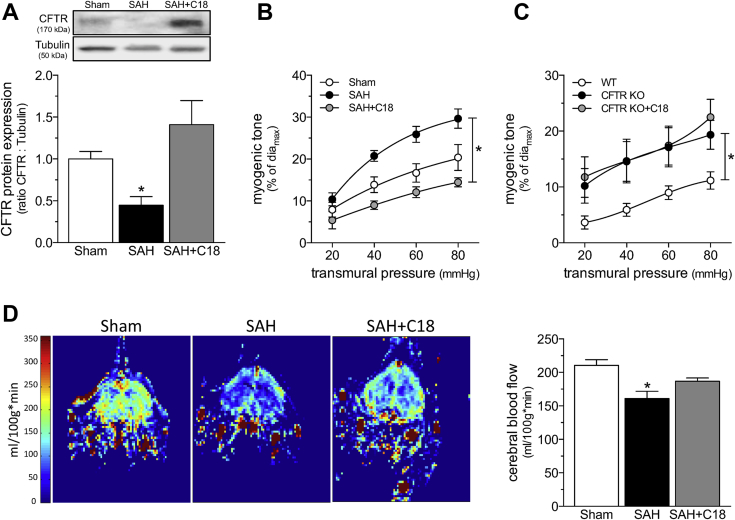
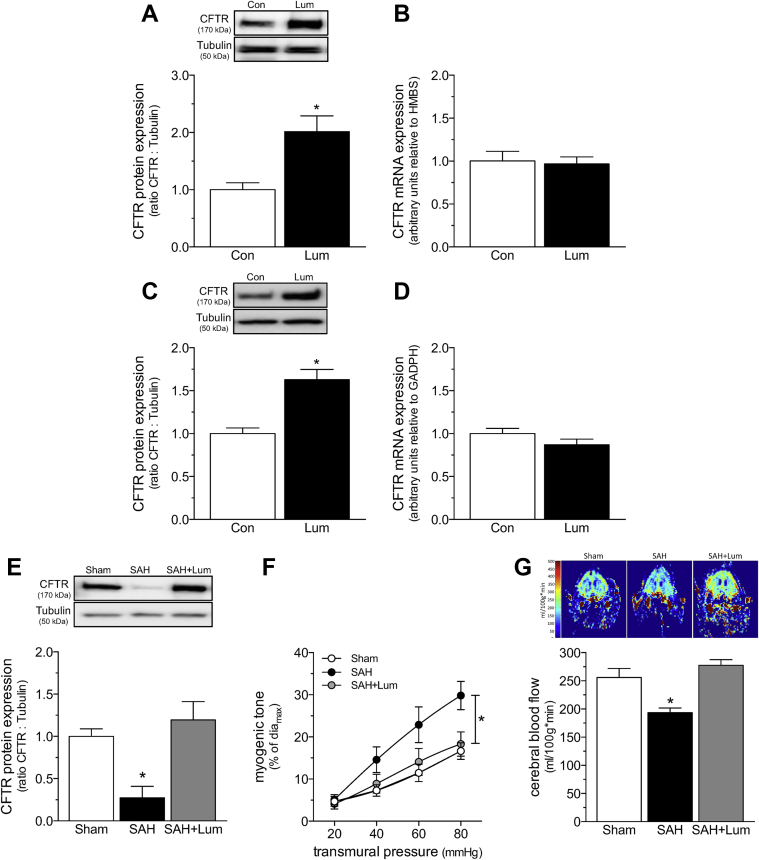
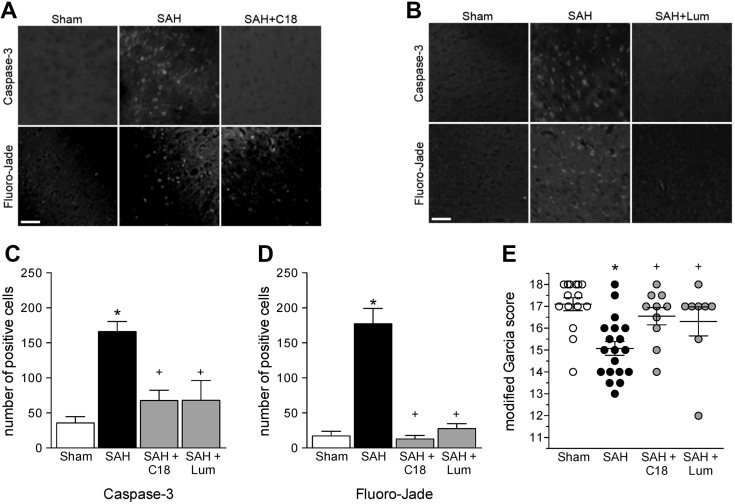
Heart failure (HF) and subarachnoid hemorrhage (SAH) chronically reduce cerebral perfusion, which negatively affects clinical outcome. This work demonstrates a strong relationship between cerebral artery cystic fibrosis transmembrane conductance regulator (CFTR) expression and altered cerebrovascular reactivity in HF and SAH. In HF and SAH, CFTR corrector compounds (C18 or lumacaftor) normalize pathological alterations in cerebral artery CFTR expression, vascular reactivity, and cerebral perfusion, without affecting systemic hemodynamic parameters. This normalization correlates with reduced neuronal injury. Therefore, CFTR therapeutics have emerged as valuable clinical tools to manage cerebrovascular dysfunction, impaired cerebral perfusion, and neuronal injury.

Keywords: CBF, cerebral blood flow; CFTR, cystic fibrosis transmembrane conductance regulator; HF, heart failure; MAP, mean arterial pressure; MOPS, 3-morpholinopropanesulfonic acid; MRI, magnetic resonance imaging; NIH, National Institutes of Health; PCA, posterior cerebral artery; S1P, sphingosine-1-phosphate; SAH, subarachnoid hemorrhage; TNF, tumor necrosis factor; TPR, total peripheral resistance; cognitive impairment; corrector compounds; cystic fibrosis transmembrane conductance regulator (CFTR); myogenic vasoconstriction; sphingosine-1-phosphate; tumor necrosis factor; vascular smooth muscle cells.


Figures

None
Graphical abstract
Figure 1
Figure 1
CBF Is Reduced in CFTRΔF508 Mice (A) Myogenic vasoconstriction is stronger in posterior cerebral arteries (PCAs) isolated from cystic fibrosis transmembrane conductance regulator (CFTR) ΔF508 mutant mice, relative to wild-type (WT) littermate control mice. (B) PCAs isolated from CFTRΔF508 mice display an upward shift in their phenylephrine dose−response relationship. (C) However, once the phenylephrine responses are normalized to basal tone (toneactive − tonerest, where toneactive is the tone at given phenylephrine concentration and tonerest is the tone immediately before stimulation), the WT and CFTRΔF508 phenylephrine dose−response relationships are virtually identical. Mean maximal vessel diameters at 45 mm Hg (diamax) are: CFTRΔF508: 186 ± 2 μm; n = 6 from 4 mice, and WT: 169 ± 8 μm; n = 5 from 3 mice (t-test: p = NS for diamax). (D) Magnetic resonance imaging was used to measure cerebral blood flow in predefined forebrain cortical regions. Representative perfusion maps from WT and CFTRΔF508 mouse forebrains are shown. Cerebral blood flow (CBF) is significantly lower in CFTRΔF508 mice (n = 10), relative to WT littermates (n = 11); however, neither (E) cardiac output (n = 5 for both groups) nor (F) total peripheral resistance (n = 5 for both groups) differed between the 2 genotypes. (G) In WT mice, CFTR mRNA expression is significantly higher in PCAs (n = 5), relative to cremaster skeletal muscle arteries (Cre) (n = 6). (H) Cre myogenic tone is not altered by CFTR inhibition in vitro (100 nmol/l CFTR(inh)-172 for 30 min). (I) However, CFTR gene deletion (CFTR KO) induces a modest, but significant attenuation of myogenic tone. Mean maximal vessel diameters at 60 mm Hg (diamax) are (G) WT: 72 ± 3 μm, n = 5 from 4 mice; (H) CFTR knock out (KO): 88 ± 4 μm, n = 6 from 4 mice; and (H) WT littermates: 78 ± 4 μm, n = 5 from 2 mice. All data are mean ± SEM. In (A to C, H, and I), *p < 0.05 for unpaired comparisons with a 2-way analysis of variance; in (D to G), *p < 0.05 for unpaired comparisons with a t-test.
Figure 2
Figure 2
C18 increases WT CFTR Protein Expression and Function by a Proteostatic Mechanism (A) Cerebral arteries isolated from naïve mice treated with C18 (3 mg/kg intraperitoneally daily for 2 days; n = 5) have higher CFTR protein expression than arteries collected from vehicle control (Con) mice (n = 5). (B) C18 does not influence cerebral artery CFTR mRNA expression (Con: n = 6; C18: n = 5). (C) C18 (6 μmol/l; 24 h) increases CFTR protein expression in baby hamster kidney fibroblast cells stably expressing human CFTR (n = 12 for both groups). (D) C18 does not influence CFTR mRNA expression in this system (n = 6 for both groups). (E) Tumor necrosis factor (TNF) (10 ng/ml for 48 h) downregulates CFTR protein expression in mesenteric artery primary vascular smooth muscle cells (Con: n = 8; TNF: n = 8); co-incubating TNF with C18 (6 μmol/l; 24 h) following 24 h TNF incubation (i.e., 48 h TNF + 24 h C18) fully restores CFTR protein expression (n = 7). The restoration of CFTR protein expression in vascular smooth muscle cells correlates with the normalization of attenuated (F) Fluorescein isothiocyanate-labeled sphingosine-1-phosphate (FITC-S1P) uptake (measured as an increase in fluorescence intensity at 525 nm by a standard fluorescence-activated cell sorting analysis technique; Con: n = 7; TNF: n = 10; TNF+C18: n = 6) and (G) forskolin-stimulated iodide efflux (Con: n = 7; TNF: n = 6; TNF+C18: n = 6). All data are mean ± SEM. In (A to D), *p < 0.05 for an unpaired comparison with a t-test; in (E to G), *p < 0.05 for unpaired comparisons to the Con mice with a 1-way analysis of variance and Tukey’s post hoc test. Other abbreviation as in Figure 1.
Figure 3
Figure 3
C18 Restores Cerebral Perfusion in HF (A) Cerebral arteries isolated from mice with HF (6 weeks post-left anterior descending coronary artery ligation) have reduced CFTR protein expression (n = 5) relative to arteries isolated from sham-operated controls (n = 6). C18 treatment in vivo (3 mg/kg intraperitoneally daily for 2 days) eliminates this reduction in cerebral artery CFTR protein expression (n = 8). (B) C18 treatment in vivo reduces myogenic tone in PCAs isolated from HF mice, an effect (C) not observed in PCAs isolated from CFTR KO mice. Mean maximal vessel diameters at 45 mm Hg (diamax) are sham: 146 ± 9 μm; n = 5 from 3 mice; HF: 149 ± 8 μm; n = 6 from 4 mice; HF+C18: 155 ± 8 μm; n = 8 from 6 mice (1-way analysis of variance: p = NS); and CFTR KO: 142 ± 5 μm; n = 6 from 3 mice; CFTR KO+C18: 145 ± 5 μm; n = 6 from 3 mice (Student’s t-test: p = NS). Relative to sham-operated control mice, mice with HF have (D) reduced cardiac output (sham: n = 6; HF: n = 8; HF+C18: n = 8), (E) elevated total peripheral resistance (n = 6 for all groups), and (F) reduced mean arterial pressure (n = 6 for all groups); C18 treatment did not affect these parameters in mice with HF. (G) Representative magnetic resonance perfusion maps that were used to determine forebrain cortical cerebral blood flow. HF stimulated a reduction in cerebral perfusion, and C18 treatment significantly improved cerebral perfusion in mice with HF (sham: n = 6; HF: n = 8; HF+C18: n = 8). All data are mean ± SEM. For (A and G), *p < 0.05 for unpaired comparisons to the sham with a 1-way analysis of variance and Dunnett’s post hoc test; for (B), *p < 0.05 for unpaired comparisons to sham with a 2-way analysis of variance and Tukey’s post hoc test; in (C), groups were statistically compared with a 2-way analysis of variance (p = NS); and in (D to F), *p < 0.05 for unpaired comparisons to HF with a 1-way analysis of variance and Dunnett’s post hoc test. All samples in the representative Western blot image displayed in (A) originated from the same film, but the HF+C18 sample was not adjacently positioned on this film, as shown in this Figure. Abbreviations as in Figures 1 and 3.
Figure 4
Figure 4
C18 Does Not Induce Cerebral Edema Representative quantitative T2 maps that assess brain water content as T2 relaxation times in magnetic resonance images. A total of 9 T2 maps were assessed per mouse, which cover the fore-, mid-, and hind-brain regions. The representative images display slices from the (left) fore-, (center) mid-, and (right) hind-brain regions of (top) sham, (middle) HF, and (bottom) C18-treated (3 mg/kg intraperitoneally daily for 2 days) HF mice. Neither HF nor C18 treatment in HF mice induced an alteration in the T2 relaxation times in any region of interest within any of the slices assessed. The data were therefore pooled to yield a mean T2 relaxation time for the cortical and subcortical region and graphically presented (sham: n = 7; HF: n = 7; HF+C18: n = 6). All data are mean ± SEM. Groups were statistically compared with a 1-way analysis of variance test (p = NS among the sham, HF, and HF+C18 groups in the cortical and subcortical regions, respectively). Abbreviations as in Figure 1.
Figure 5
Figure 5
C18 Improves Neuronal Morphology and Neuronal Function in HF (A) Representative images of Golgi-stained pyramidal neurons from sham mice, mice with heart failure (HF), and C18-treated HF mice (3 mg/kg intraperitoneally daily for 2 weeks; treatment initiated at 10 weeks post-infarction). The morphology of both the basal and apical dendrites is highlighted with traces superimposed onto the images. (B) The images displayed in (A) are quantitatively assessed by Sholl analysis, which characterizes the dendritic network at 5-μm intervals to a maximal radius of 300 μm away from soma. (C) Sholl analysis histograms plotting the number of dendrite intersections (i.e., dendritic branching) versus dendrite length (i.e., distance from neuronal soma) show no differences in branching morphology across the sham (n = 12 neurons from N = 4 mice), HF (n = 12; N = 4), and HF+C18 (n = 11; N = 4) groups. However, dendritic length is shorter in HF mice, relative to the sham and HF+C18 groups. Accordingly, (D) the mean dendrite length (i.e., maximum radius) is significantly reduced in HF mice relative to sham mice, an effect that is normalized by C18 treatment. (E) In sham mice (n = 11; N = 4), the spine density of basal dendrites is relatively consistent over the length of the dendrite, yielding a slope that is not statistically different from zero. In HF mice (n = 13; N = 4), a statistically significant (p < 0.05) negative slope is observed, indicating a loss of spine density within the distal regions of the dendrite; HF mice treated with C18 (n = 12; N = 4) do not possess the negative slope observed for HF mice. Consequently, (F) mean basal dendrite spine density 60 to 100 μm from soma is significantly reduced in HF mice relative to sham controls; this morphological difference is normalized by C18 treatment. (G) Relative to sham mice (N = 10), HF (N = 8) attenuates rhino-cortical−dependent, short-term retention of object familiarity in a nonspatial novel object recognition task, with a 5-min delay interval; the attenuation is not present in C18-treated HF mice (N = 8). (H) Longitudinal pre-/post-treatment analyses of the same vehicle- and C18- treated HF mice confirm a statistically significant C18 treatment effect on rhino-cortical, short-term retention memory. In (D, F, and G), *p < 0.05 for unpaired comparisons to the sham and +p < 0.05 for an unpaired comparison between the HF and HF+C18 groups with a 1-way analysis of variance and Tukey’s post hoc test. In (H) *p < 0.05 for a comparison with a paired t-test. Tn = time spent interacting with novel object; To = time spent interacting with original object.
Figure 6
Figure 6
C18 Restores Cerebral Perfusion In SAH (A) Cerebral arteries isolated from mice with SAH (2 days post-SAH induction) have reduced CFTR protein expression (n = 6), relative to arteries isolated from sham-operated controls (n = 6). C18 treatment in vivo (3 mg/kg intraperitoneally daily for 2 days) eliminated this reduction in artery CFTR protein expression (n = 6). (B) C18 treatment in vivo reduced myogenic tone in olfactory arteries isolated from mice with SAH, an effect (C) not observed in olfactory arteries isolated from CFTR KO mice. Mean maximal vessel diameters at 45 mmHg (diamax) are sham: 113 ± 3 μm; n = 5 from 3 mice; SAH: 109 ± 6 μm; n = 6 from 6 mice; SAH+C18:104 ± 12 μm; n = 5 from 4 mice (1-way analysis of variance: p = NS); and CFTR WT: 98 ± 6 μm; n = 8 from 4 mice; CFTR KO: 110 ± 8 μm; n = 5 from 4 mice; CFTR KO+C18: 96 ± 6 μm; n = 6 from 3 mice (1-way analysis of variance: p = NS). (D) Representative magnetic resonance perfusion maps that were used to determine forebrain cortical CBF. SAH stimulated a reduction in cerebral perfusion; C18 treatment significantly improved cerebral perfusion in mice with SAH (sham: n = 10; SAH: n = 5; SAH+C18: n = 9). All data are mean ± SEM. In (A and D), *p < 0.05 for unpaired comparisons to the sham with a 1-way analysis of variance and Dunnett’s post hoc test. In (B), *p < 0.05 for unpaired comparisons to SAH with a 2-way analysis of variance and Tukey’s post hoc test. In (C), *p < 0.05 for unpaired comparisons to WT with a 2-way analysis of variance and Tukey’s post hoc test. Abbreviations as in Figures 1, 3, and 4.
Figure 7
Figure 7
Lum Increases WT CFTR Protein Expression by a Proteostatic Mechanism and Restores Cerebral Perfusion in SAH (A) Cerebral arteries isolated from naïve mice treated with Lum (3 mg/kg intraperitoneally daily for 2 days; n = 6) have higher CFTR protein expression than arteries collected from vehicle controls (n = 7). (B) Lum does not influence cerebral artery CFTR mRNA expression (n = 5 for both groups). (C) Lum (6 μmol/l; 24 h) increases CFTR protein expression in baby hamster kidney fibroblast cells stably expressing human CFTR (n = 13 for both groups). (D) Lum does not influence CFTR mRNA expression in this system (n = 6 for both groups). (E) Cerebral arteries isolated from mice with SAH (2 days post-SAH induction) have reduced CFTR protein expression (n = 5) relative to arteries isolated from sham-operated controls (n = 6). Lum treatment in vivo (3 mg/kg intraperitoneally daily for 2 days) eliminates this reduction in cerebral artery CFTR protein expression (n = 6). (F) Lum treatment in vivo reduces myogenic tone in olfactory arteries isolated from mice with SAH. Mean maximal vessel diameters at 45 mm Hg (diamax) are sham: 91 ± 3 μm; n = 7 from 4 mice; SAH: 86 ± 2 μm; n = 6 from 3 mice; SAH+Lum: 87 ± 4 μm; n = 7 from 4 mice (1-way analysis of variance: p = NS). (G) Representative magnetic resonance perfusion maps that were used to determine CBF. SAH stimulated a reduction in cerebral perfusion; Lum treatment significantly improved cerebral perfusion in mice with SAH (sham: n = 6; SAH: n = 5; SAH+Lum: n = 6). All data are mean ± SEM. In (A to D), * p < 0.05 for an unpaired comparison with a t-test; in (E and G), *p < 0.05 for unpaired comparisons to sham with a 1-way analysis of variance test and Dunnett’s post hoc test. In (F), *p < 0.05 for unpaired comparisons to sham with a 2-way analysis of variance and Tukey’s post hoc test. Abbreviations as Figures 1, 2, and 3.
Figure 8
Figure 8
CFTR Correction Reduces Neuronal Injury in SAH (Top) Representative images of cortical cells stained for cleaved caspase-3 expression and (bottom) with Fluoro-Jade for cohorts involving (A) C18 (3 mg/kg intraperitoneally daily for 2 days) and (B) lumacaftor (Lum) (3 mg/kg intraperitoneally daily for 2 days) treatment regimens. Subarachnoid hemorrhage (SAH) (n = 13 mice) increases the number of (C) caspase-3 and (D) Fluoro-Jade positive cells relative to sham-operated control mice (n = 12); both C18 (n = 6) and lumacaftor (n = 5) abolished the increase in caspase-3 and Fluoro-Jade staining. (E) Mice with SAH (n = 19) have a lower modified Garcia score (maximum score = 18; blinded assessments made 2 days post-SAH) compared with sham-operated mice (n = 15); both C18 (n = 10) and Lum (n = 8) treatment restored the neurological score to the sham level. All data are mean ± SEM; *p < 0.05 for unpaired comparisons to sham and +p < 0.05 compared with untreated SAH with a 1-way analysis of variance and Tukey’s post hoc test.

Comment in

References

    1. Román G.C. Brain hypoperfusion: a critical factor in vascular dementia. Neurol Res. 2004;26:454–458. - PubMed
    1. Doehner W., Ural D., Haeusler K.G. Heart and brain interaction in patients with heart failure: overview and proposal for a taxonomy. A position paper from the Study Group on Heart and Brain Interaction of the Heart Failure Association. Eur J Heart Fail. 2018;20:199–215. - PubMed
    1. Wong G.K., Lam S., Ngai K. Evaluation of cognitive impairment by the Montreal cognitive assessment in patients with aneurysmal subarachnoid haemorrhage: prevalence, risk factors and correlations with 3 month outcomes. J Neurol Neurosurg Psychiatry. 2012;83:1112–1117. - PubMed
    1. Yang J., Hossein Noyan-Ashraf M., Meissner A. Proximal cerebral arteries develop myogenic responsiveness in heart failure via tumor necrosis factor-α-dependent activation of sphingosine-1-phosphate signaling. Circulation. 2012;126:196–206. - PubMed
    1. Meissner A., Visanji N.P., Momen M.A. Tumor necrosis factor-α underlies loss of cortical dendritic spine density in a mouse model of congestive heart failure. J Am Heart Assoc. 2015;4 - PMC - PubMed