. 2020 Dec;33(12):e4226.
doi: 10.1002/nbm.4226. Epub 2020 Jan 7.

Multidimensional correlation MRI

Affiliations

Multidimensional correlation MRI

Dan Benjamini et al. NMR Biomed. 2020 Dec.

Abstract

Multidimensional correlation spectroscopy is emerging as a novel MRI modality that is well suited for microstructure and microdynamic imaging studies, especially of biological specimens. Conventional MRI methods only provide voxel-averaged and mostly macroscopically averaged information; these methods cannot disentangle intra-voxel heterogeneity on the basis of both water mobility and local chemical interactions. By correlating multiple MR contrast mechanisms and processing the data in an integrated manner, correlation spectroscopy is able to resolve the distribution of water populations according to their chemical and physical interactions with the environment. The use of a non-parametric, phenomenological representation of the multidimensional MR signal makes no assumptions about tissue structure, thereby allowing the study of microscopic structure and composition of complex heterogeneous biological systems. However, until recently, vast data requirements have confined these types of measurement to non-localized NMR applications and prevented them from being widely and successfully used in conjunction with imaging. Recent groundbreaking advancements have allowed this powerful NMR methodology to be migrated to MRI, initiating its emergence as a promising imaging approach. This review is not intended to cover the entire field of multidimensional MR; instead, it focuses on pioneering imaging applications and the challenges involved. In addition, the background and motivation that have led to multidimensional correlation MR development are discussed, along with the basic underlying mathematical concepts. The goal of the present work is to provide the reader with a fundamental understanding of the techniques developed and their potential benefits, and to provide guidance to help refine future applications of this technology.

Keywords: Laplace; MRI; diffusometry; inversion; multidimensional; multiexponential; relaxometry.


Figures

FIGURE 1
FIGURE 1
First NMR application of a regularized inversion algorithm to estimate T1 and T2 distributions from in vivo legs of C3H mice in normal conditions and after injection of tumor cells (KHT). In all cases, multiple components were detected. The average values of both T1 and T2 increased with tumor size. The T1 peaks shift to the right as the tumor grows; the T2 peaks redistribute to the right. Adapted from the work of Kroeker and Henkelman
FIGURE 2
FIGURE 2
Two dimensional correlation NMR studies on non-biological samples. A, the T1-T2 correlation spectrum for oolitic limestone. The solid thick red line is the theoretical behavior of the sum of the surface and bulk contributions to T1 and T2. Adapted from the work of Song et al. B, the D-T2 correlation spectrum for Berea sandstone saturated with a mixture of water and oil. The contributions of the water and oil phases are clearly separated in the two dimensions. Adapted from the work of Hurlimann et al. C, D, comparison of T1-T2 (C) and D-T2 (D) distributions measured on heavy cream. The dashed lines in the T1-T2 distribution functions indicate T1=T2, whereas in the D-T2 distribution functions they indicate the diffusion coefficient of water. Adapted from the work of Hürlimann et al
FIGURE 3
FIGURE 3
Two dimensional correlation studies on biological samples. A, the T1-T2 correlation spectrum for trigeminal nerve data averaged from seven rats. The three components are clear and their relative fractions and mean T1 and T2 values are shown, along with the standard deviation of these measurements across the seven rats. Adapted from the work of Does and Gore. B, the T1-T2 correlation spectrum for trigeminal nerve data averaged from seven frogs. The three components deemed to be nerve water, representing 88% of the total signal, are shown in black; the remaining spurious components are shown in gray. Adapted from the work of Travis and Does. C, the T1-T2 correlation spectrum for chromated rat WM. By washing the samples with chromium, a WM-specific enhancer, the long T1-T2 component in the distribution was split into two. Adapted from the work of Dortch et al. D, the diffusion–diffusion correlation spectrum averaged across the entire mouse brain. Correlations were measured between displacements along two arbitrary orthogonal directions. Adapted from the work of Zong et al
FIGURE 4
FIGURE 4
Experimental validation of the MADCO framework. ROIs drawn on DW-IR images of the MRI phantom resulted in two (top) and three (bottom) distinct D-T1 peaks. The averaged data were then used to reconstruct the spectra by using full (conventional) and partial (MADCO) datasets. Note the higher accuracy of the MADCO-reconstructed three-peak spectrum, with only 4% of the data used, compared with results from the conventional approach. Adapted from the work of Benjamini and Basser,
FIGURE 5
FIGURE 5
The ground truth multicomponent T1-T2 probability distribution that is used to generate the simulated data matrix with added Gaussian distributed noise of zero mean to provide SNR=200
FIGURE 6
FIGURE 6
Application of several inversion strategies as a function of data acquisition sparsity. A, TSVD procedure followed by 2 regularization. The regularization parameter was chosen according to the GCV method. B, TSVD procedure followed by 1 regularization. The regularization parameter was chosen according to the GCV method, using an adjusted criterion. C, MC NNLS with 1000 bootstrap samples each containing two-thirds of the dataset, randomly sampled with replacement. D, MADCO reconstruction using the marginal distributions fT1 and fT2, with 2 regularization and GCV method. Different columns show different dataset subsamplings, 100%, 50%, 25% and 5.5% (left to right)
FIGURE 7
FIGURE 7
Spatial maps of the D-T2 SFs from the control and injured spinal cords. A, spatially averaged distributions with the spectral regions that are integrated to generate the spatial maps (red, comp. 1; blue, comp. 2; green, comp. 3; yellow, comp. 4). B, the spatial maps corresponding to the spectral regions. Adapted from the work of Kim et al. (comp. = component)
FIGURE 8
FIGURE 8
D-T1-T2 spectral information from a spinal cord specimen, gathered by using MADCO. The top panel shows WM and GM unique spectral peaks (A-G). Additionally, a WM-GM mixture is shown, with well separated D-T1-T2 spectral components according to short, intermediate and long relaxation values and slow, intermediate and fast diffusivities. All the identified WM and GM peaks had a unique multispectral signature, thus allowing their unequivocal identification in the more challenging, and more realistic, case of mixed GM and WM. The bottom panel shows the spatial SF maps corresponding to the above spectral regions, separated according to water mobility and tissue type specificity. (inter. = intermediate.) adapted from the work of Benjamini and Basser
FIGURE 9
FIGURE 9
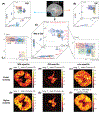
T2-D spectra show anatomical specificity. Top panel: T2-D spectrum derived from spatially averaged signal from the entire placenta and uterine wall, with the three spectral regions that are integrated to generate the spatial SF maps below. Bottom panel: T2-D spectra derived from the spatially averaged signal of control and abnormal cases. Horizontal, dashed blue lines represent the approximate diffusivity of water in free media at 37°C. (GA, gestational age; CH, chronic hypertensive; PE, pre-eclampsia; FGR, fetal growth restriction). Adapted from the work of Slator et al

References

    1. Basser PJ, Mattiello J, LeBihan D. MR diffusion tensor spectroscopy and imaging. Biophys J. 1994;66(1):259–267. 10.1016/S0006-3495(94)80775-1 - DOI - PMC - PubMed
    1. Frank LR. Characterization of anisotropy in high angular resolution diffusion-weighted MRI. Magn Reson Med. 2002;47(6):1083–1099. 10.1002/mrm.10156 - DOI - PubMed
    1. Shepherd TM, Ozarslan E, King MA, Mareci TH, Blackband SJ. Structural insights from high-resolution diffusion tensor imaging and tractography of the isolated rat hippocampus. Neuroimage. 2006;32(4):1499–1509. 10.1016/j.neuroimage.2006.04.210 - DOI - PubMed
    1. Alexander DC, Hubbard PL, Hall MG, et al. Orientationally invariant indices of axon diameter and density from diffusion MRI. Neuroimage. 2010;52(4):1374–1389. 10.1016/j.neuroimage.2010.05.043 - DOI - PubMed
    1. Szczepankiewicz F, Lasič S, van Westen D, et al. Quantification of microscopic diffusion anisotropy disentangles effects of orientation dispersion from microstructure: applications in healthy volunteers and in brain tumors. Neuroimage. 2015;104:241–252. 10.1016/j.neuroimage.2014.09.057 - DOI - PMC - PubMed

Publication types