. 2020 Jan 7:9:e52063.
doi: 10.7554/eLife.52063.

The genetic basis of aneuploidy tolerance in wild yeast

Affiliations

The genetic basis of aneuploidy tolerance in wild yeast

James Hose et al. Elife. .

Abstract

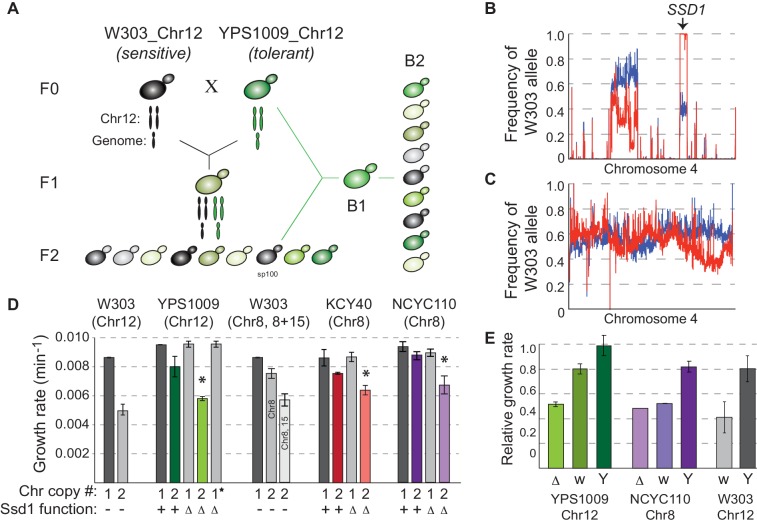
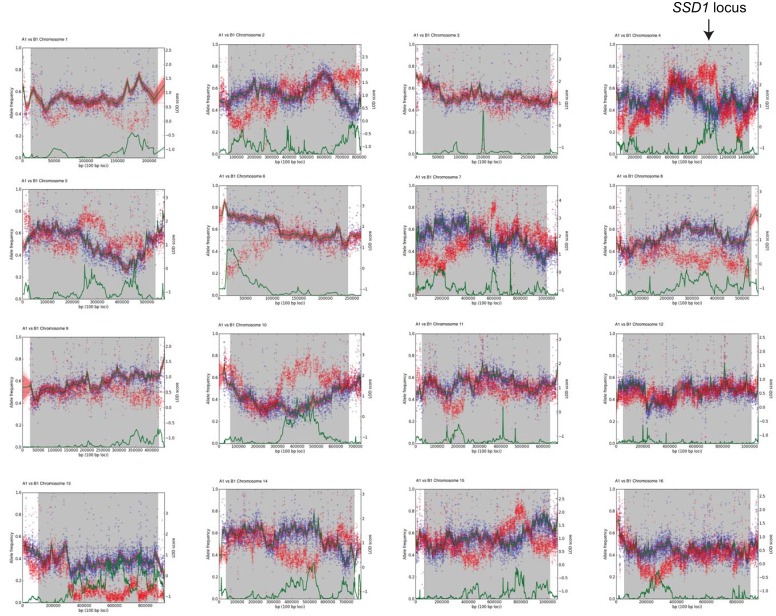
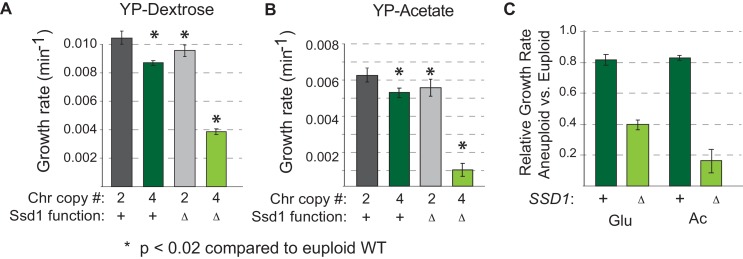
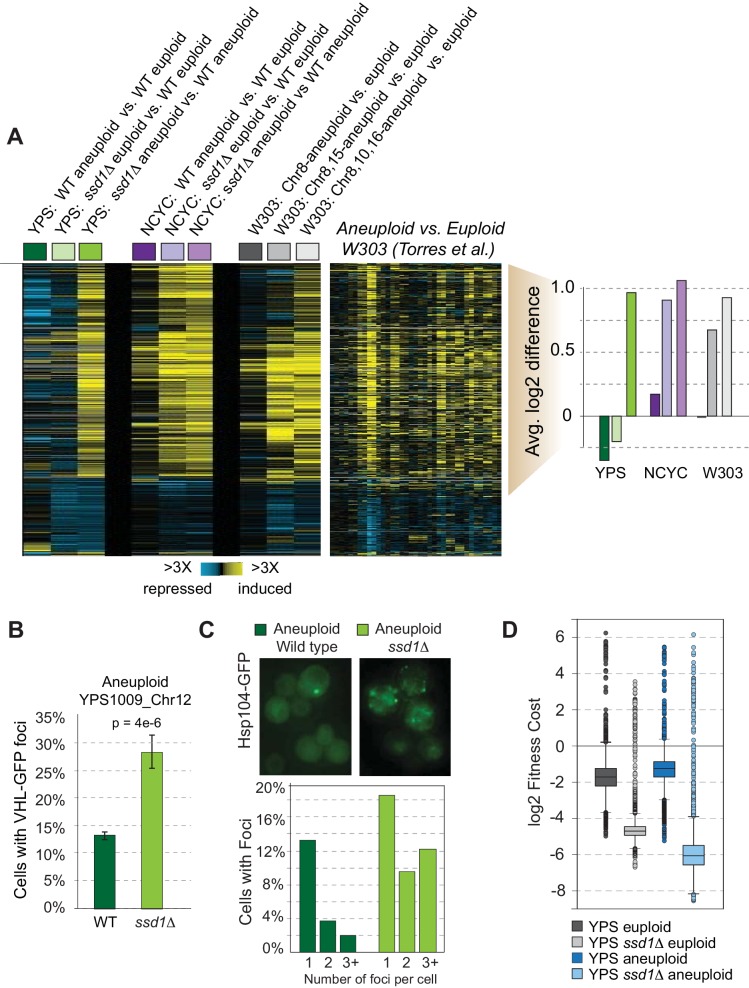
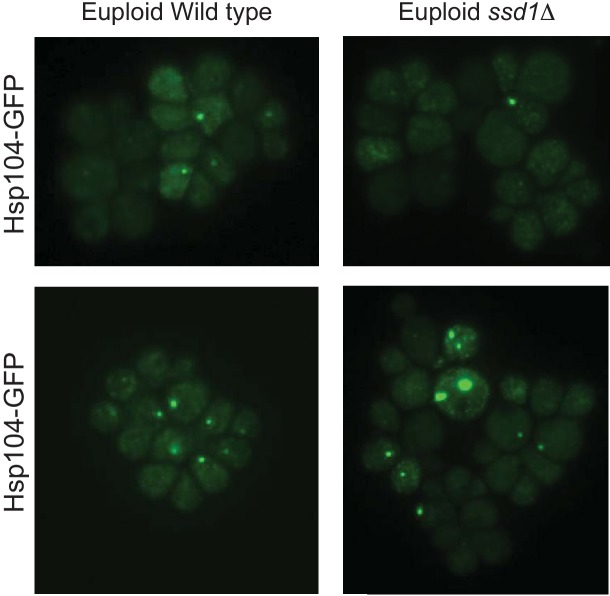
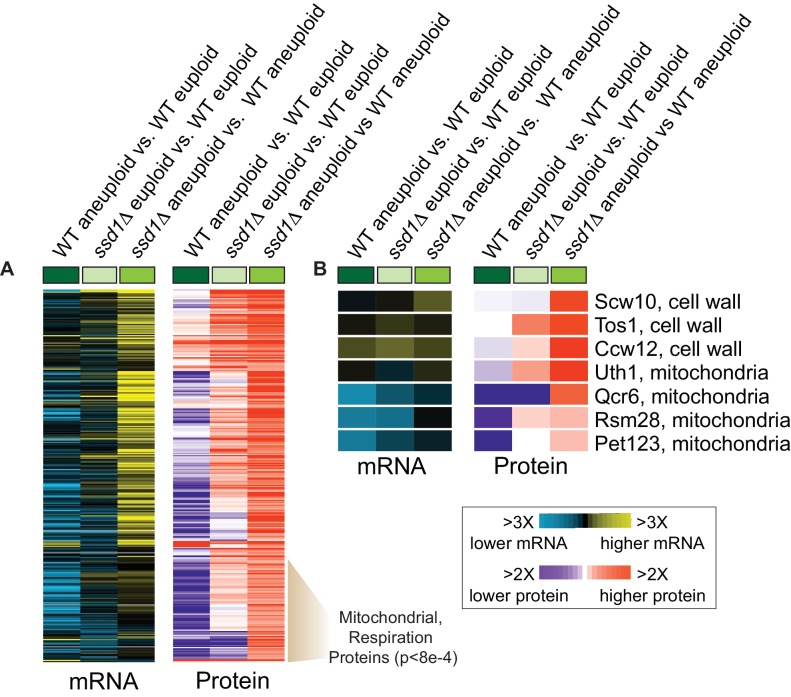
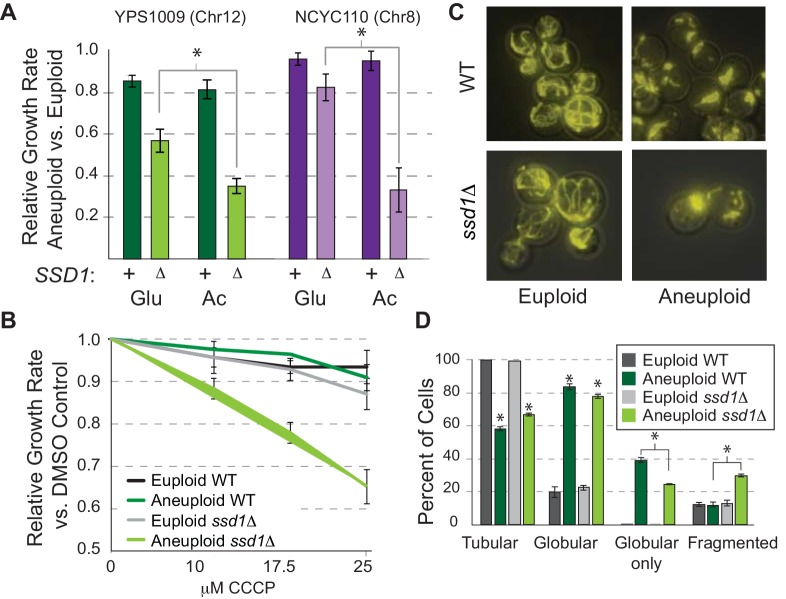
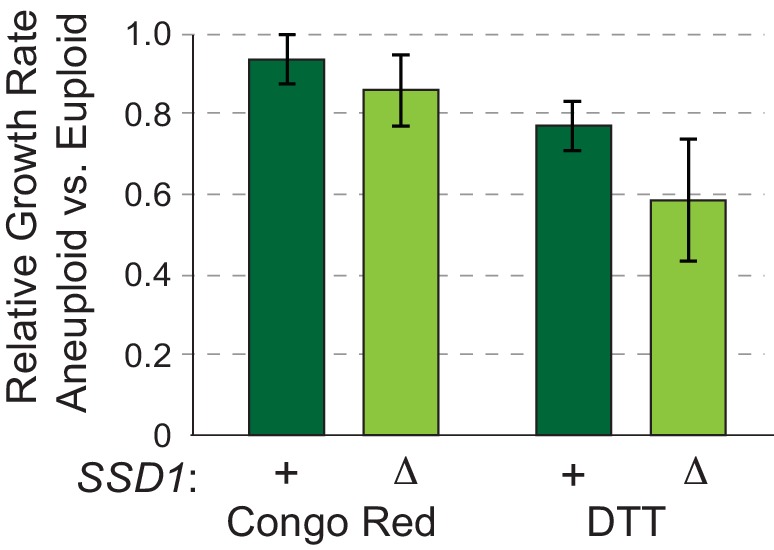
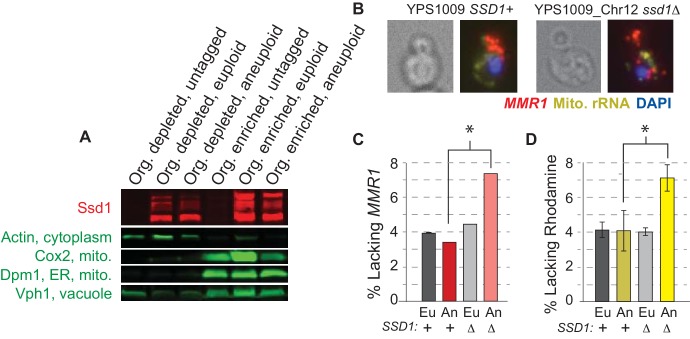
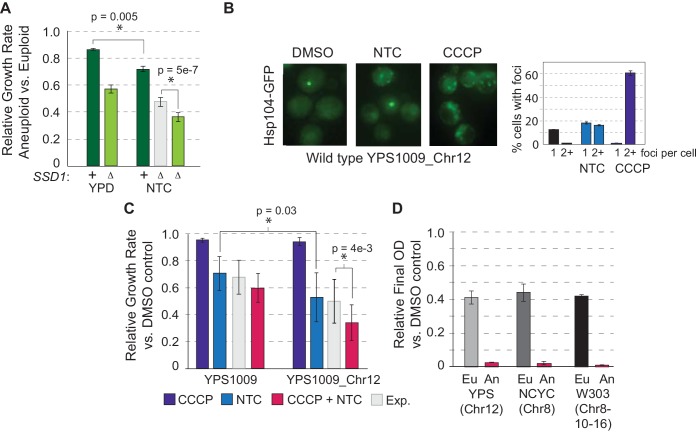
Aneuploidy is highly detrimental during development yet common in cancers and pathogenic fungi - what gives rise to differences in aneuploidy tolerance remains unclear. We previously showed that wild isolates of Saccharomyces cerevisiae tolerate chromosome amplification while laboratory strains used as a model for aneuploid syndromes do not. Here, we mapped the genetic basis to Ssd1, an RNA-binding translational regulator that is functional in wild aneuploids but defective in laboratory strain W303. Loss of SSD1 recapitulates myriad aneuploidy signatures previously taken as eukaryotic responses. We show that aneuploidy tolerance is enabled via a role for Ssd1 in mitochondrial physiology, including binding and regulating nuclear-encoded mitochondrial mRNAs, coupled with a role in mitigating proteostasis stress. Recapitulating ssd1Δ defects with combinatorial drug treatment selectively blocked proliferation of wild-type aneuploids compared to euploids. Our work adds to elegant studies in the sensitized laboratory strain to present a mechanistic understanding of eukaryotic aneuploidy tolerance.

Keywords: S. cerevisiae; aneuploidy; chromosomes; gene expression; natural variation; proteotoxicity; wild strains.


Conflict of interest statement

JH, LE, KC, HD, DR, VB, JC, ES, AG No competing interests declared

Figures

Figure 1.
Figure 1.. SSD1 is required for aneuploidy tolerance.
(A) Mapping schema, see Materials and methods. (B) W303 allele frequency across Chr4 in the pool of aneuploidy-sensitive (red) versus -tolerant (blue) B2 segregants or C) small (red) versus large (blue) colony pools from the euploid-control cross. (D) Average and standard deviation of growth rates for denoted strains with amplified chromosomes, indicated above. Number of chromosomes per haploid genome, SSD1 status (Δ, deletion; –, ssd1W303), and star indicating euploid revertant are indicated below. Asterisk, p<0.005, T-test comparing aneuploids with and without SSD1. (E) Average and standard deviation of growth of aneuploid ssd1- strains harboring empty vector (Δ), ssd1W303 (w) or SSD1YPS1009 (Y), relative to the isogenic aneuploid wild type with empty vector (or euploid cells with empty vector in the case of W303 ssd1W303 cells).
Figure 1—figure supplement 1.
Figure 1—figure supplement 1.. Aneuploidy tolerance varies in W303 and YPS1009 strains.
(A). Tetrads resulting from dissection of diploid W303_Chr12-3n or YPS1009_Chr12-3n, each trisomic for Chr12, onto solid YPD medium. Aneuploidy segregates 2:2 (confirmed by qPCR as outlined in Materials and methods), with extreme colony size differences evident in aneuploid versus euploid W303 (top) but not YPS1009 (bottom). (B) Colony sizes of haploid, Chr12 aneuploid F2 segregants from the hYPS1009_Chr12 x W303_Chr12 cross. Cells are sorted by colony size.
Figure 1—figure supplement 2.
Figure 1—figure supplement 2.. Auxotrophies influence aneuploidy tolerance.
W303 harbors multiple auxotrophies that likely influence cell growth and potentially aneuploidy tolerance. We therefore phenotyped aneuploid F2s from the cross for auxotrophies including adenine (ade-), histidine (his-), uracil, leucine and tryptophan, by plating cells on synthetic medium lacking each nutrient. (A) Doubling-time distributions of aneuploidy-tolerant (B1 pool) and aneuploidy-sensitive (A1 pool) F2s in liquid YPD medium. Pools were defined based on propensity of each culture to lose Chr12 after ~20 generations of growth. Auxotrophies were determined at the time of tetrad dissection by replica plating onto drop-out media. Ade- cells in Pool B1 that maintained Chr12 after passaging showed slower growth in rich medium compare to Ade+ cells, with little additional effect if cells were also auxotrophic for histidine (his-), whereas the aneuploidy sensitive pool showed a wider range of growth rates. (B) To test if adenine auxotrophy influences the trait, we supplemented adenine to the media or reintroduced the missing ADE2 gene. Figure 1—figure supplement 2B shows the average and standard deviation of doubling times for euploid (gray scale) and aneuploid (brown scale) W303 with or without the ADE2 gene integrated into the native genomic locus, as cells were grown in rich medium (YPD) or rich medium supplemented with additional adenine (YPAD). Reintroducing the ADE2 gene into euploid W303 improved growth (i.e. decreased doubling time) to the same effect as adenine supplementation. However, reintroducing ADE2 in the W303_Chr12 aneuploid produced a much more dramatic effect than supplementation, decreasing doubling time by nearly 30%. Thus, adenine prototrophy specifically improves the growth rate of aneuploid W303. Propensity of the culture to lose Chr12 is highly correlated with growth rate in backcrossed spores. Spores from the backcross (see Figure 1A) were partitioned into aneuploidy-tolerant pool B2 and aneuploidy-sensitive pool A2 based only on the propensity of the culture to lose Chr12 after passaging. This phenotype was highly correlated with initial colony size after dissection (C) and doubling time (D), even though colony size and growth rate were not considered in the pooling. In both cases, the aneuploidy-sensitive strains showed considerably reduced growth (p-value above plots, Welch’s T-test).
Figure 1—figure supplement 3.
Figure 1—figure supplement 3.. Multipool output for initial cross.
As shown in Figure 1B but for each of the 16 yeast chromosomes from the initial cross.
Figure 1—figure supplement 4.
Figure 1—figure supplement 4.. Multipool output for the backcross.
As shown in Figure 1B but for each of the 16 yeast chromosomes from the YPS1009_Chr12 backcross. LOD traces are shown in green. Missing plots for Chr three and Chr six result from failed Multipool runs, presumably due to low recombination rates in the backcross. We focused on peaks enriched for W303 alleles in both the initial cross (Figure 1—figure supplement 3) and backcross that were not significant in the euploid cross scoring growth rate.
Figure 1—figure supplement 5.
Figure 1—figure supplement 5.. Ssd1 is required for aneuploidy tolerance in diploid YPS1009.
As shown in Figure 1D. for diploid YPS1009 with two or four copies of Chr12, with and without SSD1 according to the key, for cells grown on A) dextrose or B) acetate as a sole carbon source. (C) Growth rates in each aneuploid relative to the paired euploid is shown for direct comparison to haploid strains in Figure 4A. The relative growth rate of diploid cells tetrasomic for Chr12 was more severely affected by SSD1 deletion, especially on acetate where cells grew extremely slowly. The latter result is consistent with our published results in which we were unable to make diploid W303 aneuploids that could maintain respiration, whereas haploid W303 with extra chromosomes was defective but showed some respiratory capability (Hose et al., 2015). Interestingly, unlike in haploids, the diploid YPS1009 euploid strain showed a subtle but statistically significant (*=p < 0.02, paired T-test) growth reduction compared to wild-type, euploid cells, implicating Ssd1 in base-ploidy specific effects.
Figure 2.
Figure 2.. SSD1 deletion induces aneuploidy signatures.
(A) Replicate-averaged log2 expression differences for strain comparisons (columns) across 861 genes (rows) differentially expressed in mutant versus wild-type aneuploids, see text. Strains include haploid YPS1009 disomic for Chr12, diploid NCYC110 tetrasomic for Chr 8, or haploid W303 derivatives with different chromosome amplifications. Corresponding data from Torres et al. and average log2 differences in expression of induced genes are shown, where colors indicate strain labels from left. (B–C) Quantification of B) VHL-GFP foci and C) Hsp104-GFP in aneuploid strains. Data represent average and standard error of the mean (SEM) across biological triplicates, p from Fisher’s exact test. (D) Distribution of replicate-averaged fitness costs from high-copy plasmid over-expression in each strain (see Materials and methods).
Figure 2—figure supplement 1.
Figure 2—figure supplement 1.. Hsp104-GFP foci in euploid cells.
Representative images of euploid YPS1009 wild type and ssd1Δ cells. For the most part, the euploid mutant looked very similar to the wild-type strain in terms of Hsp104-GFP foci number and quality, with only occasional cells harboring >1 Hsp104-GFP focus (bottom example). Thus, defects in proteostasis are occasionally seen in the euploid mutant but exacerbated by Chr12 duplication in YPS1009_Chr12 ssd1Δ cells.
Figure 3.
Figure 3.. Ssd1 affects the proteome in aneuploid YPS1009 cells.
(A) Replicate-averaged log2(fold difference) in abundance across 301 significant proteins (FDR < 0.05) and their corresponding mRNAs (rows) for denoted comparisons (columns), where colors represent the magnitude of change according to the key. The indicated cluster is enriched for mitochondrial proteins and respiration factors (hypergeometric test). (B) Representative Ssd1-bound transcripts from (A).
Figure 4.
Figure 4.. Ssd1 affects mitochondrial function and morphology.
(A) Average and standard deviation of growth rates for denoted aneuploids versus euploids ± SSD1 in glucose (Glu) or acetate (Ac). Asterisk, p<2e-4, replicate-paired T-test. (B) Average growth rates across CCCP doses. (C) Representative images of rhodamine-B stained mitochondria and D) quantified morphologies for cells with any tubular, any globular, only globular, or fragmented mitochondria (average and SEM, see Materials and methods). p<0.0001, Fisher’s exact test.
Figure 4—figure supplement 1.
Figure 4—figure supplement 1.. No synergistic defects between aneuploidy and cell-wall or ER stress.
Average and standard deviation of growth rates in aneuploid relative to euploid cells in the presence of 0.02 mg/mL Congo red or 2.5 mM dithiolthreitol (DTT). As shown in Figure 4A. Aneuploid YPS1009_Chr12 ssd1Δ cells are not significantly more sensitive than wild-type cells to cell-wall stress inflicted by Congo red or ER stress via DTT (p>0.05, replicate-paired T-test). The lack of synergistic sensitivity to these drugs indicates that the synergistic sensitivity of the mutant to aneuploidy plus mitochondrial stress, non-fermentable acetate, and NTC (see main text) is not due to overall stress sensitivity of the aneuploid mutant but rather implicates a specific defect in mitochondrial function and proteostasis in aneuploid ssd1Δ cells.
Figure 5.
Figure 5.. Ssd1 affects mRNA localization.
(A) Representative Western blot showing Ssd1-GFP and markers of mitochondria, ER, and vacuole as detected in organelle-depleted and organelle-enriched fractions from SSD1-GFP or untagged-Ssd1 strains (see Methods). Ssd1 fragments migrating below the expected top band emerge during the fractionation incubations. (B) Representative smFISH showing bud-localized MMR1 transcript in wild-type and ssd1Δ aneuploids. (C) Quantification of percent buds lacking MMR1 from smFISH (see Materials and methods). (D) Percent of cells lacking Rhodamine staining. Histograms represent average and SEM across biological triplicates; *, p<0.02, Fisher’s exact test.
Figure 6.
Figure 6.. Protein misfolding and mitochondrial dysfunction sensitize aneuploids.
(A) Average and standard deviation of relative growth rates in rich YPD medium or with 1 ug/mL NTC. The expected (Exp, light gray) additive effect was calculated based on the fold-drop in growth rate of NTC-treated euploid cells applied to the wild-type aneuploid growth rate in the absence of NTC. (B) Representative Hsp104-GFP foci triggered by 1 ug/mL NTC or 25 uM CCCP and quantification in YPS1009_Chr12 (average and SEM). (C) Average relative growth rate over three generations for indicated treatments or additive expectation (Exp, paired T-test). (D) Relative final optical density after overnight CCCP + NTC treatment in euploid (Eu) and aneuploid (An) strains (see Materials and methods).

Similar articles

Cited by

References

    1. Antonarakis SE. Down syndrome and the complexity of genome dosage imbalance. Nature Reviews Genetics. 2017;18:147–163. doi: 10.1038/nrg.2016.154. - DOI - PubMed
    1. Astuti D, Morris MR, Cooper WN, Staals RH, Wake NC, Fews GA, Gill H, Gentle D, Shuib S, Ricketts CJ, Cole T, van Essen AJ, van Lingen RA, Neri G, Opitz JM, Rump P, Stolte-Dijkstra I, Müller F, Pruijn GJ, Latif F, Maher ER. Germline mutations in DIS3L2 cause the Perlman syndrome of overgrowth and Wilms tumor susceptibility. Nature Genetics. 2012;44:277–284. doi: 10.1038/ng.1071. - DOI - PubMed
    1. Bambrick LL, Fiskum G. Mitochondrial dysfunction in mouse trisomy 16 brain. Brain Research. 2008;1188:9–16. doi: 10.1016/j.brainres.2007.10.045. - DOI - PubMed
    1. Bennett RJ, Forche A, Berman J. Rapid mechanisms for generating genome diversity: whole ploidy shifts, aneuploidy, and loss of heterozygosity. Cold Spring Harbor Perspectives in Medicine. 2014;4:a019604. doi: 10.1101/cshperspect.a019604. - DOI - PMC - PubMed
    1. Brennan CM, Vaites LP, Wells JN, Santaguida S, Paulo JA, Storchova Z, Harper JW, Marsh JA, Amon A. Protein aggregation mediates stoichiometry of protein complexes in aneuploid cells. Genes & Development. 2019;33:1031–1047. doi: 10.1101/gad.327494.119. - DOI - PMC - PubMed

Publication types

MeSH terms

Substances

Associated data