. 2020 Apr 1;130(4):1713-1727.
doi: 10.1172/JCI128190.

Prevention of connexin-43 remodeling protects against Duchenne muscular dystrophy cardiomyopathy

Affiliations

Prevention of connexin-43 remodeling protects against Duchenne muscular dystrophy cardiomyopathy

Eric Himelman et al. J Clin Invest. .

Abstract

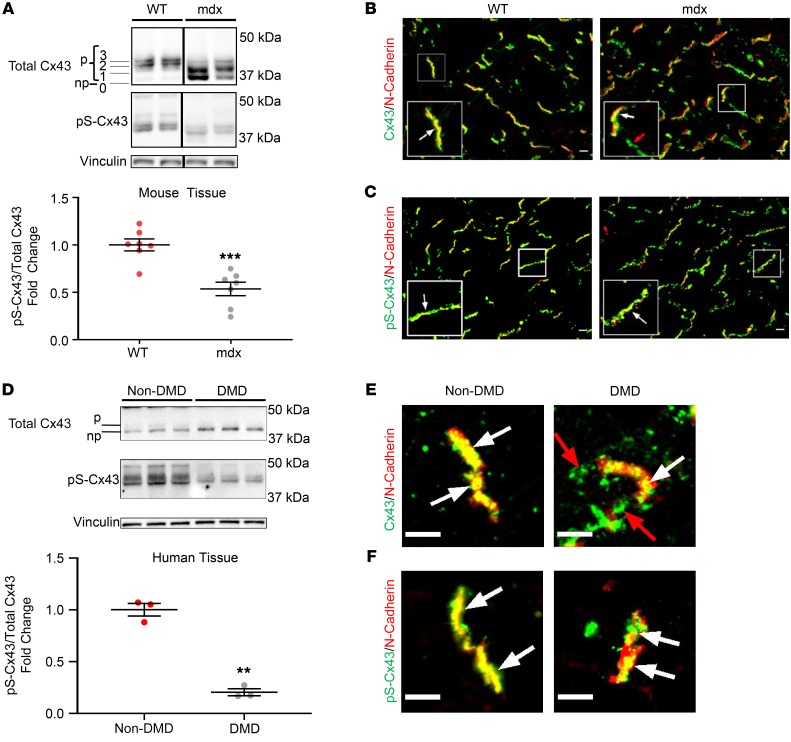
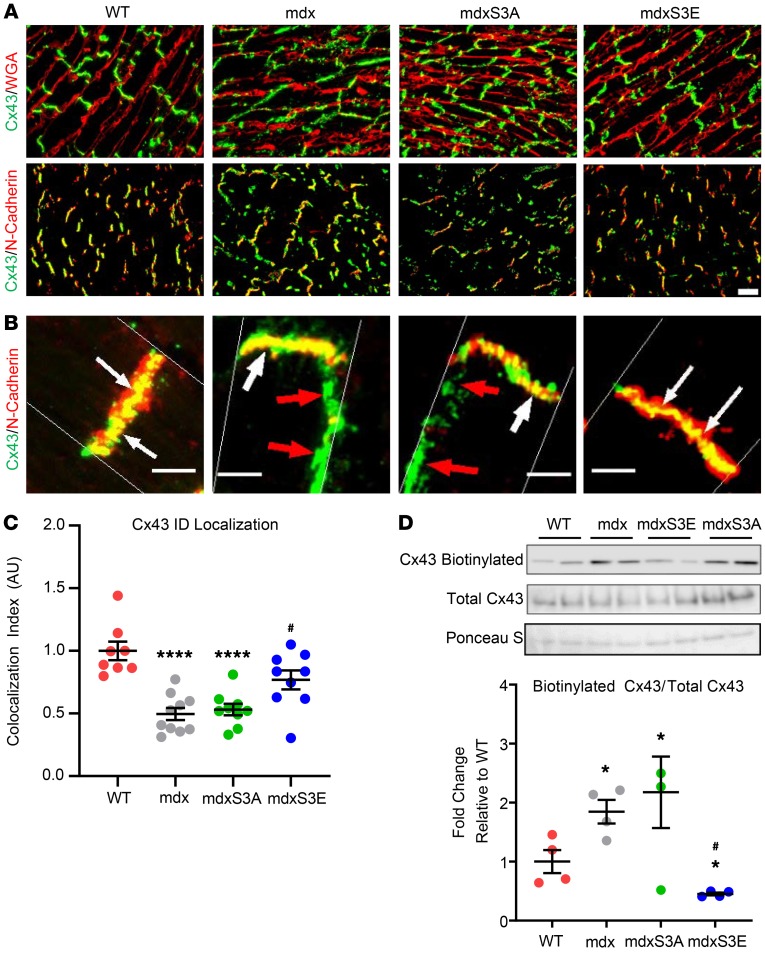
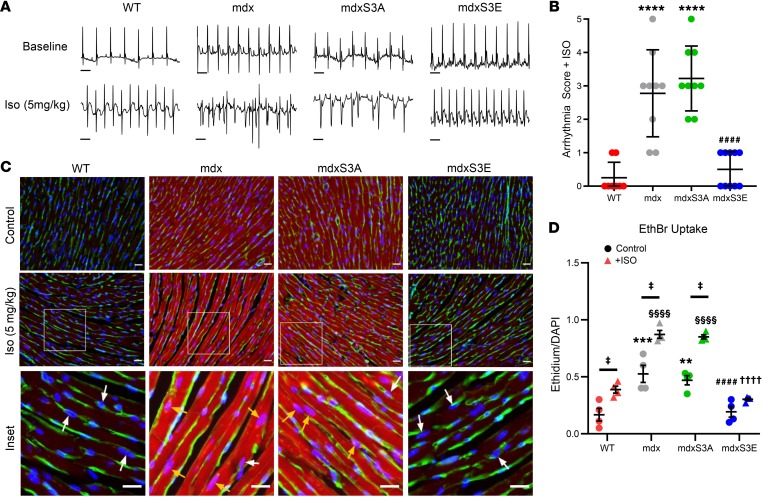
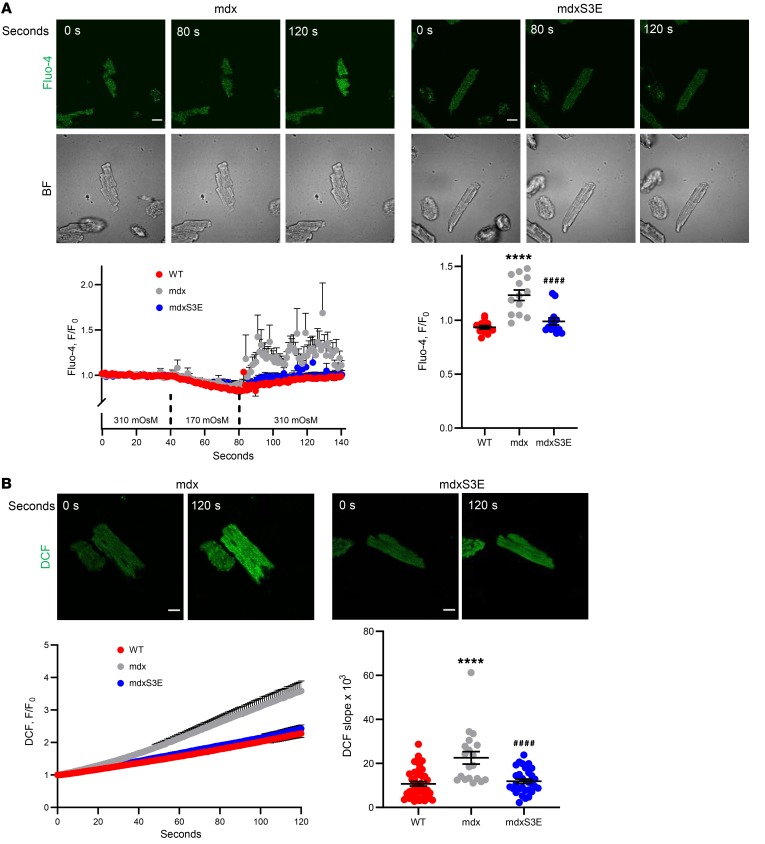
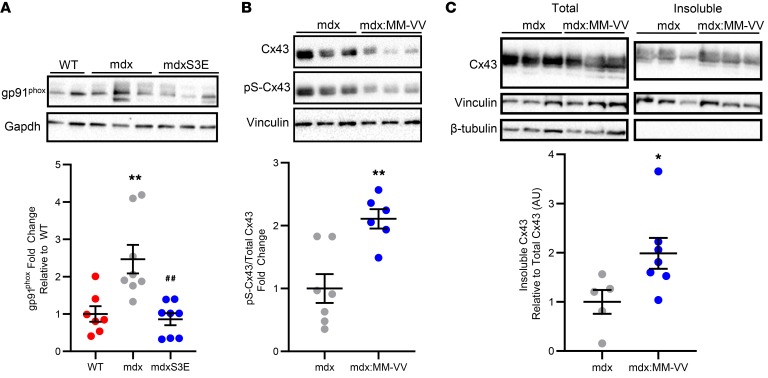
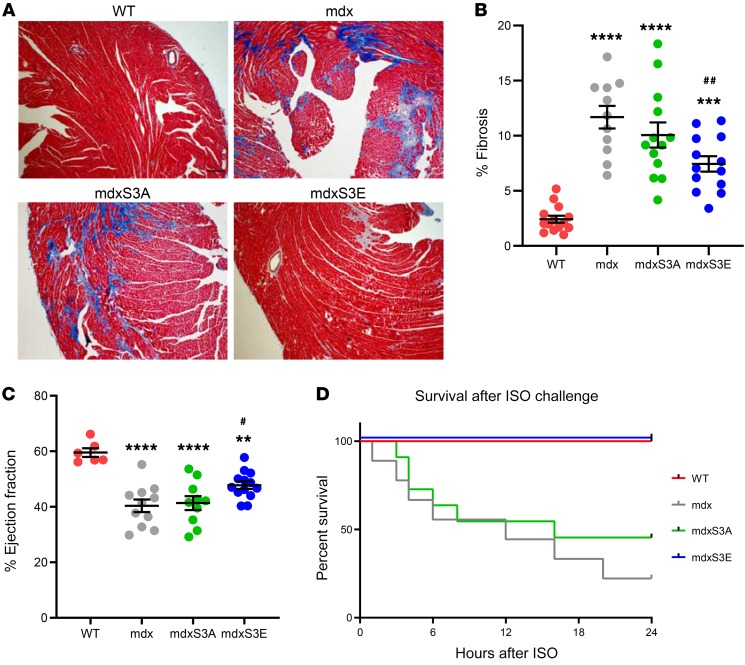
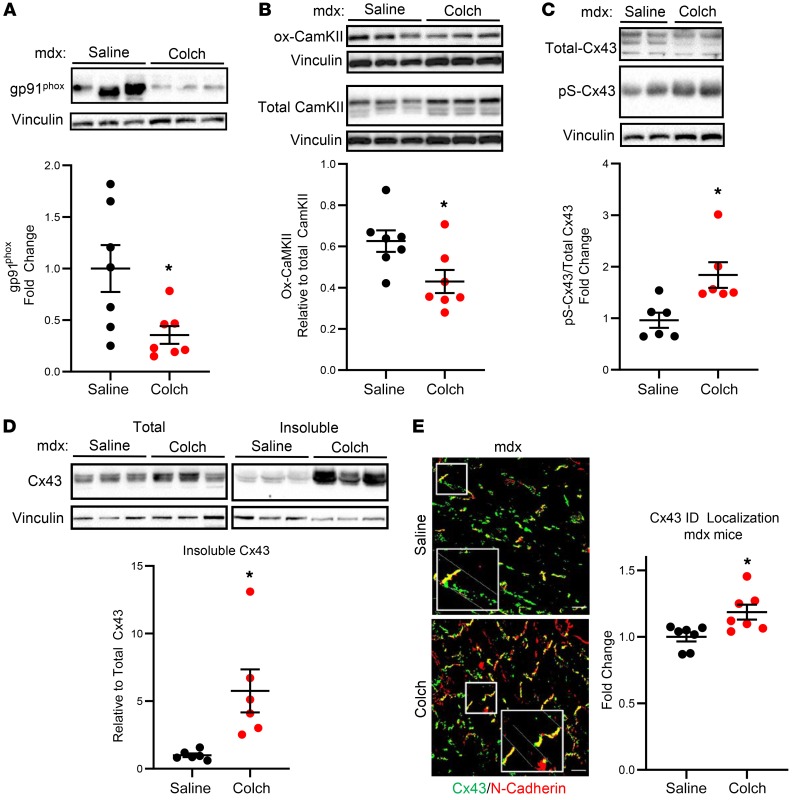
Aberrant expression of the cardiac gap junction protein connexin-43 (Cx43) has been suggested as playing a role in the development of cardiac disease in the mdx mouse model of Duchenne muscular dystrophy (DMD); however, a mechanistic understanding of this association is lacking. Here, we identified a reduction of phosphorylation of Cx43 serines S325/S328/S330 in human and mouse DMD hearts. We hypothesized that hypophosphorylation of Cx43 serine-triplet triggers pathological Cx43 redistribution to the lateral sides of cardiomyocytes (remodeling). Therefore, we generated knockin mdx mice in which the Cx43 serine-triplet was replaced with either phospho-mimicking glutamic acids (mdxS3E) or nonphosphorylatable alanines (mdxS3A). The mdxS3E, but not mdxS3A, mice were resistant to Cx43 remodeling, with a corresponding reduction of Cx43 hemichannel activity. MdxS3E cardiomyocytes displayed improved intracellular Ca2+ signaling and a reduction of NADPH oxidase 2 (NOX2)/ROS production. Furthermore, mdxS3E mice were protected against inducible arrhythmias, related lethality, and the development of cardiomyopathy. Inhibition of microtubule polymerization by colchicine reduced both NOX2/ROS and oxidized CaMKII, increased S325/S328/S330 phosphorylation, and prevented Cx43 remodeling in mdx hearts. Together, these results demonstrate a mechanism of dystrophic Cx43 remodeling and suggest that targeting Cx43 may be a therapeutic strategy for preventing heart dysfunction and arrhythmias in DMD patients.

Keywords: Cardiology; Cardiovascular disease; Cell Biology; Neuromuscular disease.


Conflict of interest statement

Conflict of interest: The authors have declared that no conflict of interest exists.

Figures

Figure 1
Figure 1. Phosphorylation of S325/S328/S330 in Cx43 is reduced in mouse and human dystrophic hearts.
(A) Representative Western blot and quantification of WT and mdx ventricular lysates probed for pan-Cx43 (top), pS-Cx43 (middle), and vinculin (loading control, bottom). n = 7 in both groups. ***P < 0.001 versus WT. Note the differential Cx43 migration patterns indicated by the phospho-isoforms P3, P2, P1, and P0 in WT and mdx lysates. WT and mdx samples shown were run on the same gel, but were noncontiguous, as indicated by black lines between samples. (B) Representative immunofluorescence images (magnified images are in insets) of pan-Cx43 (green) and N-cadherin (red) in 4-month-old WT and mdx ventricular cryosections. (C) Representative immunofluorescence images (magnified images are in insets) of pS-Cx43 (green) and N-cadherin (red) in 4-month-old WT and mdx ventricular cryosections. (D) Representative Western blot and quantification of human non-DMD and DMD ventricular lysates probed for pan-Cx43 (top), pS-Cx43 (middle), and vinculin (loading control, bottom). n = 3 in both groups. **P < 0.01 versus non-DMD. p, phosphorylated isoform; np, nonphosphorylated isoform. (E) Representative immunofluorescence images of magnified IDs stained for pan-Cx43 (green) and N-cadherin (red) in human non-DMD and DMD ventricular cryosections. (F) Representative immunofluorescence images of magnified IDs stained for pS-Cx43 (green) and N-cadherin (red) in human non-DMD and DMD ventricular cryosections. White arrows indicate Cx43 localization at the IDs; red arrows indicate lateralized Cx43. Data are presented as mean ± SEM. Statistical significance was determined by 2-sided t test. Scale bars: 20 μm (B and C), original magnification ×60; 5 μm (E and F).
Figure 2
Figure 2. Cx43 remodeling is prevented in mdxS3E hearts.
(A) Representative immunofluorescence images of mouse heart cryosections stained for pan-Cx43 (green) and visualized for WGA (lipid bilayer marker, red) or N-cadherin (ID marker, red). Scale bar: 25 μm. (B) Representative confocal immunofluorescence images of cardiac IDs and lateral regions of cardiomyocytes stained with pan-Cx43 (green) and N-cadherin (red). White arrows indicate costaining of Cx43 and N-cadherin; red arrows indicate lateralized Cx43. Scale bars: 5 μm. (C) Quantification of Cx43/N-cadherin colocalization in confocal immunofluorescence images. All data points were normalized to the WT group mean. n = 8 (WT); n = 10 (mdx); n = 9 (mdxS3A); n = 9 (mdxS3E). Three to five images containing 15-20 IDs were analyzed per heart. Each dot represents a mean value per mouse. (D) Representative Western blots (top) and quantification (bottom) of Cx43 from biotin-perfused hearts. Top Western blot row represents biotinylated Cx43 protein signals, middle row represents total Cx43, and bottom row represents Ponceau S staining for loading. Ponceau S stain was used for loading, since we cannot detect cytosolic loading controls through biotinylation. Quantification (bottom) of biotinylated Cx43 levels was expressed as fold change relative to total Cx43 protein levels per sample. Data were normalized to WT mean group value (n = 4 per group). Data are presented as mean ± SEM. ****P < 0.0001; *P < 0.05 versus WT; #P < 0.05 versus mdx. Statistical significance determined by 1-way ANOVA followed by Tukey’s post hoc test.
Figure 3
Figure 3. MdxS3E mice are protected against Iso-induced arrhythmias and aberrant Cx43 hemichannel opening.
(A) Top row: representative baseline ECG recordings obtained from 4- to 6-month-old mice following anesthesia. Bottom row: representative ECG traces recorded approximately 30 minutes after Iso (5 mg/kg, i.p.) challenge. Scale bars: 100 ms (for all traces). (B) Arrhythmia scores based on predetermined scale where 0 = no arrhythmias, 1 = single PVCs, 2 = double PVCs, 3 = triple PVCs or nonsustained VT, 4 = sustained VT or AV block, 5 = death. ****P < 0.0001 versus WT; ####P < 0.0001 versus mdx. n = 8 (WT); n = 9 (mdx, mdxS3A); n = 10 (mdxS3E). (C) Representative immunofluorescence images of ethidium uptake of heart cryosections after perfusion with ethidium (5 μm) under control conditions (top row) or after Iso treatment (middle row). Cryosections were visualized for ethidium (red) and stained for WGA (green) and nuclei (DAPI, blue). White boxes indicate areas magnified in the bottom row (insets). White arrows indicate nuclei that do not colocalize with ethidium; orange arrows indicate positive ethidium and nuclei colocalization. Scale bars: 20 μm. Original magnification ×20. (D) Quantification of the dye uptake under both control (circles) and Iso (triangles) conditions. **P < 0.005, ***P < 0.001 versus WT control; ###P < 0.001 versus mdx control; §§§§P < 0.0001 versus WT Iso; ††††P < 0.0001 versus mdx Iso; P < 0.05 versus control in each genotype (n = 4 each group per treatment). Data are presented as mean ± SEM. Statistical significance determined by 1-way ANOVA (B) or 2-way ANOVA (D) followed by Tukey’s post hoc test.
Figure 4
Figure 4. Normalization of intracellular Ca2+ response to hypo-osmotic shock and reduction of ROS production in mdxS3E cardiomyocytes.
(A) Representative images of mdx (top left) and mdxS3E (top right) cardiomyocytes imaged for intracellular Ca2+ indicator Fluo-4AM (green, top row) and transmitted light (BF, bottom row of top panel) at times in isotonic solution (0 seconds), at the end of hypo-osmotic shock (80 seconds), and after return to isotonic solution (120 seconds). Bottom left panel represents time course of normalized Fluo-4 fluorescence in WT (red), mdx (gray), and mdxS3E (blue) cells. Bottom right panel shows pooled data of mean values of normalized fluorescence during 60 seconds after the osmotic shock. n = 3 animals; n = 13 myocytes for all genotypes. (B) Representative images of DCF fluorescence in mdx (top left) and mdxS3E (top right) cardiomyocytes at the beginning (0 s) and end (120 s) of exposure. Bottom left graph illustrates changes in average DCF signals in WT (red), mdx (gray), and mdxS3E (blue) myocytes over 120 seconds. Bottom right graph illustrates the rate of oxidation × 1000. n = 4; n = 43 (WT); n = 4; n = 19 (mdx); n = 4; n = 30 (mdxS3E). Scale bars: 20 μm. ****P < 0.0001 versus WT; ####P < 0.0001 versus mdx (both analyses). Data are presented as mean ± SEM. Statistical significance determined by 1-way ANOVA followed by Tukey’s post hoc test.
Figure 5
Figure 5. CaMKII oxidation leads to Cx43 hypophosphorylation in mdx hearts.
(A) Representative Western blot (top) and quantification (bottom) for gp91phox (NOX2 catalytic subunit) in WT (red), mdx (gray), and mdxS3E (blue) ventricular lysates. Gapdh was used as a loading control. **P < 0.01 versus WT; ##P < 0.01 versus mdx. n = 7 (WT); n = 8 (mdx, mdxS3E). (B) Representative Western blot (top) and quantification (bottom) of total Cx43 (top blot), pS-Cx43 (middle blot), and vinculin (bottom blot, loading control) in mdx (gray) and mdx:MM-VV (blue) whole cell lysates. n = 6 for both genotypes. (C) Representative Western blots (left panels) and quantification (right) of Cx43 (top blots) from mdx (gray) and mdx:MM-VV (blue) heart tissue subject to Triton X-100–based tissue fractioning of insoluble (junctional, right blots) and total cell (total, left blots) lysates. Vinculin (middle blots) was used as a loading control for both fractions. β–Tubulin (bottom blots) was used as a negative control for insoluble fraction. Insoluble Cx43 protein levels were normalized to corresponding total Cx43 levels and then expressed as fold change relative to mdx mean value. n = 5 (mdx); n = 7 (mdx:MM-VV). *P < 0.05, **P < 0.01 versus mdx (B and C). Data are presented as mean ± SEM. Statistical significance determined by 1-way ANOVA followed by Tukey’s post hoc test (A) and 2-sided t test (B and C).
Figure 6
Figure 6. MdxS3E mice display long-term protection against DMD cardiomyopathy.
(A) Representative images of Masson-trichrome staining on hearts of 14- to 18-month-old WT, mdx, mdxS3A, and mdxS3E mice. Red stain indicates muscle cytoplasm; blue indicates collagen deposition (fibrosis). Scale bar: 200 μm. (B) Quantification of fibrosis expressed as percentage of fibrotic area over total muscle area. n = 14 (WT); n = 11 (mdx); n = 13 (mdxS3A); n = 13 (mdxS3E); 3–5 slices were analyzed per mouse. Each data point represents a mean value per mouse. (C) Left ventricular ejection fraction values for 14- to 18-month-old mice. n = 6 (WT); n = 11 (mdx); n = 10 (mdxS3A); n = 13 (mdxS3E). Each data point represents mean ejection fraction per mouse. (D) Kaplan-Meier survival curve for 14- to 18-month-old mice followed for 24 hours after Iso (5 mg/kg, i.p.) challenge. n = 6 (WT); n = 9 (mdx); n = 11 (mdxS3A); n = 10 (mdxS3E). ****P < 0.001, ***P < 0.005, **P < 0.01 versus WT; ##P < 0.01, #P < 0.05 versus mdx. Data are presented as mean ± SEM. Statistical significance determined by 1-way ANOVA followed by Tukey’s post hoc test (B and C).
Figure 7
Figure 7. The dystrophic MT cytoskeleton contributes to Cx43 phosphorylation and localization.
(A) Representative Western blot (top) and quantification (bottom) for gp91phox in mdx mice treated with either saline or colch. Vinculin was used as a loading control for this and all proceeding blots. (B) Representative Western blots (top) of ox-CaMKII, (top blot), total CaMKII (bottom blots), and vinculin in mdx mice treated with either saline or colch. Ox-CaMKII protein levels were normalized to corresponding total CaMKII levels (both controlled for loading) and quantified (bottom). (C) Representative Western blots (top) for total-Cx43 (top), pS-Cx43 (middle), and vinculin (bottom) in mdx mice treated with either saline or colch. pS-Cx43 protein levels were normalized to corresponding total Cx43 levels (both controlled for loading) and quantified (bottom). (D) Representative Western blots of Cx43 and vinculin (top) from saline- or colch-treated mdx heart tissue subject to Triton X-100 based tissue fractioning. Insoluble Cx43 protein levels were normalized to corresponding total Cx43 levels (both controlled for loading) and then expressed as fold change relative to mdx saline mean value. (E) Left: representative confocal immunofluorescence images of mdx saline (top) and colch (bottom) cardiac IDs and lateral regions of cardiomyocytes stained with pan-Cx43 (green) and N-cadherin (red). Scale bar: 25 μm. White boxes indicate areas magnified in the image; original magnification ×60. Right: quantification of Cx43/N-cadherin colocalization in confocal immunofluorescence images as described for Figure 2, expressed as fold change relative to mdx saline mean value. n = 7 per treatment (A and E); n = 6 per treatment (BD). *P < 0.05 versus mdx-saline. Data are presented as mean ± SEM. Statistical significance determined by 2-sided t test (all analyses).

Comment in

References

    1. Bushby K, et al. Diagnosis and management of Duchenne muscular dystrophy, part 1: diagnosis, and pharmacological and psychosocial management. Lancet Neurol. 2010;9(1):77–93. doi: 10.1016/S1474-4422(09)70271-6. - DOI - PubMed
    1. Kamdar F, Garry DJ. Dystrophin-deficient cardiomyopathy. J Am Coll Cardiol. 2016;67(21):2533–2546. doi: 10.1016/j.jacc.2016.02.081. - DOI - PubMed
    1. Hoffman EP, Brown RH, Kunkel LM. Dystrophin: the protein product of the Duchenne muscular dystrophy locus. Cell. 1987;51(6):919–928. doi: 10.1016/0092-8674(87)90579-4. - DOI - PubMed
    1. Lapidos KA, Kakkar R, McNally EM. The dystrophin glycoprotein complex: signaling strength and integrity for the sarcolemma. Circ Res. 2004;94(8):1023–1031. doi: 10.1161/01.RES.0000126574.61061.25. - DOI - PubMed
    1. Le Guiner C, et al. Long-term microdystrophin gene therapy is effective in a canine model of Duchenne muscular dystrophy. Nat Commun. 2017;8:16105. - PMC - PubMed

Publication types

MeSH terms