. 2020 Mar;10(3):422-439.
doi: 10.1158/2159-8290.CD-19-0958. Epub 2020 Jan 7.

Regulatory T-cell Depletion Alters the Tumor Microenvironment and Accelerates Pancreatic Carcinogenesis

Affiliations

Regulatory T-cell Depletion Alters the Tumor Microenvironment and Accelerates Pancreatic Carcinogenesis

Yaqing Zhang et al. Cancer Discov. 2020 Mar.

Abstract

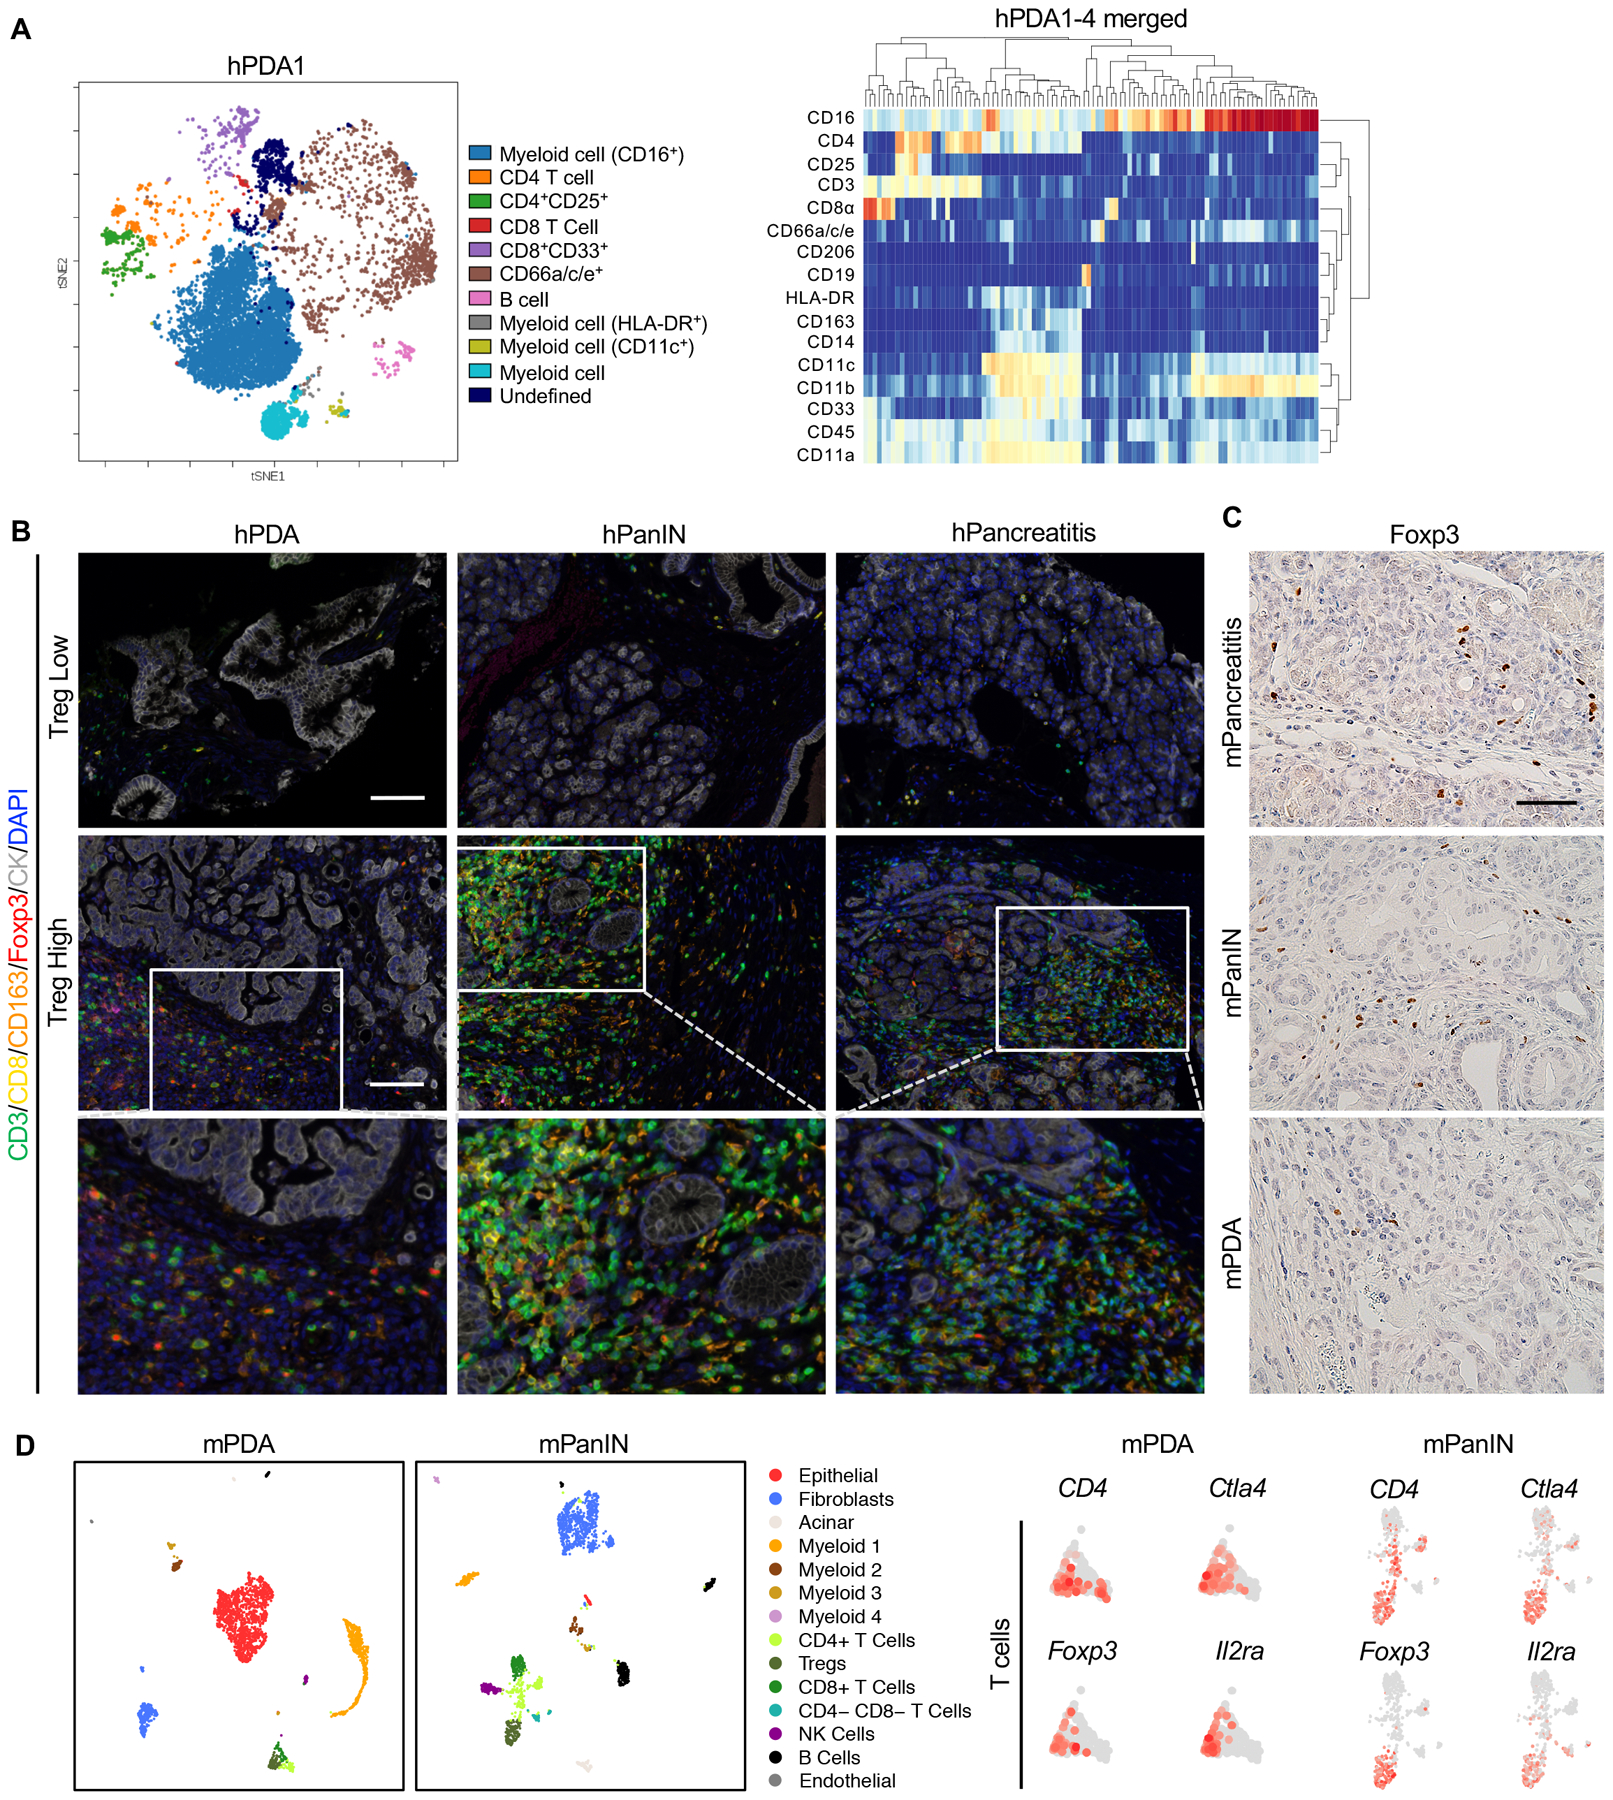
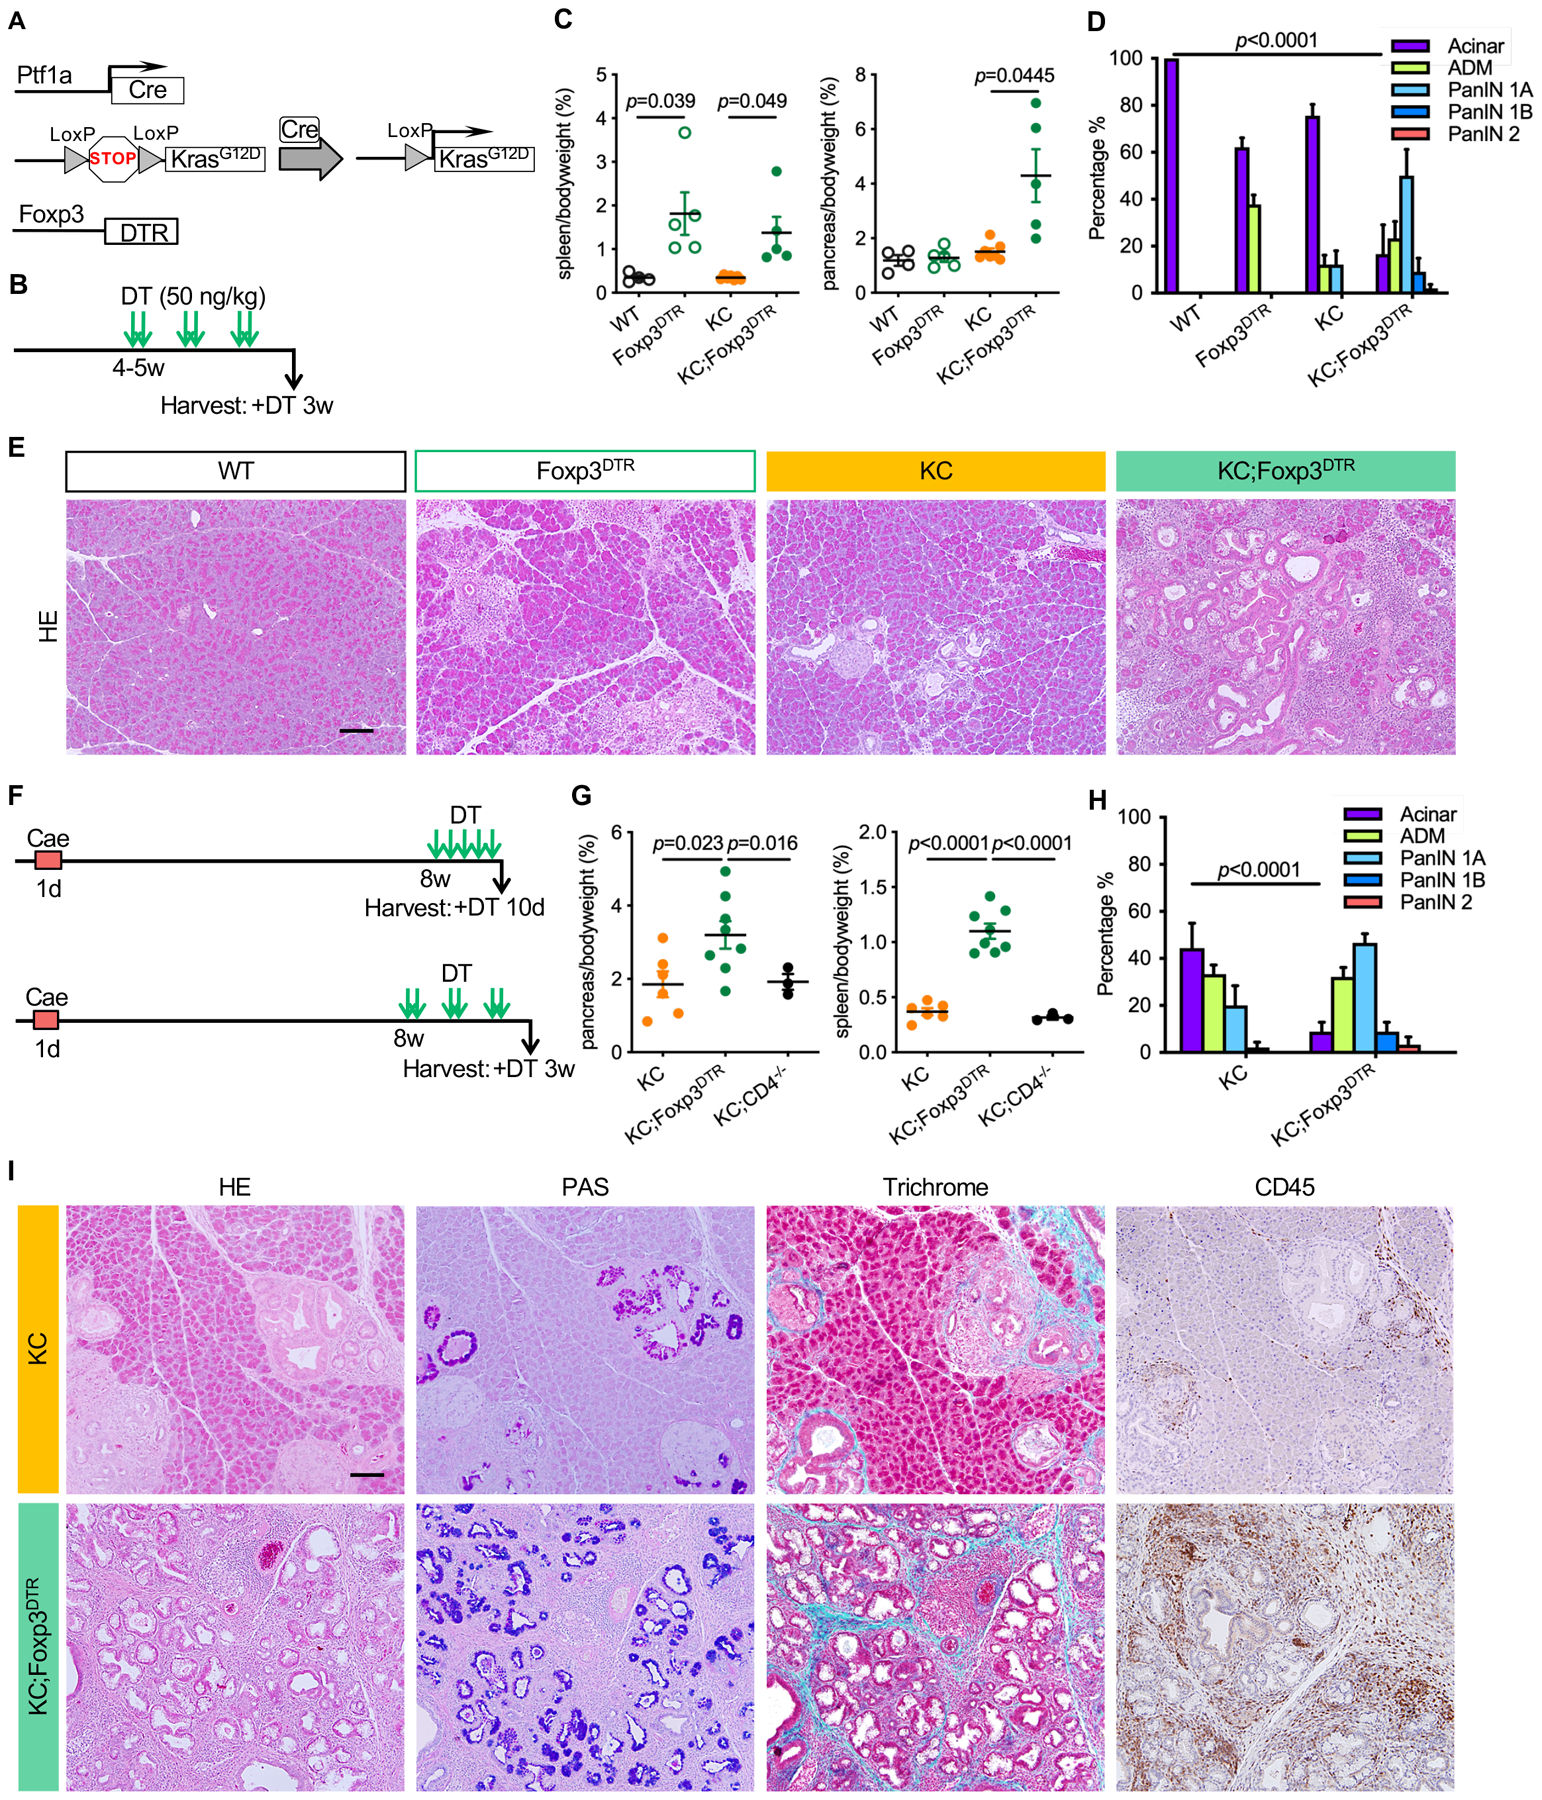
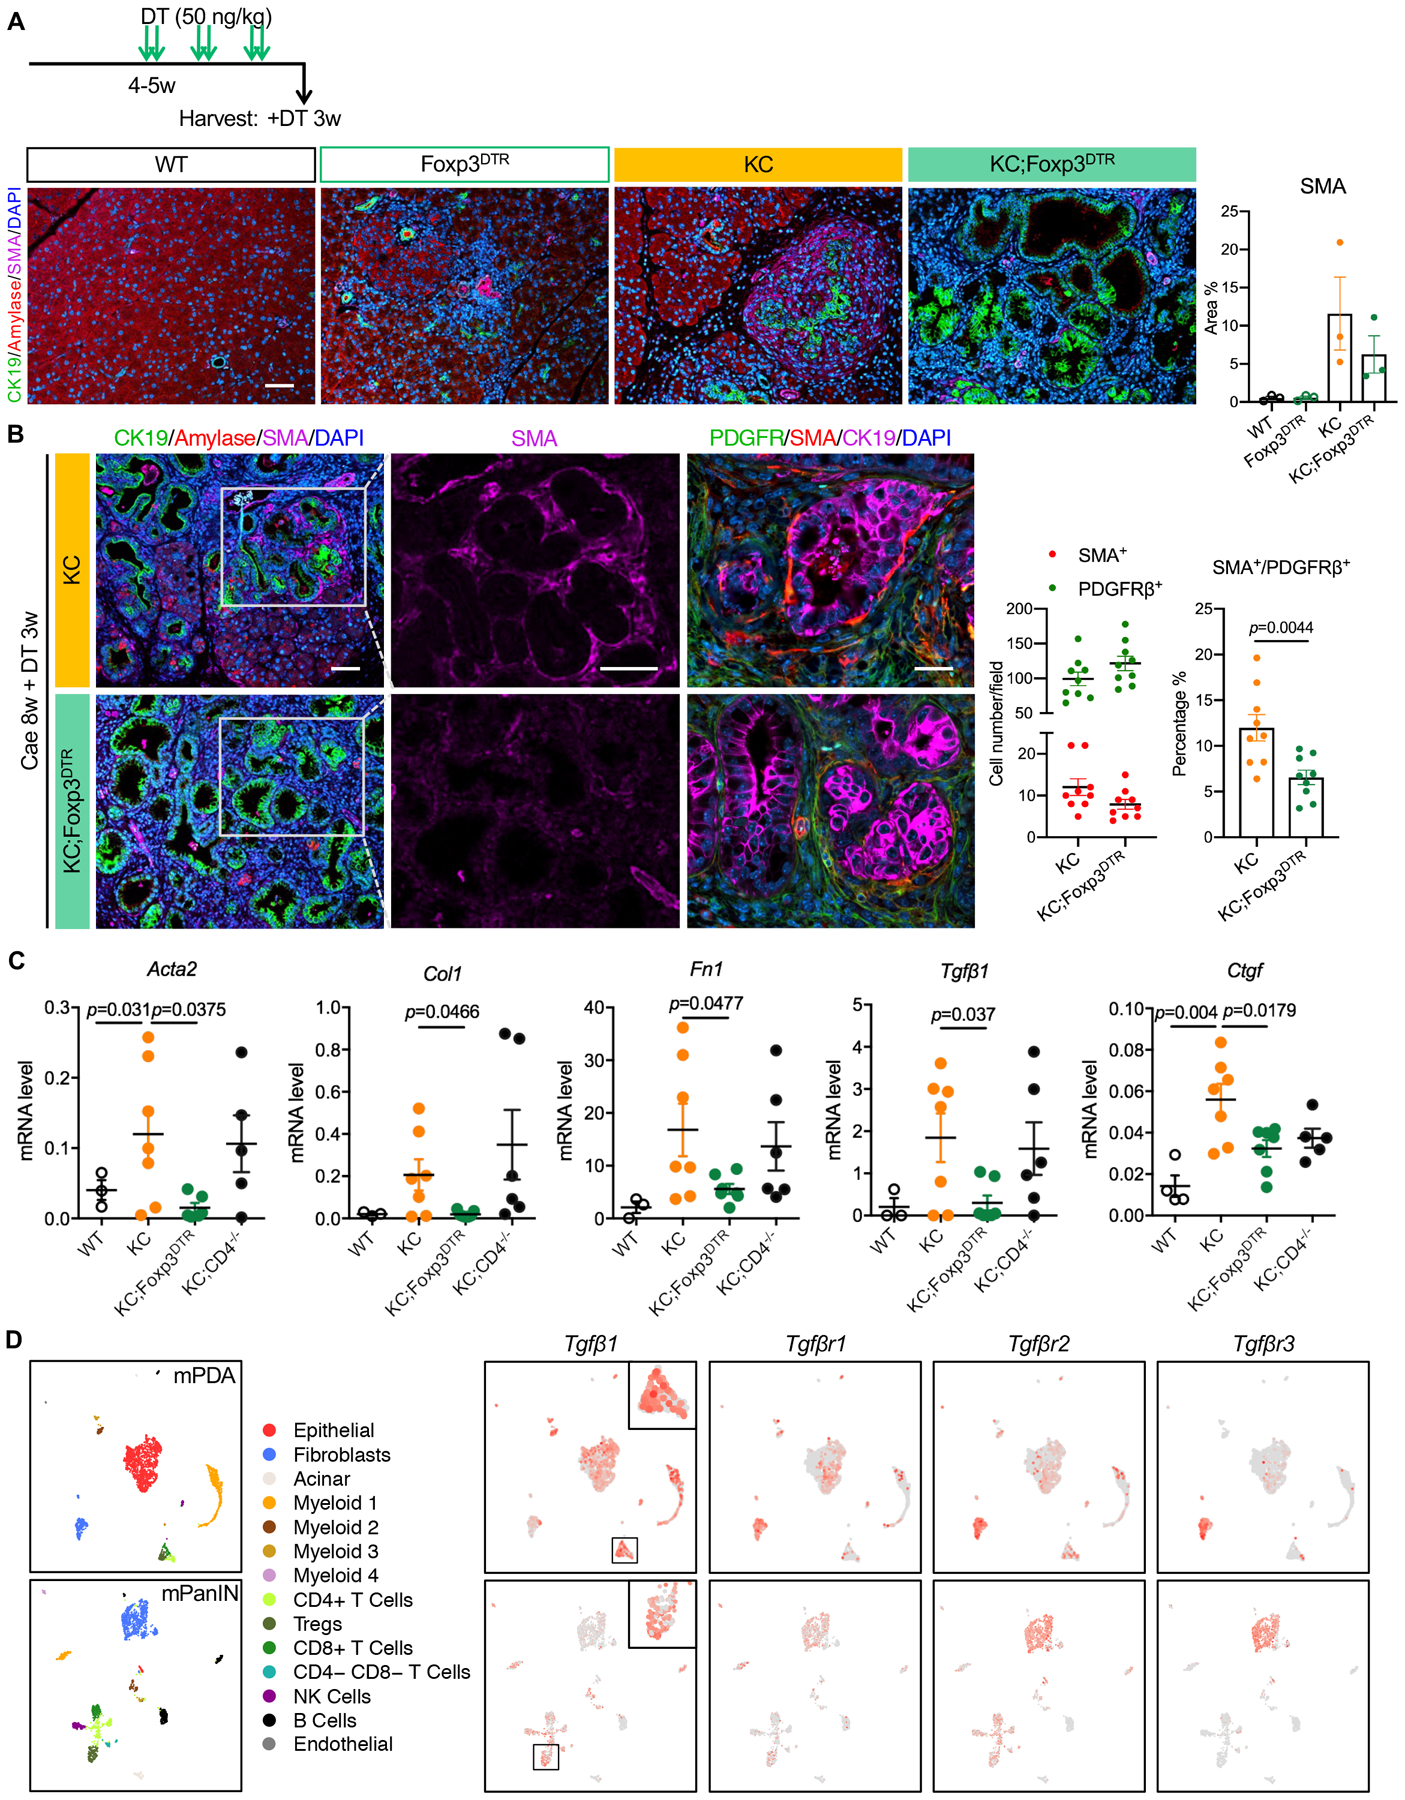
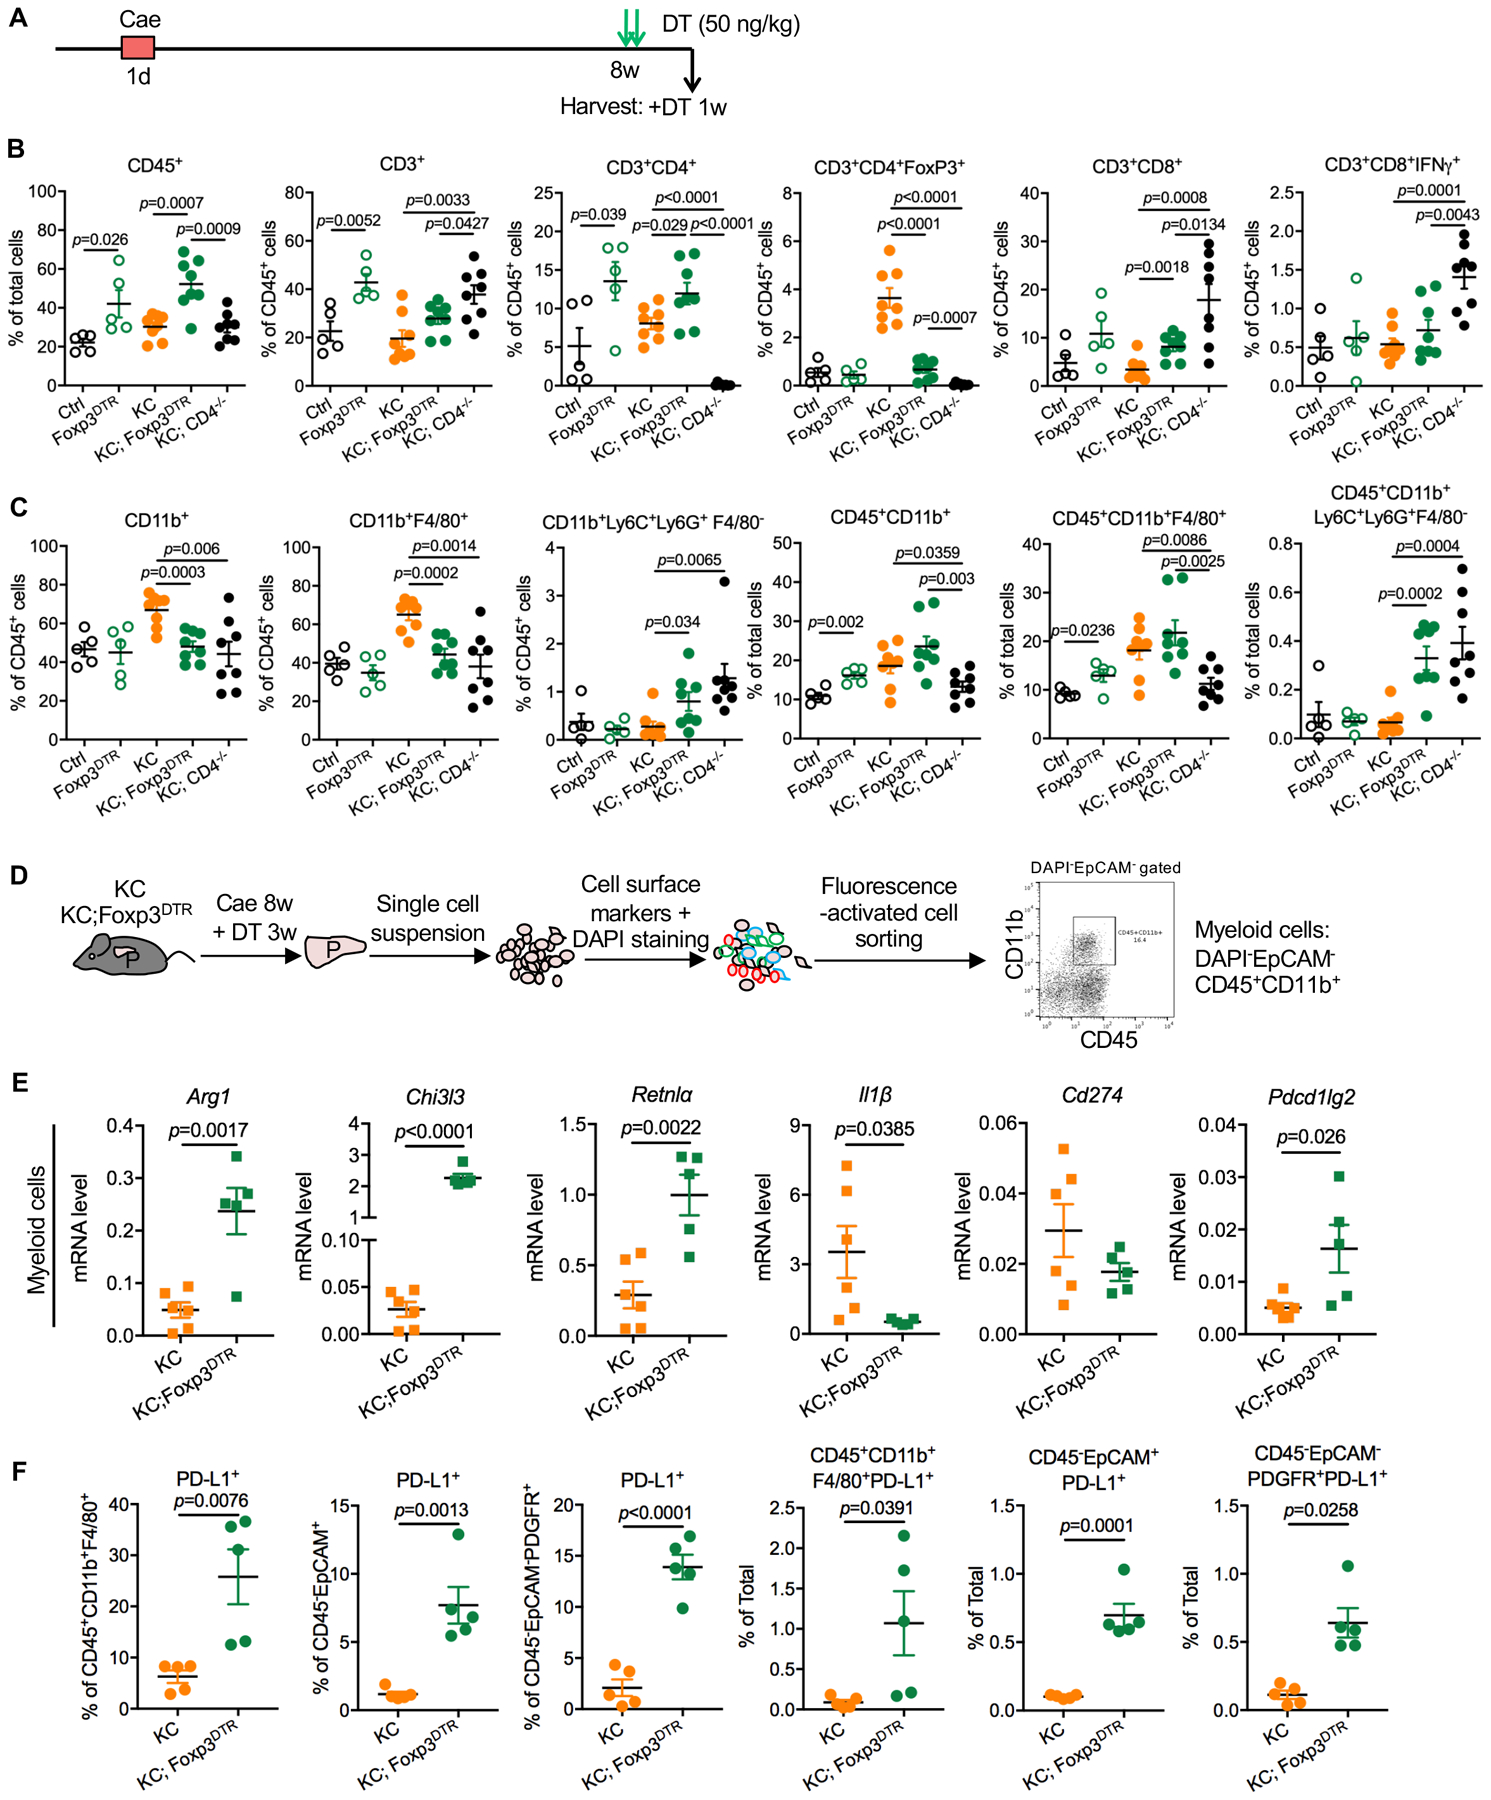
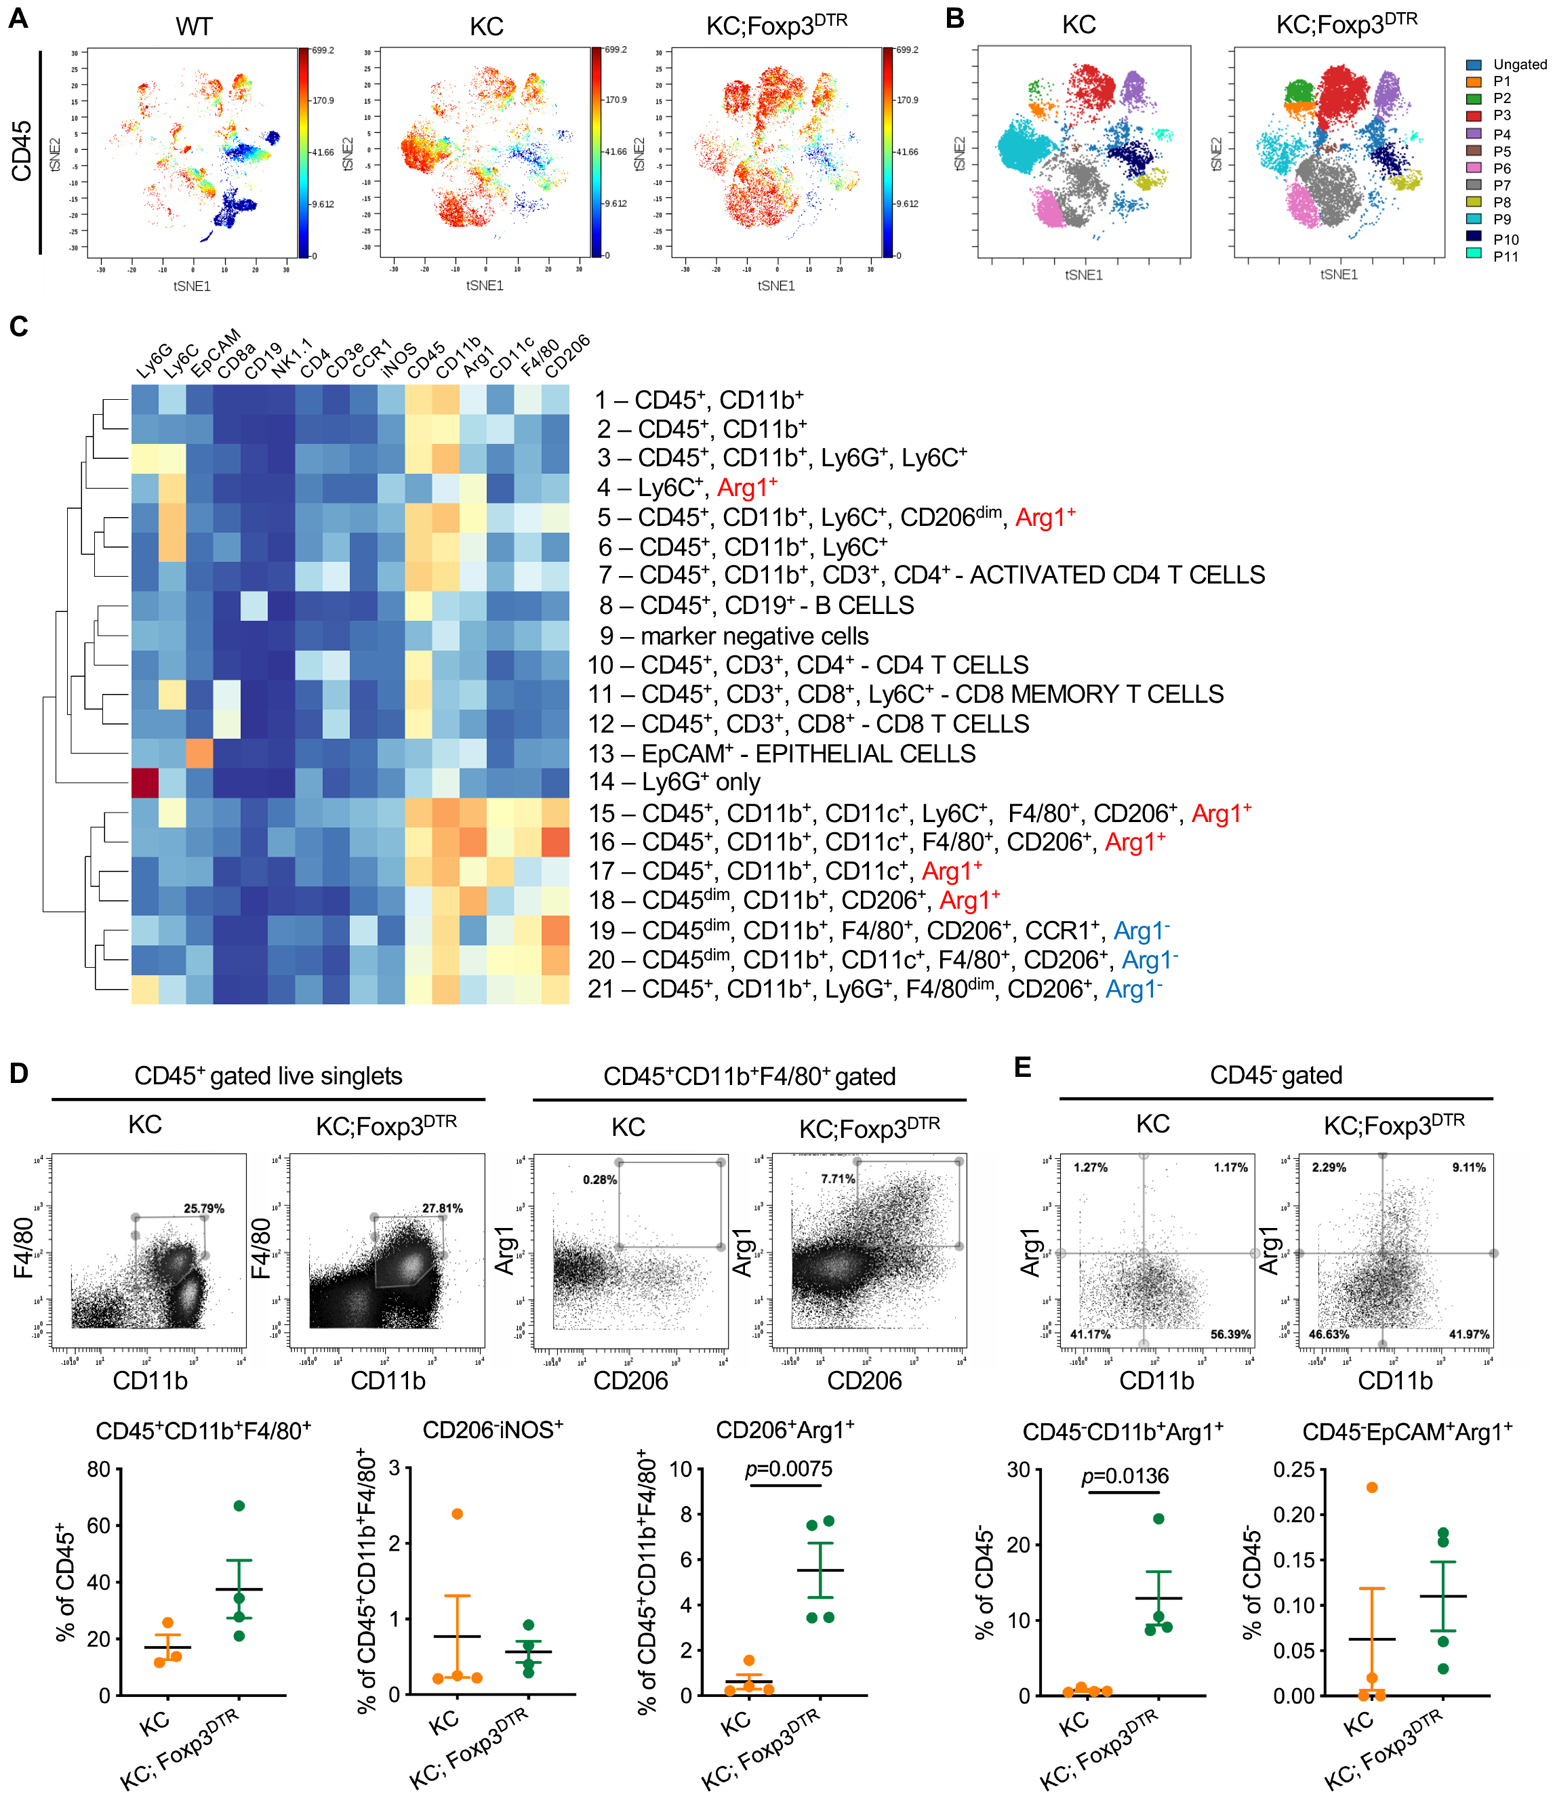
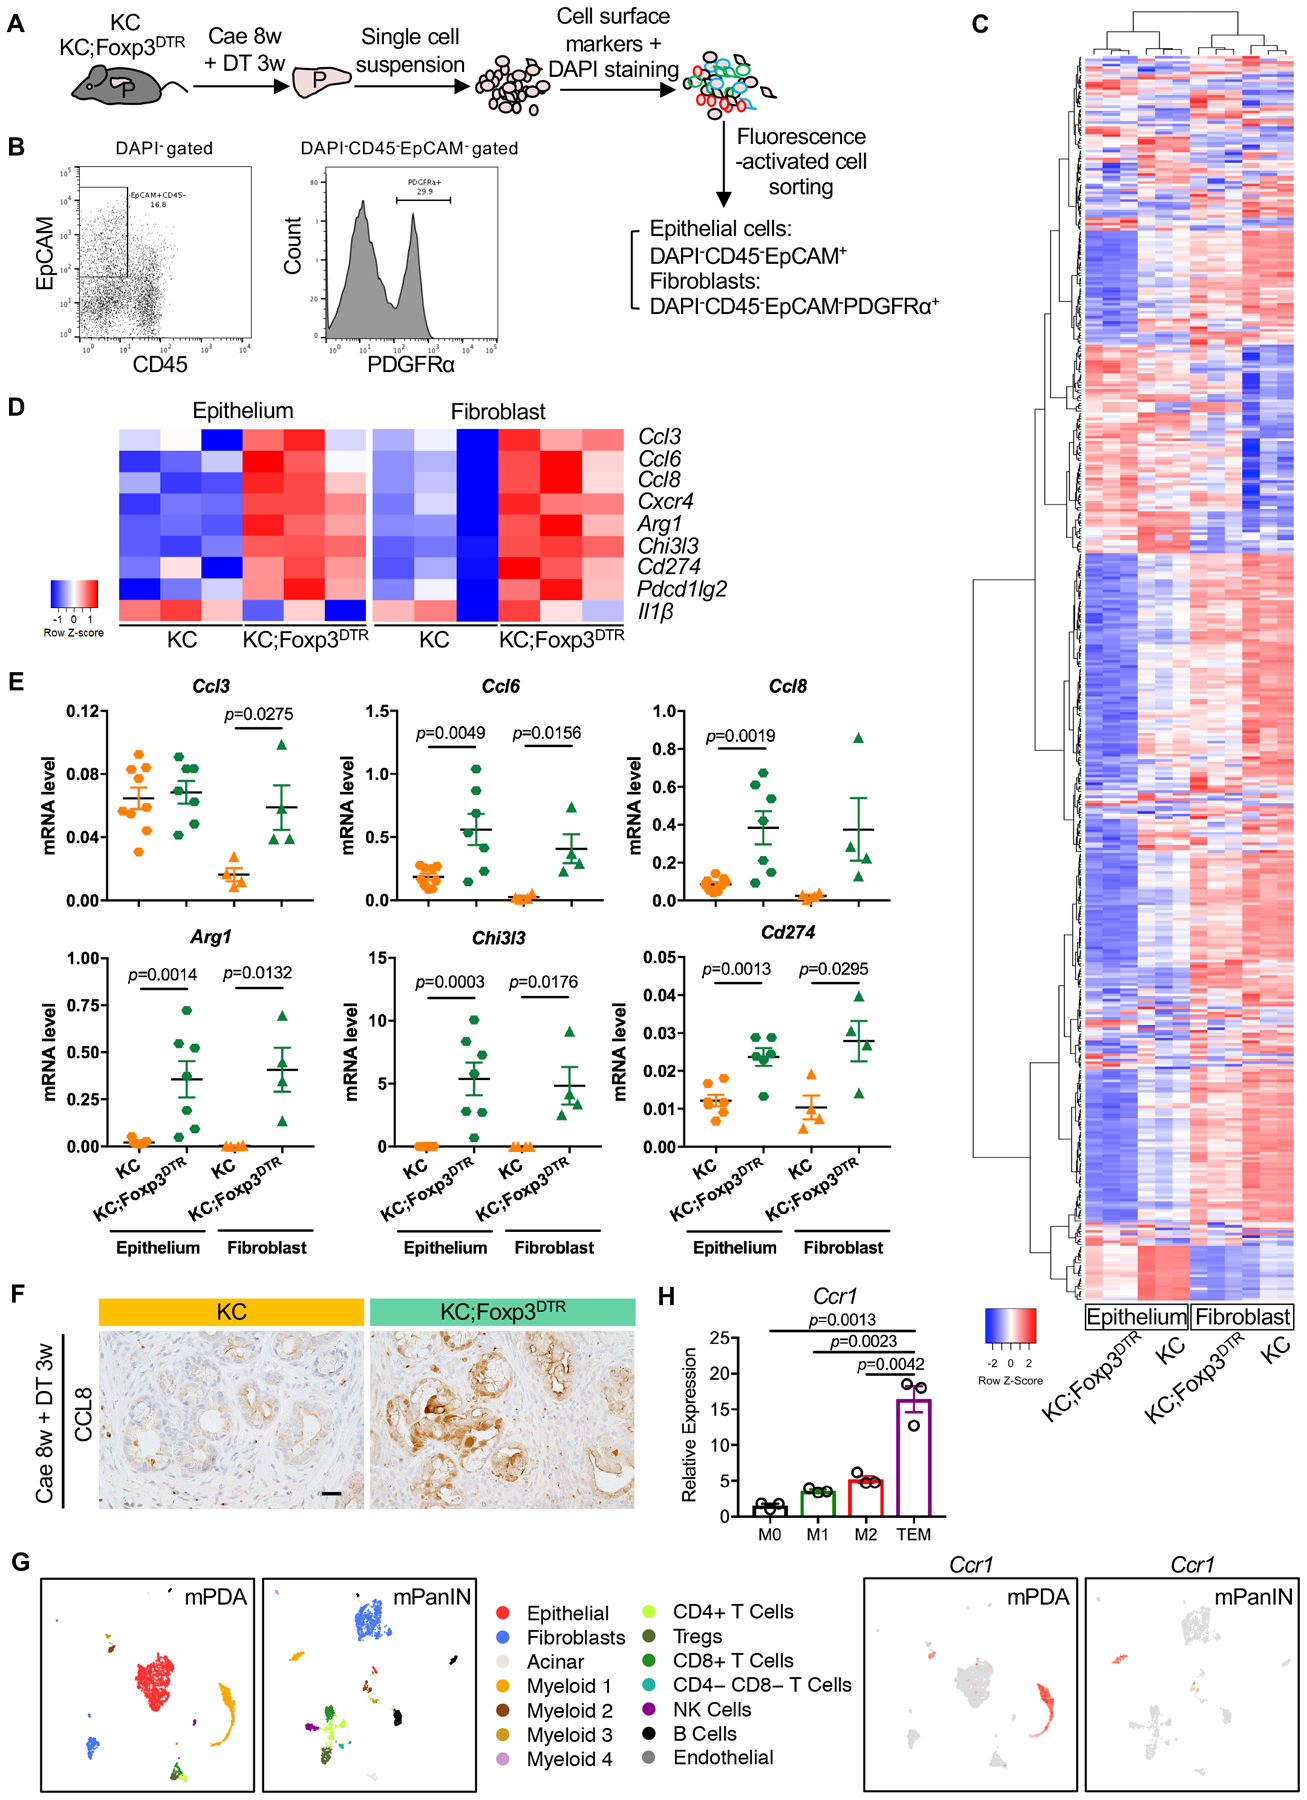
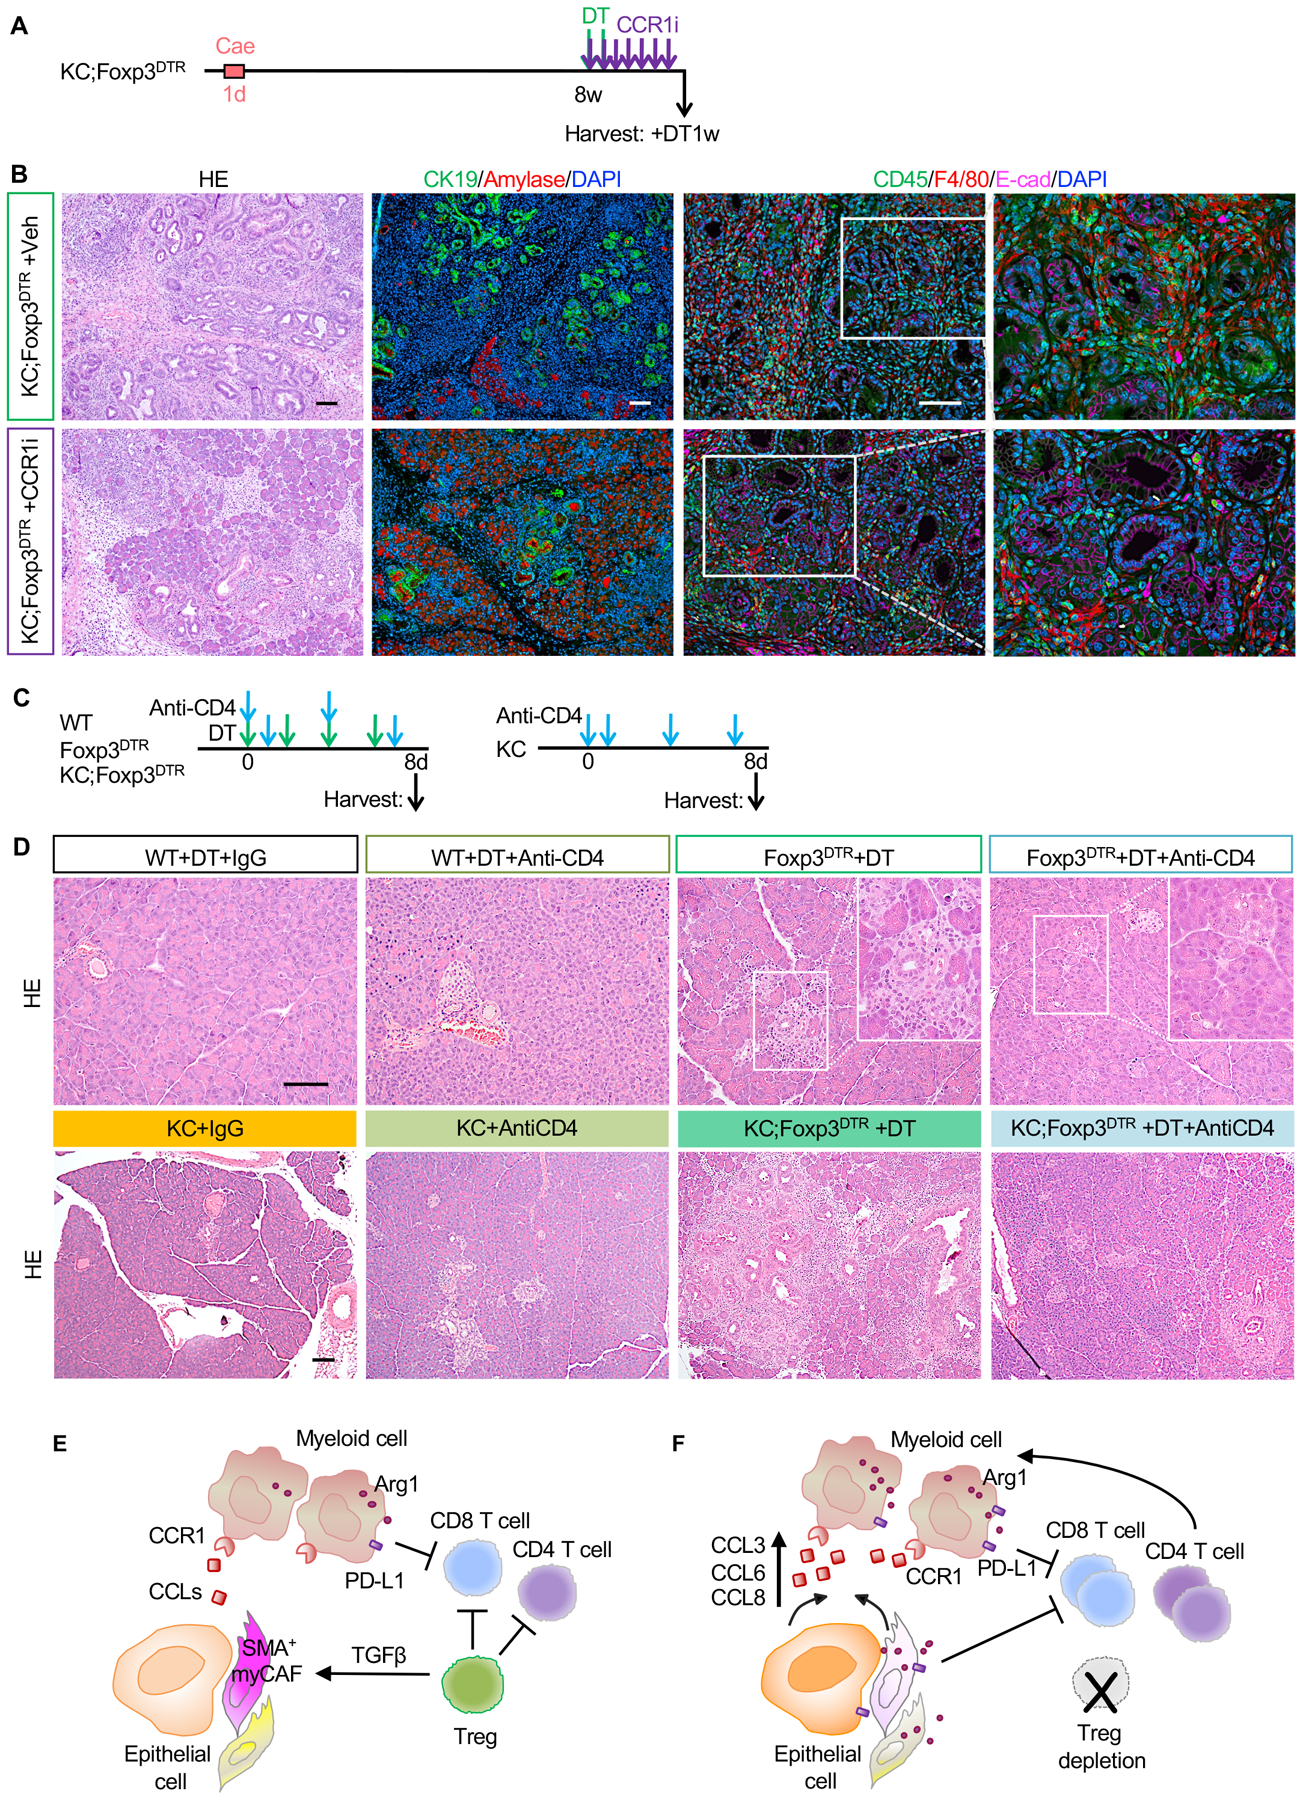
Regulatory T cells (Treg) are abundant in human and mouse pancreatic cancer. To understand the contribution to the immunosuppressive microenvironment, we depleted Tregs in a mouse model of pancreatic cancer. Contrary to our expectations, Treg depletion failed to relieve immunosuppression and led to accelerated tumor progression. We show that Tregs are a key source of TGFβ ligands and, accordingly, their depletion reprogramed the fibroblast population, with loss of tumor-restraining, smooth muscle actin-expressing fibroblasts. Conversely, we observed an increase in chemokines Ccl3, Ccl6, and Ccl8 leading to increased myeloid cell recruitment, restoration of immune suppression, and promotion of carcinogenesis, an effect that was inhibited by blockade of the common CCL3/6/8 receptor CCR1. Further, Treg depletion unleashed pathologic CD4+ T-cell responses. Our data point to new mechanisms regulating fibroblast differentiation in pancreatic cancer and support the notion that fibroblasts are a heterogeneous population with different and opposing functions in pancreatic carcinogenesis. SIGNIFICANCE: Here, we describe an unexpected cross-talk between Tregs and fibroblasts in pancreatic cancer. Treg depletion resulted in differentiation of inflammatory fibroblast subsets, in turn driving infiltration of myeloid cells through CCR1, thus uncovering a potentially new therapeutic approach to relieve immunosuppression in pancreatic cancer.See related commentary by Aykut et al., p. 345.This article is highlighted in the In This Issue feature, p. 327.


Conflict of interest statement

Competing interests: The authors declare no competing interests.

Figures

Figure 1.
Figure 1.. Regulatory T cells are prevalent in human PDA and PanINs.
(A) CyTOF immune profiling by FlowSOM-viSNE of human pancreatic tumors demonstrating the presence of CD4+CD25+ Tregs. (B) Representative images of Opal staining on human pancreatic lesion samples. Scale bar 100 μm. (C) Immunohistochemistry staining for Foxp3 staining in mouse pancreatic tissues. Scale bar 50 μm. (D) UMAP plots of single cell RNA sequencing analysis with mouse orthotopic pancreatic cancer samples or PanIN lesions, color-coded by their associated cluster (left) or color-coded for expression (gray to red) of Cd4, Ctla4, Foxp3 and Il2ra.
Figure 2.
Figure 2.. Treg depletion results in pancreatitis and promotes PanIN formation and progression.
(A) Genetic makeup of the KC;Foxp3DTR mouse model. (B) Experimental design, n=4–7mice/cohort. (C) Pancreas to body weight ratio and spleen to body weight ratio of WT, Foxp3DTR, KC and KC;Foxp3DTR mice after 3 weeks of DT treatment. Data represent mean ± SEM, n=4–7mice/cohort. The statistical difference was determined by two-tailed t-tests. (D) Histopathologic quantification of WT, Foxp3DTR, KC and KC;Foxp3DTR mice after 3 weeks of DT treatment. Data represent mean ± SEM, n = 3–4 mice/cohort. The statistical difference was determined by two-way ANOVA. (E) H&E staining of WT, Foxp3DTR, KC and KC;Foxp3DTR pancreata after 3 weeks of DT treatment. Scale bar 100 μm. (F) Experimental design, n=3–8 mice/cohort. (G) Pancreas to body weight ratio and spleen to body weight ratio of KC, KC;Foxp3DTR and KC;CD4−/− mice that received 3 weeks of DT treatment starting 8 weeks post caerulein. Data represent mean ± SEM, n=3–8 mice/cohort. The statistical difference was determined by two-tailed t-tests. (H) Histopathologic quantification of KC and KC;Foxp3DTR mice received 3 weeks of DT treatment starting 8 weeks post caerulein.. Data represent mean ± SEM, n=3–4mice/cohort. The statistical difference was determined by two-way ANOVA. (I) H&E staining, Periodic acid–Schiff (PAS) staining, Gomori trichrome staining and immunohistochemistry staining for CD45 in KC and KC;Foxp3DTR mice that received 3 weeks of DT treatment starting 8 weeks post caerulein. Scale bar 100 μm.
Figure 3.
Figure 3.. Treg depletion inactivates stromal fibroblasts.
(A) Experimental design (n=4–7 mice/cohort) and co-immunofluorescent staining for CK19 (green), Amylase (red), SMA (magenta) and DAPI (blue) in WT, Foxp3DTR, KC and KC;Foxp3DTR pancreata after 3 weeks of DT treatment. Scale bar 100 μm. Quantification of SMA positive area is shown on the right. Data represent mean ± SEM, n=3 slides/cohort. (B) co-immunofluorescent staining for CK19 (green), Amylase (red), SMA (magenta) and DAPI (blue). Scale bar 100 μm. Quantification of SMA and PDGFRβ positive cells is shown on the right. Data represent mean ± SEM, n=9 images/cohort. The statistical difference was determined by two-tailed t-tests. (C) qRT-PCR for α-SMA (Acta2), Col1, Fn1, Tgfβ1 and Ctgf expression in WT control, KC, KC;Foxp3DTR and KC;CD4−/− pancreata. Mice received DT treatment following 8 weeks post caerulein. Data represent mean ± SEM, n = 3–7 mice/cohort. The statistical difference was determined by two-tailed t-tests. (D) UMAP plots of single cell RNA sequencing analysis with mouse orthotopic pancreatic cancer samples or PanIN lesions, color-coded by their associated cluster (left) or color-coded for expression (gray to red) of Tgfβ1, Tgfβr1, Tgfβr2 and Tgfβr3.
Figure 4.
Figure 4.. Characterization of pancreatic immune infiltrates.
(A) Experimental design, n=4–8 mice/cohort. (B) WT, Foxp3DTR, KC, KC;Foxp3DTR and KC;CD4−/− mice received 1 week DT treatment following 8 weeks post pancreatitis induction. CD45+ leukocytes, CD3+ T cells, CD3+CD4+ T cells, CD3+CD4+FoxP3+ Tregs, CD3+CD8+ T cells, CD3+CD8+IFNγ+ T cells and (C) CD11b+ myeloid cells, CD11b+F4/80+ macrophages and CD11b+Ly6C+Ly6G+F4/80 MDSCs from pancreata were measured by flow cytometry as percentage of total cells or percentage of total leukocytes. Data represent mean ± SEM, the statistical difference between experimental groups was determined by two-tailed t-tests. (D) Schematic illustration of pancreatic infiltrating myeloid cells extraction by fluorescence-activated cell sorting and a representative flow cytometry plot showing the gating strategy. (E) qRT-PCR for Arg1, Chi3l3, Retnl⍺, Il1β, Cd274 and Pdcd1lg2 expression in pancreatic myeloid cells derived from KC and KC;Foxp3DTR mice that received 3-week DT treatment following 8 weeks post caerulein. Data represent mean±SEM, n=5–6. The statistical difference was determined by two-tailed t-tests. (F) The percentage of PD-L1 expressing macrophages, epithelial cells and fibroblasts in KC and KC;Foxp3DTR pancreata were measured by flow cytometry. Data represent mean±SEM, n=5. The statistical difference was determined by two-tailed t-tests.
Figure 5.
Figure 5.. Tumor associated macrophages exhibit high immunosuppressive capacity upon Treg depletion.
(A) Representative viSNE plots (dot plots colored by CD45 channel) of WT, KC and KC;Foxp3DTR pancreata that received 1-week DT treatment following 8 weeks post caerulein. (B) Immune cell populations identified by manual gating in viSNE maps, and (C) by supervised clustering of SPADE-identified subpopulations. (D) Top: representative CyTOF dot plots showing gating strategy defining tumor associated macrophages and CD206+Arg1+ M2-like macrophage subset. Bottom: quantification of the total macrophage and CD206iNOS+ M1-like and CD206+Arg1+ M2-like macrophage subsets. (E) Representative CyTOF dot plots showing gating strategy defining CD11b+Arg1+ non-immune cell population, and quantification of the Arg1+ non-immune cell populations. Data represent mean±SEM, n=3–4. The statistical difference between KC and KC;Foxp3DTR pancreata was determined by two-tailed t-tests.
Figure 6.
Figure 6.. Gene expression profiling for pancreatic epithelial cells and fibroblasts upon Treg depletion.
(A) Schematic illustration of pancreatic epithelial cells and fibroblasts extraction by fluorescence-activated cell sorting. (B) Representative flow cytometry plots showing gating strategy to identify epithelial cells and fibroblasts. (C) Heat map showing differentially expressed secretome genes and (D) Top differentially expressed secretome genes in epithelial cells or fibroblasts between KC and KC;Foxp3DTR pancreata. (E) qRT-PCR for Ccl3, Ccl6, Ccl8, Arg1, Chi3l3 and Cd274 expression in pancreatic epithelial cells or fibroblasts derived from KC and KC;Foxp3DTR mice that received 3 weeks of DT treatment following 8 weeks post caerulein. Data represent mean ± SEM, n=4–9. (F) Immunohistochemistry staining for CCL8 in KC and KC;Foxp3DTR pancreata. Scale bar 50 μm. (G) UMAP plots of single cell RNA sequencing analysis with mouse orthotopic pancreatic cancer samples or PanIN lesions, color-coded by their associated cluster (left) or color-coded for expression (gray to red) of Ccr1. (H) qRT-PCR for Ccr1 expression in bone marrow derived macrophages under different polarization status. Data represent mean ± SEM, n=3. The statistical difference was determined by two-tailed t-tests.
Figure 7.
Figure 7.. CCR1 inhibition and CD4+ T cell depletion abrogate Treg depletion induced PanIN progression.
(A) Experimental design, n=5–6 mice/cohort. (B) H&E staining, co-immunofluorescent staining for CK19 (green), Amylase (red) and DAPI (blue), and co-immunofluorescent staining for CD45 (green), F4/80 (red), E-cad (magenta) and DAPI (blue) in control and CCR1 inhibitor treated KC;Foxp3DTR pancreata. Scale bar 100 μm. (C) Experimental design and (D) H&E staining for WT, Foxp3DTR, KC and KC;Foxp3DTR mice that received DT treatment and/or anti-CD4 antibody. n=3–4 mice/cohort. Scale bar 100 μm. (E) Working model. Tregs inhibit CD8+ T cells, but also restrain pathogenic CD4+ T cell responses. Tregs regulate the production of TGFβ thus promoting the differentiation of Smooth Muscle Actin (SMA)+ fibroblasts (myCAFs). (F) Treg depletion results in loss of TGFβ and compensatory changes in the fibroblast population that in turn secrete myeloid-recruiting chemokines, driving increased recruitment of myeloid cells and failing to alleviate immunosuppression. Treg depletion also unleashes pathogenic CD4+ T cell responses that promote pancreatic inflammation and carcinogenesis.

Comment in

References

    1. Siegel RL, Miller KD, Jemal A. Cancer statistics, 2018. CA Cancer J Clin 2018;68(1):7–30 doi 10.3322/caac.21442. - DOI - PubMed
    1. Vonderheide RH. The Immune Revolution: A Case for Priming, Not Checkpoint. Cancer Cell 2018;33(4):563–9 doi 10.1016/j.ccell.2018.03.008. - DOI - PMC - PubMed
    1. Brahmer JR, Tykodi SS, Chow LQ, Hwu WJ, Topalian SL, Hwu P, et al. Safety and activity of anti-PD-L1 antibody in patients with advanced cancer. N Engl J Med 2012;366(26):2455–65 doi 10.1056/NEJMoa1200694. - DOI - PMC - PubMed
    1. Hezel AF, Kimmelman AC, Stanger BZ, Bardeesy N, Depinho RA. Genetics and biology of pancreatic ductal adenocarcinoma. Genes Dev 2006;20(10):1218–49 doi 10.1101/gad.1415606. - DOI - PubMed
    1. Ying H, Dey P, Yao W, Kimmelman AC, Draetta GF, Maitra A, et al. Genetics and biology of pancreatic ductal adenocarcinoma. Genes Dev 2016;30(4):355–85 doi 10.1101/gad.275776.115. - DOI - PMC - PubMed

Publication types

MeSH terms