

Progressive Microbial Community Networks with Incremental Organic Loading Rates Underlie Higher Anaerobic Digestion Performance
- PMID: 31911462
- PMCID: PMC6946792
- DOI: 10.1128/mSystems.00357-19
Progressive Microbial Community Networks with Incremental Organic Loading Rates Underlie Higher Anaerobic Digestion Performance
Abstract
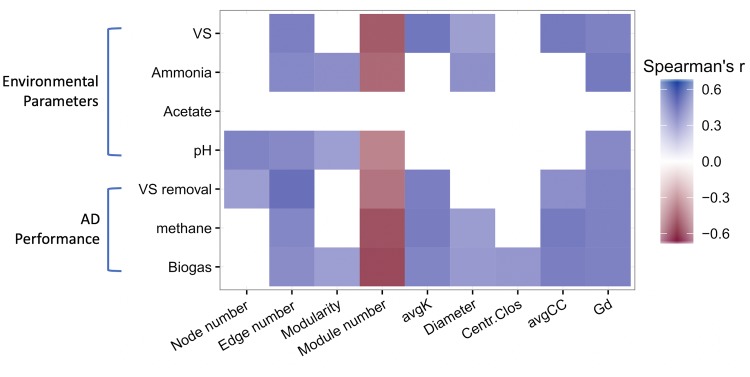
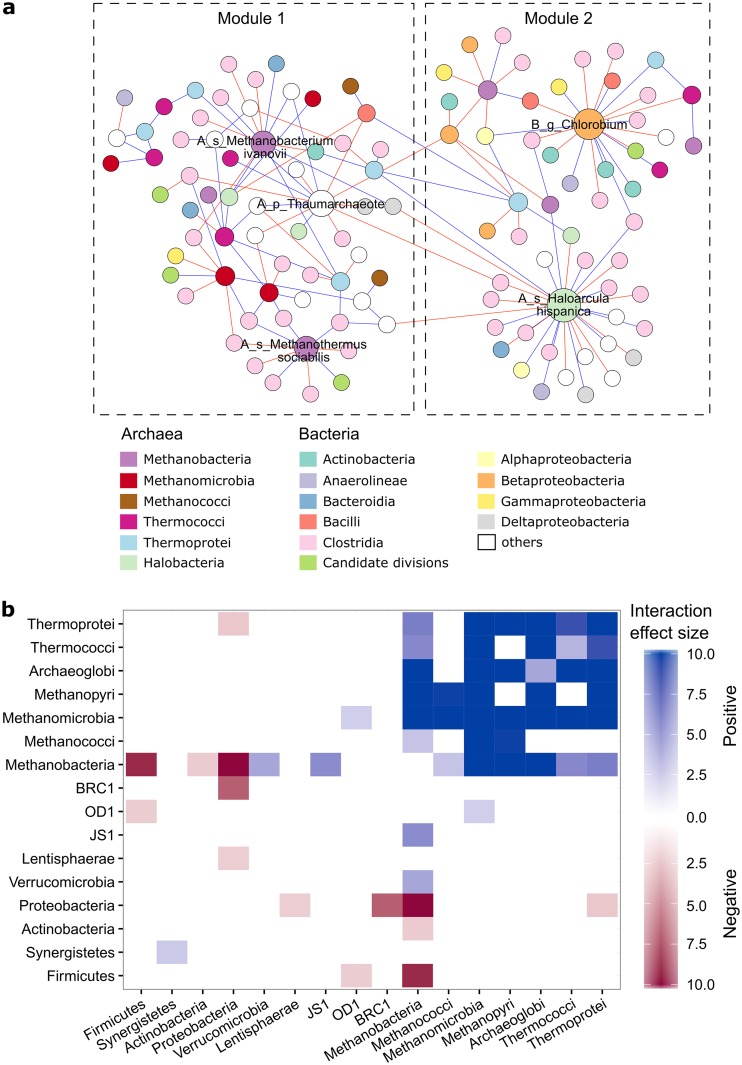
Although biotic interactions among members of microbial communities have been conceived to be crucial for community assembly, it remains unclear how changes in environmental conditions affect microbial interaction and consequently system performance. Here, we adopted a random matrix theory-based network analysis to explore microbial interactions in triplicate anaerobic digestion (AD) systems, which is widely applied for organic pollutant treatments. The digesters were operated with incremental organic loading rates (OLRs) from 1.0 g volatile solids (VS)/liter/day to 1.3 g VS/liter/day and then to 1.5 g VS/liter/day, which increased VS removal and methane production proportionally. Higher resource availability led to networks with higher connectivity and shorter harmonic geodesic distance, suggestive of more intense microbial interactions and quicker responses to environmental changes. Strikingly, a number of topological properties of microbial network showed significant (P < 0.05) correlation with AD performance (i.e., methane production, biogas production, and VS removal). When controlling for environmental parameters (e.g., total ammonia, pH, and the VS load), node connectivity, especially that of the methanogenic archaeal network, still correlated with AD performance. Last, we identified the Methanothermus, Methanobacterium, Chlorobium, and Haloarcula taxa and an unclassified Thaumarchaeota taxon as keystone nodes of the network.IMPORTANCE AD is a biological process widely used for effective waste treatment throughout the world. Biotic interactions among microbes are critical to the assembly and functioning of the microbial community, but the response of microbial interactions to environmental changes and their influence on AD performance are still poorly understood. Using well-replicated time series data of 16S rRNA gene amplicons and functional gene arrays, we constructed random matrix theory-based association networks to characterize potential microbial interactions with incremental OLRs. We demonstrated striking linkage between network topological features of methanogenic archaea and AD functioning independent of environmental parameters. As the intricate balance of multiple microbial functional groups is responsible for methane production, our results suggest that microbial interaction may be an important, previously unrecognized mechanism in determining AD performance.
Keywords: anaerobic digestion; microbial interaction; system performance.
Copyright © 2020 Wu et al.
Figures
Similar articles
-
Upflow anaerobic sludge blanket reactor--a review.Indian J Environ Health. 2001 Apr;43(2):1-82. Indian J Environ Health. 2001. PMID: 12397675 Review.
-
Performance of Anaerobic Digestion of Chicken Manure Under Gradually Elevated Organic Loading Rates.Int J Environ Res Public Health. 2019 Jun 25;16(12):2239. doi: 10.3390/ijerph16122239. Int J Environ Res Public Health. 2019. PMID: 31242650 Free PMC article.
-
High variations of methanogenic microorganisms drive full-scale anaerobic digestion process.Environ Int. 2019 May;126:543-551. doi: 10.1016/j.envint.2019.03.005. Epub 2019 Mar 7. Environ Int. 2019. PMID: 30852441
-
Anaerobic digestion of pulp and paper mill wastewater and sludge.Water Res. 2014 Nov 15;65:321-49. doi: 10.1016/j.watres.2014.07.022. Epub 2014 Jul 24. Water Res. 2014. PMID: 25150519 Review.
-
Effects of organic loading rate on reactor performance and archaeal community structure in mesophilic anaerobic digesters treating municipal sewage sludge.Waste Manag Res. 2011 Nov;29(11):1117-23. doi: 10.1177/0734242X11417985. Epub 2011 Sep 2. Waste Manag Res. 2011. PMID: 21890875
Cited by
-
Plants Play Stronger Effects on Soil Fungal than Bacterial Communities and Co-Occurrence Network Structures in a Subtropical Tree Diversity Experiment.Microbiol Spectr. 2022 Jun 29;10(3):e0013422. doi: 10.1128/spectrum.00134-22. Epub 2022 Apr 27. Microbiol Spectr. 2022. PMID: 35475656 Free PMC article.
-
Microbial co-occurrence network topological properties link with reactor parameters and reveal importance of low-abundance genera.NPJ Biofilms Microbiomes. 2022 Jan 17;8(1):3. doi: 10.1038/s41522-021-00263-y. NPJ Biofilms Microbiomes. 2022. PMID: 35039527 Free PMC article.
-
Exploring the Microbiome Analysis and Visualization Landscape.Front Bioinform. 2021 Dec 2;1:774631. doi: 10.3389/fbinf.2021.774631. eCollection 2021. Front Bioinform. 2021. PMID: 36303773 Free PMC article. Review.
-
Characterizing sediment functional traits and ecological consequences respond to increasing antibiotic pollution.Appl Microbiol Biotechnol. 2023 Jun;107(12):4093-4107. doi: 10.1007/s00253-023-12572-7. Epub 2023 May 16. Appl Microbiol Biotechnol. 2023. PMID: 37191684
-
Warming effects on grassland soil microbial communities are amplified in cool months.ISME J. 2024 Jan 8;18(1):wrae088. doi: 10.1093/ismejo/wrae088. ISME J. 2024. PMID: 38747385 Free PMC article.
References
LinkOut - more resources
Full Text Sources
Research Materials
