. 2020 Apr 15;80(8):1630-1643.
doi: 10.1158/0008-5472.CAN-19-1363. Epub 2020 Jan 7.

Undermining Glutaminolysis Bolsters Chemotherapy While NRF2 Promotes Chemoresistance in KRAS-Driven Pancreatic Cancers

Affiliations

Undermining Glutaminolysis Bolsters Chemotherapy While NRF2 Promotes Chemoresistance in KRAS-Driven Pancreatic Cancers

Suman Mukhopadhyay et al. Cancer Res. .

Abstract

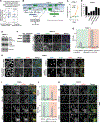
Pancreatic cancer is a disease with limited therapeutic options. Resistance to chemotherapies poses a significant clinical challenge for patients with pancreatic cancer and contributes to a high rate of recurrence. Oncogenic KRAS, a critical driver of pancreatic cancer, promotes metabolic reprogramming and upregulates NRF2, a master regulator of the antioxidant network. Here, we show that NRF2 contributed to chemoresistance and was associated with a poor prognosis in patients with pancreatic cancer. NRF2 activation metabolically rewired and elevated pathways involved in glutamine metabolism. This curbed chemoresistance in KRAS-mutant pancreatic cancers. In addition, manipulating glutamine metabolism restrained the assembly of stress granules, an indicator of chemoresistance. Glutaminase inhibitors sensitized chemoresistant pancreatic cancer cells to gemcitabine, thereby improving the effectiveness of chemotherapy. This therapeutic approach holds promise as a novel therapy for patients with pancreatic cancer harboring KRAS mutation. SIGNIFICANCE: These findings illuminate the mechanistic features of KRAS-mediated chemoresistance and provide a rationale for exploiting metabolic reprogramming in pancreatic cancer cells to confer therapeutic opportunities that could be translated into clinical trials. GRAPHICAL ABSTRACT: http://cancerres.aacrjournals.org/content/canres/80/8/1630/F1.large.jpg.


Conflict of interest statement

Disclosure of Potential Conflicts of Interest

Dr. Frank McCormick is a consultant for the following companies: Aduro Biotech, Amgen, Daiichi Ltd, Ideaya Biosciences, Kura Oncology, Leidos Biomedical Research, Inc., PellePharm, Pfizer Inc., PMV Pharma, Portola Pharmaceuticals, and Quanta Therapeutics. Dr. McCormick has received research grants from Daiichi Sankyo Ltd and is a recipient of funded research from Gilead Sciences. Dr. McCormick is a consultant and co-founder for the following companies (with ownership interest including stock options): BridgeBio, DNAtrix Inc., Olema Pharmaceuticals, Inc., and Quartz. Dr. McCormick is Scientific Director of the NCI Ras Initiative at Frederick National Laboratory for Cancer Research/Leidos Biomedical Research, Inc.

Figures

Figure 1.
Figure 1.. Differential expression of NRF2 in pancreatic cancer.
A, Western blot showing the basal level of NRF2 in HPNE-hTERT KRAS WT and KRAS G12D cells. Vinculin is the loading control. B, NRF2 basal level detected by western blot in PDAC, BxPC-3, MIA Paca-2, Capan-1, PANC-1, SU.86.86, and PK-1 cells. Actin is the loading control. C, Immunofluorescence staining of NRF2 (green) in PDAC cells. Blue, DAPI-stained nuclei. Images are in 40x view, scale bars 20 μm D, Normal and KPC mouse pancreatic ductal tissue sections were processed for (upper panel) western blotting and (lower panel) H&E staining (top), immunohistochemical (bottom) staining for NRF2 (20x view). Scale bars, 200 μm for images. Hsp60 is the loading control in western blot. Representative data (A-D) are shown from at least two independent experiments. E, Representative images of immunohistological staining of NRF2 in a human tissue microarray of the pancreas showing absent (0+), weak (1+), intermediate (2+), and strong (3+) staining intensity. Images are in 20x view, scale bars 100μm (left), 2mm (right). F, Pie charts generated for each grade of tissue sample based on NRF2 staining intensity. Immunohistochemical scoring intensity was classified with the indicated colors. The relative distribution of each group was normalized to the total number of each grade of tissue sample and given a value of 100%. G, Survival analysis for TCGA-PAAD was bifurcated at the 75th percentile and grouped by high versus low levels of NFE2L2 gene expression. H, Oncomine analysis depicts the elevated expression of NRF2 at the mRNA level in human pancreatic cancers compared to normal pancreatic tissues.
Figure 2.
Figure 2.. NRF2 mediates chemoresistance in PDAC cells:
A, PDAC cells were treated with increasing concentrations of gemcitabine for 48 hours. Percentage of drug inhibition was determined using the CellTiter-Glo assay. IC50 values were determined using GraphPad Prism. B, PANC-1 and PK-1 cells were transiently transfected with shRNA expression vectors targeting NRF2 or scrambled on seeding day. Titrations of gemcitabine were treated on the following day. Drug inhibition percentage was calculated as in A. C, PANC-1 cells were treated with 10 μM AI-1 and increasing doses of gemcitabine or DMSO control for 48 hours. D, Stable cells with NRF2 over-expressing Capan-1 and BxPC-3 were treated by nine-point gemcitabine titration for 48 hours to analyze drug inhibition percentage. MIA PaCa-2 cells were transiently transfected with NRF2 over-expressing vector or empty vector and, on the following day, treated with gemcitabine titration for 48 hours. E, MIA PaCa-2 and BxPC-3 cells were treated with 10 μM AI-1 and increasing doses of gemcitabine or DMSO control for 48 hours. F, MIA PaCa-2 cells were transiently transfected with shRNA expression vectors, and titrations of gemcitabine were treated as in B. Percent of gemcitabine inhibition was assessed by CellTiter-Glo assay and was determined relative to the proportion of respective control. Error bars represent standard error of mean (SEM) from three independent experiments.
Figure 3.
Figure 3.. Effects of NRF2 activation on metabolic signaling:
A, BxPC-3 cells were dose-dependently treated with AI-1 for 24 hours. Whole cell lysates were analyzed via western blot for indicated proteins. B, BxPC-3 cells were treated with AI-1 (10μM, 6 hours) and subjected to metabolomic analysis by GC-TOF MS. Metabolite Set Enrichment Analysis (MSEA) of AI-1-treated BxPC-3 cells compared to their DMSO control. (left panel) Summary plots for MSEA are ranked by p-value. (p<0.05, Student’s t test, n=4). (right panel) Network representation of overlapping enriched compound cluster in AI-1-treated BxPC-3 cells compared to DMSO control. Each circle represents a compound set. Circle size corresponds to compound set size and intensity to degree of overlap. Red is upregulated and blue is downregulated. Cellular compounds associated with compound sets are listed. C, Bar graph illustrating the qualitative description of lipids class composition measured in AI-1-treated (10μM, 6 hours) and DMSO control of BxPC-3 cells. n=3, averages ± standard deviation. Lipid class amounts were normalized to the total lipid amount, yielding the percent of total lipids. D, BxPC-3 cells were treated with AI-1 (10μM) in a time-course manner and analyzed via western blot for indicated proteins. E, MIA PaCa-2 cells were treated with AI-1 (10μM, 24 hours) or DMSO (control) and processed for immunoblotting as in D. F, MIA PaCa-2 cells were transiently transfected with NRF2 over-expressing plasmid or empty backbone (p Lenti6.3) as control. Immunoblotting was performed as in E. G, BxPC-3 cells were treated with AI-1 (10μM) and/or gemcitabine (20ηM) for 48 hours, and indicated proteins were analyzed by immunoblotting. A, D-G, Vinculin is the loading control. Images are representative of at least two independent experiments.
Figure 4.
Figure 4.. Effects of glutamine deprivation on cell growth and stress granule formation:
A, Nucleotide biosynthetic pathway enrichment score for gemcitabine-treated PAAD patients was determined using GOBP database. Significant p value was evaluated. B, Schematic overview of glutamine utilization in cancer cells and role of NRF2 in metabolism. Glutamine contributes to nucleotide biosynthesis directly or through the TCA cycle. The aspartate generated by the TCA cycle is critical for amino acid and protein biosynthesis, which in turn regulates cell proliferation. NRF2 mediates nucleotide synthesis, which in turn supports cell growth . Genes upregulated by activated NRF2 are indicated by green color. C, Cells were plated in complete media (CM) containing 10% serum. After 24 hours (day 1), cells were shifted to CM or medium lacking glutamine (-Q), harvested at indicated times, and quantified after crystal violet staining. Error bars represent the SEM for three independent experiments. D, PANC-1 cells were plated and shifted to CM or media lacking Q, as in B. Cells were additionally treated with (5mM) DMKG, (1X) NEAA mixture, or the combination following glutamine withdrawal. For Erastin treatment, cells were shifted to Q lacking media after overnight pretreatment with 500ηM Erastin. Following indicated treatments for five days, cell proliferation was assessed as in B. Error bars represent SEM of four independent experiments. Data presented as relative percent to CM-treated condition as control. E, GPX4 protein levels in PANC-1 cells treated with CM or -Q for 72 hours were assessed by immunoblotting. Vinculin is the loading control. A representative image is shown from at least three independent experiments. F, BxPC-3 cells were treated with 15d-PGJ2 (50μM, 1 hour) or vehicle control. (left panel) Whole cell lysates were subjected to immunoblotting with indicated antibodies. Vinculin is the loading control. (right panel) Stress granules (SG) were detected by G3BP (green) and eIF4G (red) immunofluorescence staining. Blue, DAPI-stained nuclei. Scale bars, 20μm. G, PANC-1 cells were transiently transfected with scrambled or NRF2 shRNA as indicated. 15d-PGJ2 were treated and SGs were detected as in E. SGs were quantified by defining an SG index (SG area/cell area) based on G3BP (green) and eIF4G (red) immunofluorescence. Error bars indicate SEM for two independent experiments. H, PANC-1 cells were treated as in G, and SGs were detected as in F. F-H, The images are representative of at least two independent experiments. I, PANC-1 cells were plated and shifted to CM or -Q for 72 hours then treated with 15d-PGJ2 where indicated. 15d-PGJ2 treatment and SG detection were done as in F. J, SGs were quantified from H by number of SGs per cell and by defining an SG index as in G. Error bars indicate SEM for three independent experiments. K, PANC-1 cells were treated as in I. Additionally, gemcitabine (2μM, 24 hour) was added to each sample, and SGs were detected as in F. I-K, The images are representative of at least three independent experiments. F,H,I,K, Images are in 40x view, scale bars represent 20 μm.
Figure 5.
Figure 5.. Disruption of glutaminolysis sensitizes PDAC cells to chemotherapeutic drugs:
A, Survival of PANC-1 cells pre-treated with CM or -Q for 72 hours followed by 36-hour gemcitabine (2μM) treatment as indicated. Values were normalized to cell survival in CM-treated condition as control, which were given a value of 100%. B, PANC-1 cells were plated and shifted to CM or media lacking Q. Cells were additionally treated with a combination of (5mM) DMKG and (1X) NEAA mixture for 72 hours following glutamine withdrawal where indicated. Gemcitabine (2μM, 36 hours) was added for respective samples, and the percent of non-viable cells was calculated using the trypan blue dye exclusion assay. C, SU.86.86 cells were plated and treated with no glutamine media as in A. Cells were treated with 0.2μM gemcitabine for the last 24 hours as indicated, and the percent of non-viable cells was calculated. D, One day after plating, HPNE-hTERT cells were shifted to CM or medium lacking Q for 48 hours then treated with or without (2μM) gemcitabine for an additional 24 hours in the presence of pretreatment as indicated. The percent of non-viable cells was determined. E, PANC-1 cells were plated in CM overnight, after which cells were treated with 10μM CB-839 or 10μM BPTES for 72 hours where indicated. An additional treatment of 2μM capecitabine, 2μM gemcitabine, or 10μM 5-FU was given for 36 hours as indicated. The percent of non-viable cells was determined. F, PANC-1 cells were treated with RSL3 (10ηM) and/or gemcitabine (2μM) for 24 hours. The percent of non-viable cells was determined as in B. A-F, Error bars represent the SEM for four independent experiments. G, Experimental design for H-P. H-O, Mice bearing tumors of KPC (H-I), MIA PaCa-2 (J-K), SU.86.86 (L-M) and PANC-1 cells (N-O) were administered drug schedules as indicated in the schematic representation G. Tumor volumes (H, J, L, N) and body weights of mice (I, K, M, O) were shown with error bars representing SEM for each group. Threshold for p-value was <0.05. P, Survival of PANC-1 tumor-bearing mice represented as a Kaplan-Meier plot. H-P, Statistical differences between treatment groups were determined with a critical p value of <0.05. Synergistic effect of CB-839+Gemcitabine is evident by comparing tumor volumes (H,J,L,N) with single compound treated groups with statistical significance whereas insignificant body weight changes has been documented (I,K,M,O) for either of four treatment groups in all cases.
Figure 6.
Figure 6.. Perturbing glutamine metabolism potentiates the efficacy of chemotherapy in KRAS-driven pancreatic cancers:
Model illustrates reprogrammed metabolic pathways in RAS-driven PDAC cells linked to KRAS mutation and NRF2 activation, which drive glutaminolysis. Mutant KRAS-mediated NRF2 activation leads to chemoresistance by regulating antioxidant genes. Modulation of nucleotide synthesis by NRF2 also supports PDAC cell growth. Anaplerotic glutamine utilization is a key feature of KRAS-driven PDAC cells. KRAS-regulated glutamine metabolic rewiring influenced the TCA cycle, which is critical for nucleotide and DNA synthesis to support cell growth and survival (12,29). CB-839 inhibits GLS, whereas gemcitabine blocks DNA synthesis. This model potentiates CB-839 treatment along with gemcitabine as a therapeutic strategy to combat chemoresistance in KRAS-driven pancreatic cancers.

References

    1. Sousa CM, Kimmelman AC. The complex landscape of pancreatic cancer metabolism. Carcinogenesis 2014;35:1441–50 - PMC - PubMed
    1. Grasso C, Jansen G, Giovannetti E. Drug resistance in pancreatic cancer: Impact of altered energy metabolism. Crit Rev Oncol Hematol 2017;114:139–52 - PubMed
    1. Oberstein PE, Olive KP. Pancreatic cancer: why is it so hard to treat? Therap Adv Gastroenterol 2013;6:321–37 - PMC - PubMed
    1. Bryant KL, Mancias JD, Kimmelman AC, Der CJ. KRAS: feeding pancreatic cancer proliferation. Trends Biochem Sci 2014;39:91–100 - PMC - PubMed
    1. McCormick F KRAS as a Therapeutic Target. Clin Cancer Res 2015;21:1797–801 - PMC - PubMed

Publication types

MeSH terms