. 2020 Jan 7;11(1):64.
doi: 10.1038/s41467-019-13720-2.

Velocity and density characteristics of subducted oceanic crust and the origin of lower-mantle heterogeneities

Affiliations

Velocity and density characteristics of subducted oceanic crust and the origin of lower-mantle heterogeneities

Wenzhong Wang et al. Nat Commun. .

Erratum in

Abstract

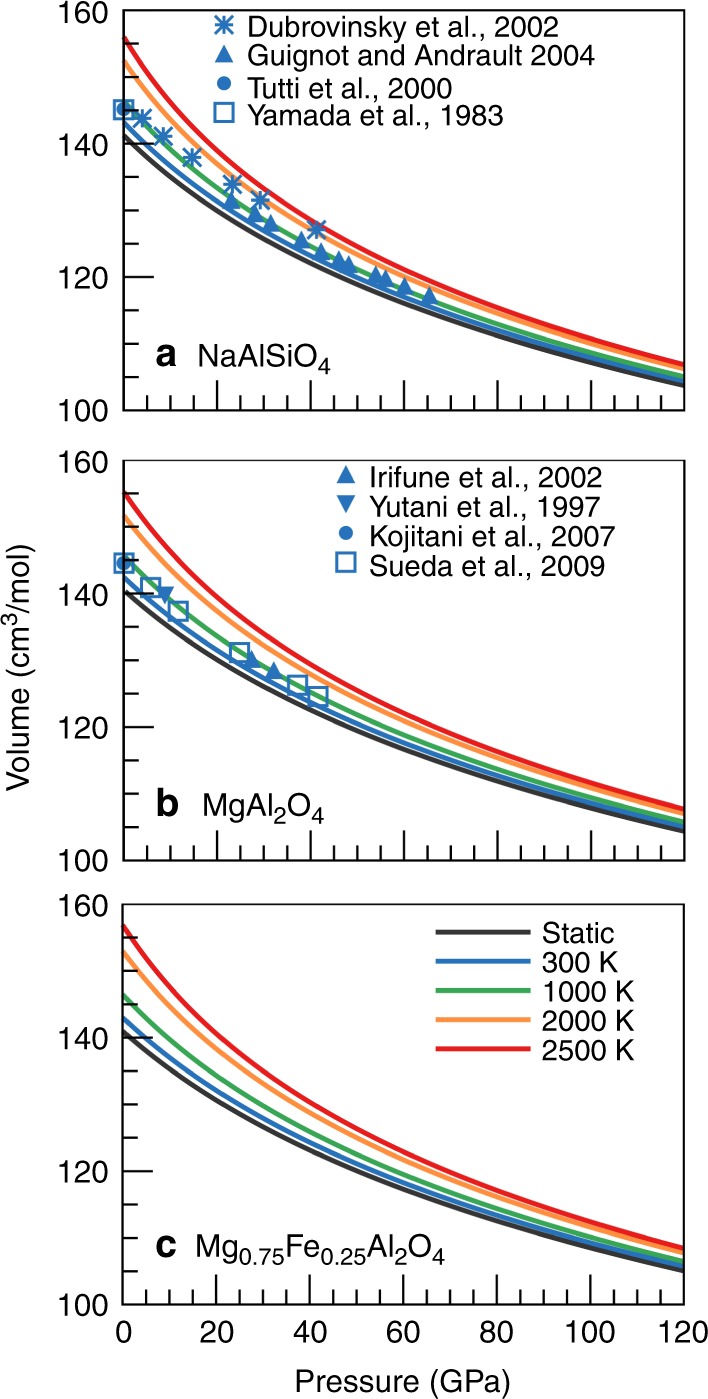
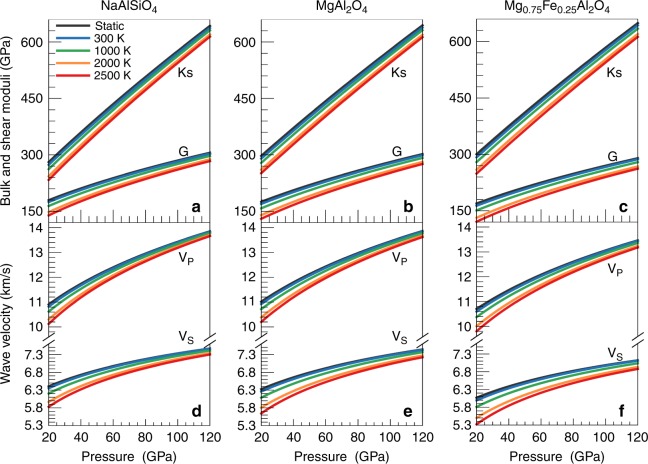
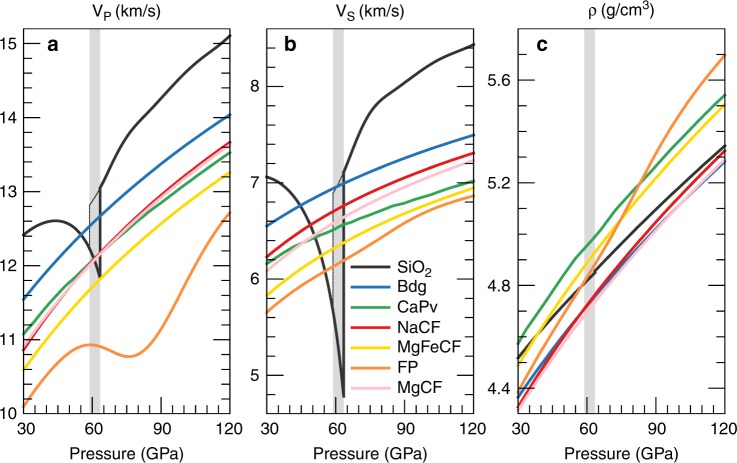
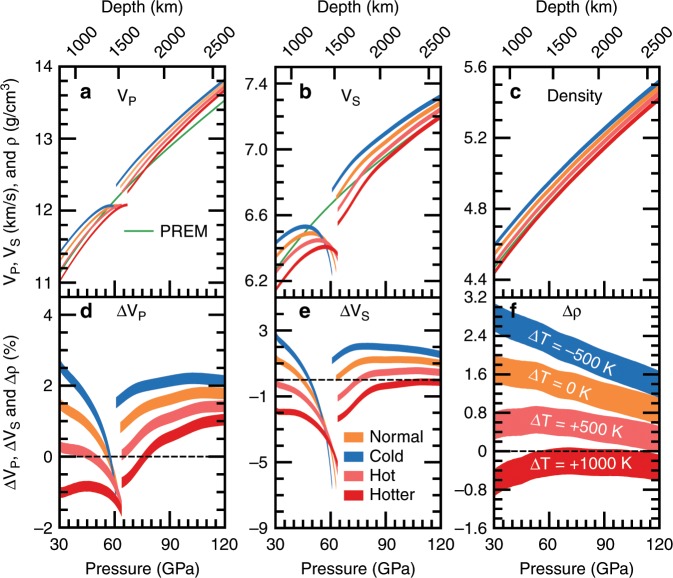
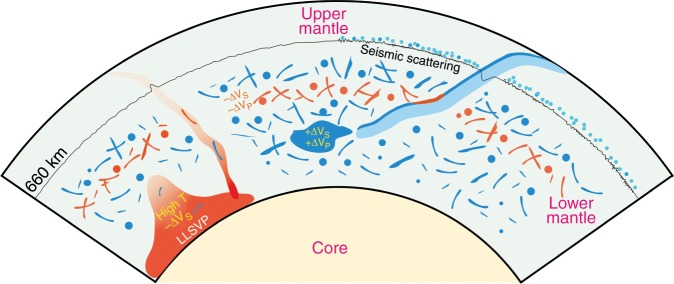
Seismic heterogeneities detected in the lower mantle were proposed to be related to subducted oceanic crust. However, the velocity and density of subducted oceanic crust at lower-mantle conditions remain unknown. Here, we report ab initio results for the elastic properties of calcium ferrite-type phases and determine the velocities and density of oceanic crust along different mantle geotherms. We find that the subducted oceanic crust shows a large negative shear velocity anomaly at the phase boundary between stishovite and CaCl2-type silica, which is highly consistent with the feature of mid-mantle scatterers. After this phase transition in silica, subducted oceanic crust will be visible as high-velocity heterogeneities as imaged by seismic tomography. This study suggests that the presence of subducted oceanic crust could provide good explanations for some lower-mantle seismic heterogeneities with different length scales except large low shear velocity provinces (LLSVPs).


Conflict of interest statement

The authors declare no competing interests.

Figures

Fig. 1
Fig. 1. Compression curves of CF-type phases.
a NaAlSiO4, b MgAl2O4, and c Mg0.75Fe0.25Al2O4. Colorful lines represent ab initio results at variable temperatures and points are experimental data in previous studies.
Fig. 2
Fig. 2. Elastic moduli and wave velocities of CF-type phases.
ac bulk and shear moduli (KS and G), df compressional and shear wave velocities (VP and VS). Elastic moduli and wave velocities for a, d NaAlSiO4, b, e MgAl2O4, c, f Mg0.75Fe0.25Al2O4.
Fig. 3
Fig. 3. Comparisons of velocities and density between CF-type phases and other lower-mantle minerals along the normal mantle geotherm.
a compressional wave velocities (VP), b shear wave velocity (VS), and c density (ρ). The normal mantle geotherm is derived from Brown and Shankland (1981). Data sources: NaCF, NaAlSiO4 CF-type phase, this study; MgCF, MgAl2O4 CF-type phase, this study; MgFeCF, Mg0.75Fe0.25Al2O4 CF-type phase, this study; SiO2, stishovite and the CaCl2-type silica, Yang and Wu (2014); Bdg, Mg0.92Fe0.08SiO3 bridgmanite, Shukla et al. (2015); CaPv, Ca-perovskite, Kawai and Tsuchiya (2015); FP, Mg0.82Fe0.18O ferropericlase, Wu et al. (2013). Grey areas represent the calculated phase boundary between stishovite and the CaCl2-type silica.
Fig. 4
Fig. 4. Velocities and density characteristics of subducted oceanic crust.
ac Wave velocities (VP and VS) and densities (ρ) of MORB along different mantle geotherms. The normal mantle geotherm is from Brown and Shankland (1981). Red, pink, orange, and blue lines represent VP, VS, and ρ of MORB along the mantle geotherms with variable temperature anomalies relative to the normal mantle geotherm. Temperature anomalies for red, pink, orange, and blue lines are + 1000 K, + 500 K, 0 K, and 500 K, respectively. Green lines are PREM values. MORB: 39% Fe- and Al-bearing bridgmanite (Mg0.58Fe0.16Al0.26Si0.74Al0.26O3), 30% Ca-perovskite (CaSiO3), 16% SiO2, and 15% Fe-bearing CF-type phase (Na0.4Mg0.48Fe0.12Al1.6Si0.4O4). (d) (e) (f) the VP, VS, and ρ contrasts between MORB and PREM. ∆M = 2(MMORB-MPREM)/(MMORB + MPREM), M = VP, VS, and ρ. MPREM, green lines in a, b, c; MMORB, red, orange, or blue lines in a, b, c. The linewidth represents uncertainties caused by the errors for elastic properties (<0.8%) and the variations in the concentration of dilute substitutional solutes (±1 mol%).
Fig. 5
Fig. 5. Schematic diagram for subducted oceanic crust in the lower mantle.
The velocity heterogeneities caused by subducted oceanic crust are noticeably depth-dependent: it produces large negative velocity anomalies at the mid mantle but high velocity heterogeneities at the lower part of mantle. The presence of subducted oceanic crust could provide explanations for seismic scatters and high velocity heterogeneities (~2%) in the lower mantle imaged by seismic tomography, but LLSVPs likely do not originate from subducted oceanic crust. The 660-km discontinuity, which defines the top of the lower mantle, was also found to show the small-scale topographic variations.

References

    1. Tackley, P. J. in Treatise on Geophysics 521–585 (Elsevier, 2015).
    1. Ni S. Sharp Sides to the African Superplume. Science. 2002;296:1850–1852. doi: 10.1126/science.1070698. - DOI - PubMed
    1. Ritsema J, Ni S, Helmberger DV, Crotwell HP. Evidence for strong shear velocity reductions and velocity gradients in the lower mantle beneath Africa. Geophys. Res. Lett. 1998;25:4245–4248. doi: 10.1029/1998GL900127. - DOI
    1. van der Hilst RD, et al. Seismostratigraphy and thermal structure of Earth’s Core-Mantle boundary region. Science. 2007;315:1813–1817. doi: 10.1126/science.1137867. - DOI - PubMed
    1. Thorne MS, Garnero EJ. Inferences on ultralow-velocity zone structure from a global analysis of SPdKS waves. J. Geophys. Res. Solid Earth. 2004;109:1–22. doi: 10.1029/2004JB003010. - DOI