. 2020 Jan 7;11(1):72.
doi: 10.1038/s41467-019-13809-8.

Ketamine disinhibits dendrites and enhances calcium signals in prefrontal dendritic spines

Affiliations

Ketamine disinhibits dendrites and enhances calcium signals in prefrontal dendritic spines

Farhan Ali et al. Nat Commun. .

Erratum in

Abstract

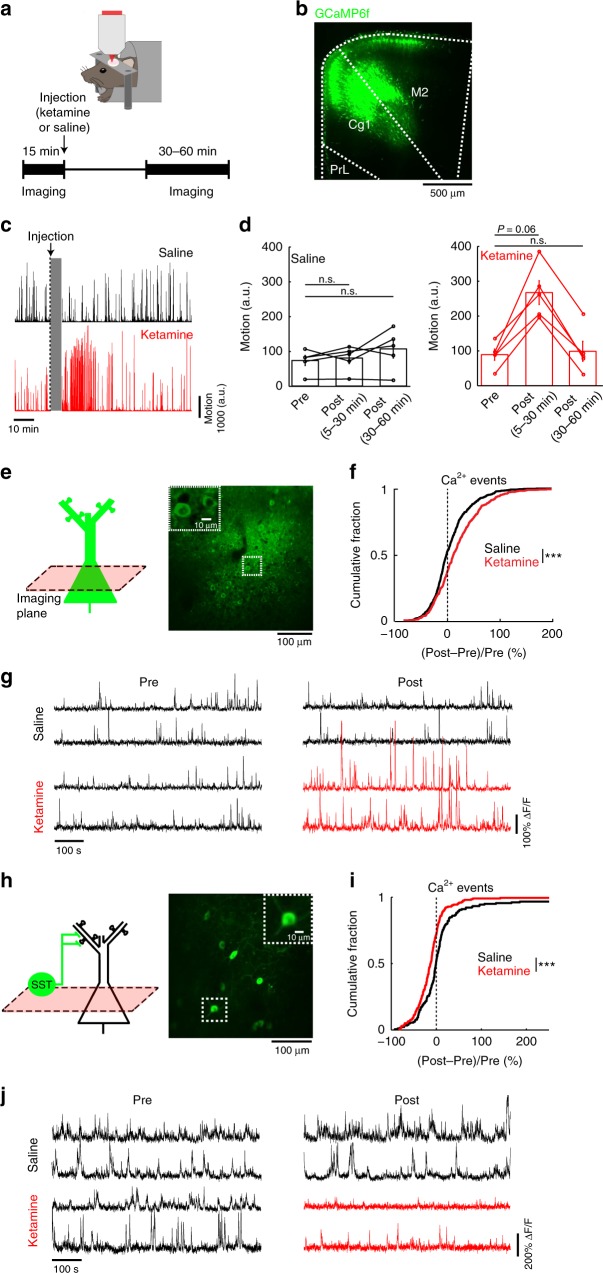
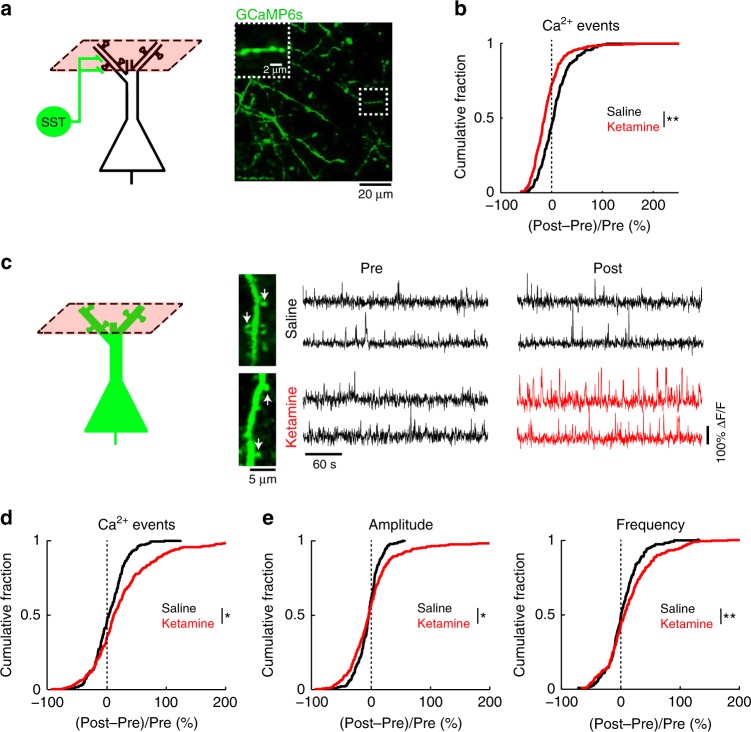
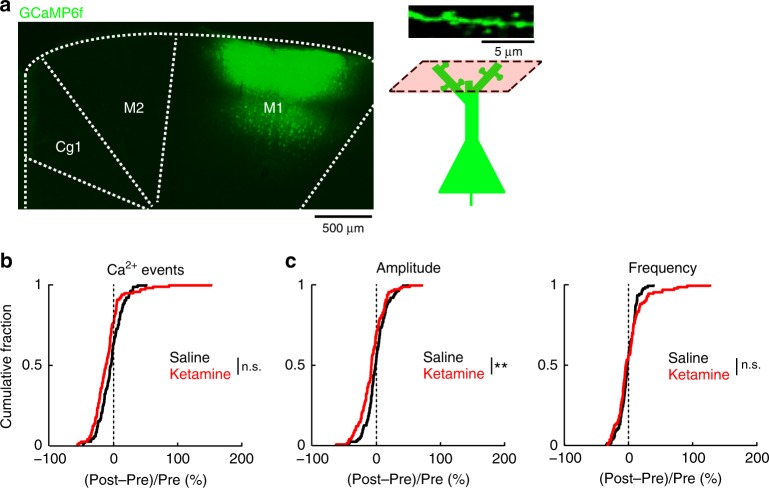
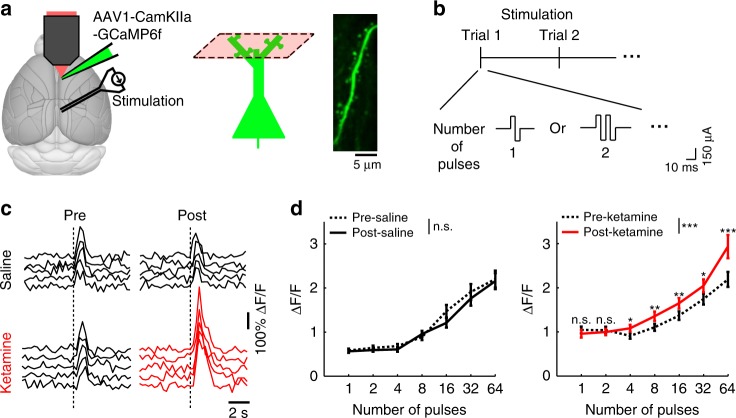
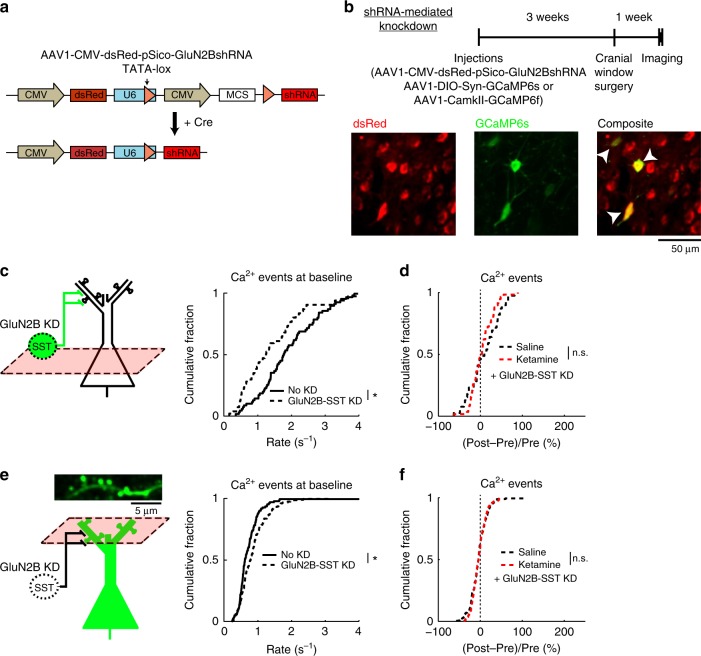
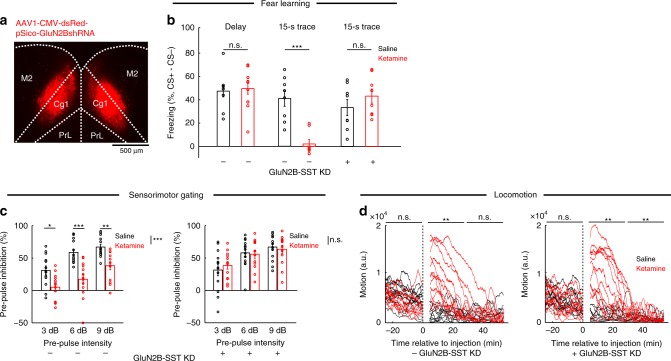
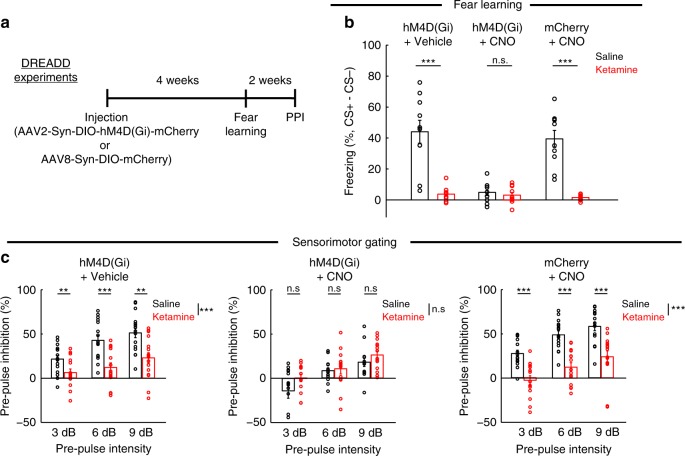
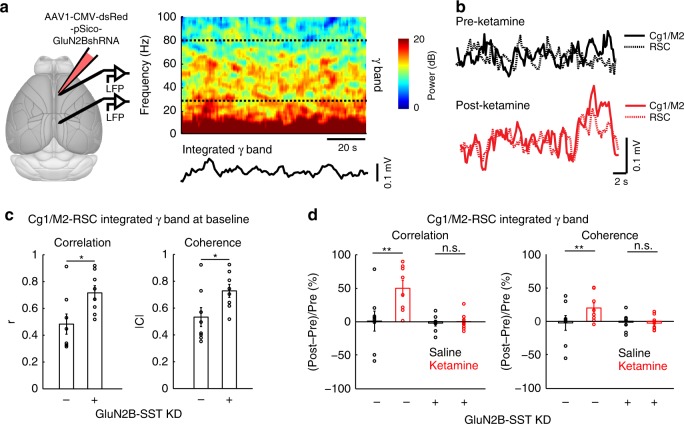
A subanesthetic dose of ketamine causes acute psychotomimetic symptoms and sustained antidepressant effects. In prefrontal cortex, the prevailing disinhibition hypothesis posits that N-methyl-d-aspartate receptor (NMDAR) antagonists such as ketamine act preferentially on GABAergic neurons. However, cortical interneurons are heterogeneous. In particular, somatostatin-expressing (SST) interneurons selectively inhibit dendrites and regulate synaptic inputs, yet their response to systemic NMDAR antagonism is unknown. Here, we report that ketamine acutely suppresses the activity of SST interneurons in the medial prefrontal cortex of the awake mouse. The deficient dendritic inhibition leads to greater synaptically evoked calcium transients in the apical dendritic spines of pyramidal neurons. By manipulating NMDAR signaling via GluN2B knockdown, we show that ketamine's actions on the dendritic inhibitory mechanism has ramifications for frontal cortex-dependent behaviors and cortico-cortical connectivity. Collectively, these results demonstrate dendritic disinhibition and elevated calcium levels in dendritic spines as important local-circuit alterations driven by the administration of subanesthetic ketamine.


Conflict of interest statement

R.S.D. has consulted and/or received research support from Allergan, Naurex, Aptynix, Lilly, Johnson & Johnson, Taisho, Relmada, and Navitor on unrelated projects. The remaining authors declare no competing interests.

Figures

Fig. 1
Fig. 1. Effects of subanesthetic ketamine on the activity of pyramidal neurons and SST interneurons in vivo.
a Schematic and timeline of the experiments. b Coronal histological section, showing the extent of AAV-mediated expression of GCaMP6f in the mouse medial prefrontal cortex. Cg1, cingulate cortex. M2, secondary motor cortex. PrL, prelimbic cortex. c Example motion traces from a head-fixed animal during a two-photon imaging session before and after saline injection (black), and another session before and after ketamine (10 mg/kg) injection (red). Gray shading denotes the 5 min during which the injection was made and imaging was done to verify that the field of view had not shifted. d Time-averaged motion (mean ± s.e.m.) for epochs including pre-injection, 5–30 min post-injection, and 30–60 min post-injection for saline (left) and ketamine (right). For saline injection (black), there were no detectable differences between epochs (pre-injection vs. 5–30 min post-injection: P= 0.6; pre-injection vs. 30–60 min post-injection: P= 0.1; Wilcoxon signed rank test). For ketamine (red), hyperlocomotion was detected transiently following injection (pre-injection vs. 5–30 min post-injection: P= 0.06; pre-injection vs. 30–60 min post-injection: P= 1; Wilcoxon signed rank test). Each point is an imaging session. n = 5 animals each for saline and ketamine. e Schematic of imaging location, and an in vivo two-photon image of GCaMP6s-expressing pyramidal neurons in Cg1/M2. Inset, magnified view of neuronal cell bodies. f The normalized difference in the rate of spontaneous calcium events of pyramidal neurons. Normalized difference was calculated as post-injection minus pre-injection values normalized by the pre-injection value (ketamine (10 mg/kg): 23.7 ± 2.1%, saline: 9.4 ± 1.9%, mean ± s.e.m.; P = 3 × 10−8, two-sample t-test). For ketamine, n = 613 cells from 5 animals. For saline, n = 681 cells from 5 animals. g Each row shows time-lapse fluorescence transients from the same pyramidal cell in the pre-injectiion (left) and post-injection (right) periods. Two example cells were plotted for saline injection (black), and two other examples were plotted for ketamine (10 mg/kg) injection (pre-injection: black; post-injection: red). hj Same as (eg) for GCaMP6s-expressing SST interneurons in Cg1/M2 of SST-IRES-Cre animals (ketamine (10 mg/kg): −12 ± 3%, saline: 13 ± 6%, mean ± s.e.m.; P = 1 × 10−4, two-sample t-test). For ketamine, n = 198 cells from 5 animals. For saline, n = 179 cells from 5 animals. *P < 0.05; **P < 0.01; ***P < 0.001; n.s., not significant.
Fig. 2
Fig. 2. Ketamine induces opposing effects on dendrite-targeting SST axons and apical dendrites of pyramidal neurons.
a Schematic of imaging location, and an in vivo two-photon image of GCaMP6s-expressing SST axons in superficial layers of Cg1/M2 of SST-IRES-Cre animals. Inset, magnified view of a SST axonal segment. b The normalized difference in the rate of spontaneous calcium events for SST axons in superficial layers. Normalized difference was calculated as post-injection minus pre-injection values normalized by the pre-injection value (ketamine (10 mg/kg): −9 ± 3%, saline: 12 ± 7%, mean ± s.e.m.; P = 0.002, two-sample t-test). For ketamine, n = 269 boutons from 5 animals. For saline, n = 214 boutons from 5 animals. c Left, schematic of imaging location. Right, each row shows time-lapse fluorescence transients from the same dendritic spine in the pre-injection (left) and post-injection (right) periods. Two example spines were plotted for saline injection (black) and two other examples were plotted for ketamine (10 mg/kg) injection (pre-injection: black; post-injection: red). Locations of the spines in the in vivo two-photon images are indicated by white arrows. d Same as (b) but for dendritic spines in superficial layers of Cg1/M2 (ketamine (10 mg/kg): 43.42 ± 0.01%, saline: 4.34 ± 0.01%, mean ± s.e.m.; P = 0.02, two-sample t-test). For ketamine, n = 280 dendritic spines from 5 animals. For saline, n = 231 dendritic spines from 5 animals. e The normalized difference in amplitude (ketamine (10 mg/kg): 5 ± 4%, saline: −4 ± 1%, mean ± s.e.m.; P = 0.03, two-sample t-test), and frequency of binned calcium events (ketamine (10 mg/kg): 16 ± 4%; saline: 4 ± 2%; P = 0.008, two-sample t-test). *P < 0.05; **P < 0.01; ***P < 0.001; n.s., not significant.
Fig. 3
Fig. 3. Effect of ketamine on calcium dynamics for dendritic spines in the primary motor cortex.
a Left, coronal histological section, showing the extent of AAV-mediated expression of GCaMP6f in the primary motor cortex, M1. Right, schematic of imaging location. b The normalized difference in the rate of spontaneous calcium events for apical dendritic spines in M1. Normalized difference was calculated as post-injection minus pre-injection values normalized by the pre-injection value (ketamine (10 mg/kg): −7 ± 2%, mean ± s.e.m.; saline: −2 ± 2% for saline; P = 0.05, two-sample t-test). For ketamine, n = 124 dendritic spines from 3 animals. For saline, n = 120 dendritic spines from 3 animals. c The normalized difference in amplitude (ketamine (10 mg/kg): −7 ± 2%; saline: −5 ± 2%; P = 0.004, two-sample t-test) and frequency of binned calcium events (2 ± 2% for ketamine; −1 ± 1% for saline; P = 0.3, two-sample t-test). *P < 0.05; **P < 0.01; ***P < 0.001; n.s., not significant.
Fig. 4
Fig. 4. Ketamine increases synaptically evoked calcium responses in dendritic spines.
a Schematic of experimental setup and imaging location. Right, an in vivo two-photon image of GCaMP6f-expressing apical dendritic spines in the superficial layer of Cg1/M2. b Protocol for the RSC stimulation. c Fluorescence transients in dendritic spines in Cg1/M2 in response to electrical stimulation of the retrosplenial cortex (RSC). Each trace shows a single 32-pulse-stimulation trial during pre-injection (left) or post-injection (right) period. One example spine was plotted for saline injection (black), and another example spine was plotted for ketamine injection (red). Dashed line, time of stimulation onset. d Trial-averaged spine calcium responses as a function of the number of stimulation pulses applied in a trial, for pre-injection (dashed line) vs. post-injection period (solid line) and for saline (black line) vs. ketamine (10 mg.kg) injection (red line). A three-way mixed ANOVA was performed with drug (saline, ketamine) as a between-subjects factor, and stimulation levels (1, 2, 4, 8, 16, 32, 64) and epoch (pre-injection, post-injection) as within-subjects factors. A three-way interaction was significant (F(6,2364) = 5.6, P = 9 × 10−6). A subsequent two-way mixed ANOVA was performed separately on the saline and ketamine datasets, which showed a significant two-way interaction between epoch (pre vs. post) and stimulation levels for ketamine (F(6,1146) = 6.6, P= 7 × 10−7), but not for saline (F(6,1218) = 20.0, P = 0.06). Post-hoc Tukey-Kramer test on the ketamine dataset indicated significantly elevated spine responses for post-injection vs. pre-injection for stimulation pulse numbers of 4 (P = 0.01), 8 (P = 0.007), 16 (P = 0.008), 32 (P= 0.02), and 64 (P= 9 × 10−5). Line, mean ± s.e.m. For saline, n = 204 dendritic spines from 4 animals. For ketamine, n = 192 dendritic spines from 4 animals. Refer to Supplementary Fig. 5f for full distribution. *P < 0.05; **P < 0.01; ***P < 0.001; n.s., not significant. Error bars, ±s.e.m.
Fig. 5
Fig. 5. GluN2B expression in SST interneurons mediates effect of ketamine on dendritic spine calcium.
a Schematic of AAV1-CMV-dsRed-pSico-GluN2BshRNA (standard AAV cassettes not drawn) for Cre-dependent expression of shRNA against GluN2B. b Top, timeline for experiments involving selective knockdown of GluN2B expression in SST interneurons (GluN2B-SST KD). Bottom, in vivo two-photon image of ubiquitous dsRed expression (left), Cre-dependent GCaMP6s expression (middle), and a composite image (right). Arrowheads, cells that expressed both dsRed and GCaMP6s. c The rate of spontaneous calcium events for GCaMP6s-expressing SST interneuron cell bodies with or without GluN2B-SST KD (GluN2B-SST KD: 1.5 ± 0.2 Hz, control SST-IRES-Cre animals with no KD: 1.9 ± 0.1 Hz, mean ± s.e.m.; P = 0.04, two-sample t-test). For GluN2B-SST KD, n = 58 cells from 3 animals. For control animals, n = 72 cells from 3 animals. d The normalized difference in the number of spontaneous calcium events GCaMP6s-expressing SST interneuron cell bodies, for GluN2B-SST KD with ketamine or saline injection. Normalized difference was calculated as post-injection minus pre-injection values normalized by the pre-injection value (ketamine (10 mg/kg) with GluN2B-SST KD: 2 ± 4%, saline with GluN2B-SST KD: 7 ± 6%, mean ± s.e.m.; P = 0.46, two-sample t-test). For ketamine, n = 58 cells from 3 animals. For saline, n = 39 cells from 3 animals. e Same as (c) for GCaMP6f-expressing apical dendritic spines (GluN2B-SST KD: 0.85 ± 0.03 Hz, mean ± s.e.m., control SST-IRES-Cre animals: 0.73 ± 0.04 Hz, mean ± s.e.m.; P = 0.01, two-sample t-test). For GluN2B-SST KD, n = 277 spines from 4 animals. For control animals, n = 118 spines from 3 animals. f Same as (d) for GCaMP6f-expressing apical dendritic spines (ketamine (10 mg/kg) with GluN2B-SST KD: −4 ± 1%, saline with GluN2B-SST KD: −5 ± 2%, mean ± s.e.m.; P = 0.8, two-sample t-test). For ketamine, n = 169 spines from 4 animals. For saline, n = 171 spines from 4 animals. *P < 0.05; **P < 0.01; ***P < 0.001; n.s., not significant.
Fig. 6
Fig. 6. Chronic downregulation of GluN2B in prefrontal cortical SST interneurons and its behavioral consequences.
a Coronal histological section, showing the extent of dsRed expression from bilateral injection of AAV1-CMV-dsRed-pSico-GluN2BshRNA into Cg1/M2 of a SST-IRES-Cre animal. b Fraction of time spent freezing during CS+ and trace period (if any), subtracted by that during CS− and trace period (if any), on the testing day. Freezing behavior for control SST-IRES-Cre animals in delay fear conditioning with no trace period (saline: 47 ± 6%, ketamine (10 mg/kg): 50 ± 5%, mean ± s.e.m.; P= 0.5, Wilcoxon rank-sum test; n= 8 and 12 animals for saline and ketamine, respectively), in trace fear conditioning (saline: 41 ± 7%, ketamine (10 mg/kg): 2 ± 4%, mean ± s.e.m.; P= 6 × 10−6, Wilcoxon rank-sum test; n= 8 animals each for saline and ketamine), and for GluN2B-SST KD animals in trace fear conditioning (saline: 33 ± 7%, ketamine (10 mg/kg): 43 ± 6%, mean ± s.e.m.; P= 0.2, Wilcoxon rank-sum test; n= 8 animals each for saline and ketamine). c Pre-pulse inhibition as a measure of sensorimotor gating. For control SST-IRES-Cre animals, a two-way within-subjects ANOVA with pre-pulse intensity (3, 6, and 9 dB) and drug (saline, ketamine (40 mg/kg)) as within-subjects factors found significant main effects of pre-pulse intensity (F(2,12) = 27.5, P = 4 × 10−6) and drug (F(1,24) = 2.0, P = 2 × 10−4), but a non-significant interaction (F(2,24) 1.8, P = 0.18). Post-hoc Tukey-Kramer’s tests for saline vs. ketamine were significant at 3 dB (40 ± 7%, 5 ± 6%, mean ± s.e.m., P = 0.01), at 6 dB (59 ± 5%, 17 ± 8%, mean ± s.e.m., P = 9 × 10−4), at 9 dB (67 ± 4%, 38 ± 6%, mean ± s.e.m., P = 0.003). n= 13 animals each for saline and ketamine. For GluN2B-SST KD animals, two-way within-subjects ANOVA revealed a significant main effect of pre-pulse intensity (F(2,24) = 6.3, P= 1.7 × 10−4), but non-significant drug effect (F(1,12) = 4.0, P = 0.93) or two-way interaction (F(2,24) = 1.4, P= 0.26). Saline vs. ketamine yielded no difference at 3 dB (32 ± 9%, 39 ± 6%, mean ± s.e.m.), at 6 dB (58 ± 6%, 56 ± 6%, mean ± s.e.m.), and at 9 dB (67 ± 6%, 63 ± 6%, mean ± s.e.m.). n= 13 animals each for saline and ketamine. d Open-field locomotor activity. Each trace comes from a single animal. For control SST-IRES-Cre animals, a two-way ANOVA was performed with epoch (pre-injection, 5–30 min post-injection, and 30–60 min post-injection) and drug (saline, ketamine (10 mg/kg)) as within-subjects factors. There were significant main effects of epoch (F(2,22) = 21.0, P= 7 × 10−5), drug (F(1,11) = 7.1, P = 0.02), and interaction (F(2,22) = 28.5, P = 7 × 10−5). Post-hoc Tukey-Kramer tests for saline vs. ketamine were significant for 5–30 min post-injection (P= 0.001), but non-significant for pre-injection (P= 0.07) and 30–60 min post-injection (P = 0.58). n = 12 animals each for saline and ketamine. For GluN2B-SST KD animals, two-way ANOVA revealed significant main effects of epoch (F(2,22) = 14.1, P= 0.002), drug (F(1,11) = 15.6, P = 0.002), and interaction (F(2,22) = 13.6, P = 0.003). Post-hoc Tukey-Kramer tests for saline vs. ketamine were significant for 5–30 min post-injection epoch (P= 0.003) and 30–60 min post-injection (P = 0.001), but non-significant for pre-injection (P= 1.0). n = 13 animals each for saline and ketamine. *P < 0.05; **P < 0.01; ***P < 0.001; n.s., not significant. Error bars, ± s.e.m.
Fig. 7
Fig. 7. Acute suppression of SST interneuron activity in Cg1/M2 occludes the behavioral effects of ketamine.
a Timeline for experiments involving use of Cre-dependent expression of designer receptors exclusively activated by designer drugs (DREADD) in SST-IRES-Cre animals. b Fraction of time spent freezing during CS+ and trace period, subtracted by that during CS− and trace period on the testing day. For hM4D(Gi) + Vehicle condition, ketamine (10 mg/kg) treatment caused an impairment in freezing compared to saline (saline: 44 ± 7%, ketamine: 4 ± 2%, mean ± s.e.m.; P= 2 × 10−4, Wilcoxon rank-sum test; n= 10 animals for saline and 9 for ketamine). For hM4D(Gi) + CNO condition, there was impairment in freezing in saline-treated animals with no further difference relative to ketamine-treated (10 mg/kg) animals (saline: 5 ± 2%, ketamine: 3 ± 2%, mean ± s.e.m.; P= 0.78, Wilcoxon rank-sum test; n= 9 animals for saline and 10 for ketamine). There was no effect of CNO on ketamine-induced (10 mg/kg) impairment as tested in the mCherry + CNO condition (saline: 39 ± 5%, ketamine: 1.5 ± 1%, mean ± s.e.m.; P= 2 × 10−4, Wilcoxon rank-sum test; n= 10 animals each for saline and ketamine). c Pre-pulse inhibition as a measure of sensorimotor gating. For hM4D(Gi) + Vehicle condition, a two-way within-subjects ANOVA with pre-pulse intensity (3, 6, and 9 dB) and drug (saline, ketamine (40 mg/kg)) as within-subjects factors found significant main effects of pre-pulse intensity (F(2,30) = 30.6, P = 6 × 10−7) and drug (F(1,15) = 21.9, P = 3 × 10−4), and a significant interaction (F(2,30) = 4.0, P = 0.03). Post-hoc Tukey-Kramer’s tests for saline vs. ketamine were significant at 3 dB (22 ± 4%, 6 ± 4%, mean ± s.e.m., P = 0.01), at 6 dB (42 ± 6%, 12 ± 5%, mean ± s.e.m., P = 1 × 10−4), at 9 dB (51 ± 5%, 23 ± 6%, mean ± s.e.m., P = 0.002). n= 16 animals each for saline and ketamine. For hM4D(Gi) + CNO condition, a two-way within-subjects ANOVA found a significant main effect of pre-pulse intensity (F(2,26) = 11.9, P = 2 × 10−4) but a non-significant main effect of drug (F(1,13) = 4.1 P = 0.06) and interaction (F(2,26) = 1.2, P = 0.3). Post-hoc Tukey-Kramer’s tests for saline vs. ketamine were not significant at 3 dB (−14 ± 8%, 1 ± 4%, mean ± s.e.m., P = 0.06), at 6 dB (8 ± 3%, 10 ± 6%, mean ± s.e.m., P = 0.71), at 9 dB (17 ± 5%, 26 ± 4%, mean ± s.e.m., P = 0.16). n= 14 animals each for saline and ketamine. For mCherry + CNO condition, a two-way within-subjects ANOVA found significant main effects of pre-pulse intensity (F(2,28) = 30.4, P = 9 × 10−8) and drug (F(1,14) = 56.0, P = 3 × 10−5), and a non-significant interaction (F(2,28) = 0.5, P = 0.62. Post-hoc Tukey-Kramer’s tests for saline vs. ketamine were significant at 3 dB (27 ± 4%, −3 ± 5%, mean ± s.e.m., P = 5 × 10−4), at 6 dB (49 ± 4%, 12 ± 5%, mean ± s.e.m., P = 1 × 10−5), at 9 dB (58 ± 5%, 24 ± 7%, mean ± s.e.m., P = 1 × 10−5). n = 16 animals each for saline and ketamine. *P < 0.05; **P < 0.01; ***P < 0.001; n.s., not significant.
Fig. 8
Fig. 8. Elevated prefrontal cortical functional connectivity depends on dendritic inhibition.
a Left, schematic of experimental setup. Right, spectrogram of an example local field potential (LFP) recording in Cg1/M2 of a SST-IRES-Cre animal. Dashed lines indicate the upper and lower bounds of the frequency range used to calculate the integrated gamma band signal, which is plotted below the spectrogram. b Integrated gamma band signals from LFPs recorded simultaneously from Cg1/M2 (solid line) and RSC (dashed line) of a SST-IRES-Cre animal. Example signals were plotted before (black) and after (red) ketamine (10 mg/kg) injection. c Network-scale effects of prefrontal cortical SST interneuron manipulations (SST-IRES-Cre animals with or without GluN2B-SST KD). Functional connectivity between Cg1/M2 and RSC was quantified by determining the correlation and coherence between integrated gamma band signals of the two brain regions. At baseline prior to injection, control and GluN2B-SST KD animals had significantly different correlation coefficients (controls: 0.48 ± 0.08, GluN2B-SST KD: 0.72 ± 0.05, mean ± s.e.m.; P = 0.03, Wilcoxon rank sum test) and coherence magnitude (controls: 0.53 ± 0.07, GluN2B-SST KD: 0.73 ± 0.05, mean ± s.e.m.; P = 0.04, Wilcoxon rank sum test). n = 8 animals each for controls and GluN2B-SST KD. d Functional connectivity between Cg1/M2 and RSC after ketamine (10 mg/kg) or saline for SST-IRES-Cre animals with or without GluN2B-SST KD. For correlation, a two-way mixed ANOVA was performed with treatment (GluN2B-SST KD, no KD) as the between factor, and drug (saline, ketamine) as the within factor. The interaction effect was significant (F(1,14) = 6.2, P = 0.03). Post-hoc Tukey-Kramer test showed a significant ketamine-saline difference in the no KD group (P = 0.003), but not in the GluN2B-SST KD group (P = 0.9). For coherence, the interaction effect was significant (F(1,14) = 7.1, P = 0.02). Post-hoc Tukey-Kramer test showed a significant ketamine-saline difference in the no KD group (P = 0.003), but not in the GluN2B-SST KD group (P = 0.8). n = 8 animals each for controls and GluN2B-SST KD. *P < 0.05; **P < 0.01; ***P < 0.001; n.s., not significant.

References

    1. Krystal JH, et al. Subanesthetic effects of the noncompetitive NMDA antagonist, ketamine, in humans: psychotomimetic, perceptual, cognitive, and neuroendocrine responses. Arch. Gen. Psychiatry. 1994;51:199–214. doi: 10.1001/archpsyc.1994.03950030035004. - DOI - PubMed
    1. Kantrowitz JT, Javitt DC. N-methyl-d-aspartate (NMDA) receptor dysfunction or dysregulation: the final common pathway on the road to schizophrenia? Brain Res. Bull. 2010;83:108–121. doi: 10.1016/j.brainresbull.2010.04.006. - DOI - PMC - PubMed
    1. Moghaddam B, Javitt D. From revolution to evolution: the glutamate hypothesis of schizophrenia and its implication for treatment. Neuropsychopharmacology. 2012;37:4–15. doi: 10.1038/npp.2011.181. - DOI - PMC - PubMed
    1. Berman RM, et al. Antidepressant effects of ketamine in depressed patients. Biol. Psychiatry. 2000;47:351–354. doi: 10.1016/S0006-3223(99)00230-9. - DOI - PubMed
    1. Zarate CA, et al. A randomized trial of an N-methyl-D-aspartate antagonist in treatment-resistant major depression. Arch. Gen. Psychiatry. 2006;63:856–864. doi: 10.1001/archpsyc.63.8.856. - DOI - PubMed

Publication types

LinkOut - more resources