

Heritability estimates for 361 blood metabolites across 40 genome-wide association studies
- PMID: 31911595
- PMCID: PMC6946682
- DOI: 10.1038/s41467-019-13770-6
Heritability estimates for 361 blood metabolites across 40 genome-wide association studies
Erratum in
-
Author Correction: Heritability estimates for 361 blood metabolites across 40 genome-wide association studies.Nat Commun. 2020 Mar 31;11(1):1702. doi: 10.1038/s41467-020-15276-y. Nat Commun. 2020. PMID: 32235831 Free PMC article.
Abstract
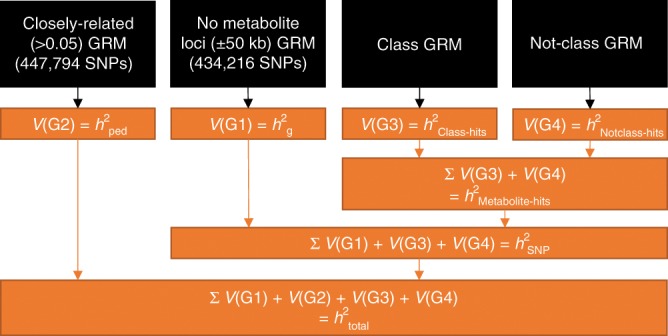
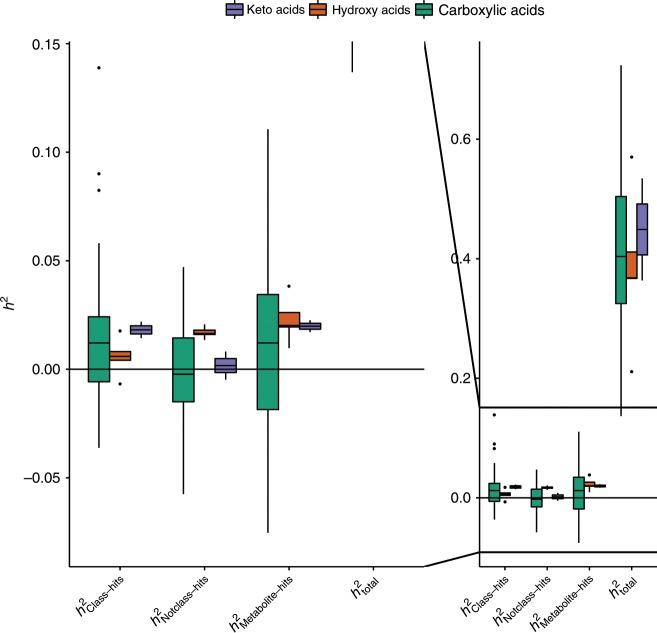
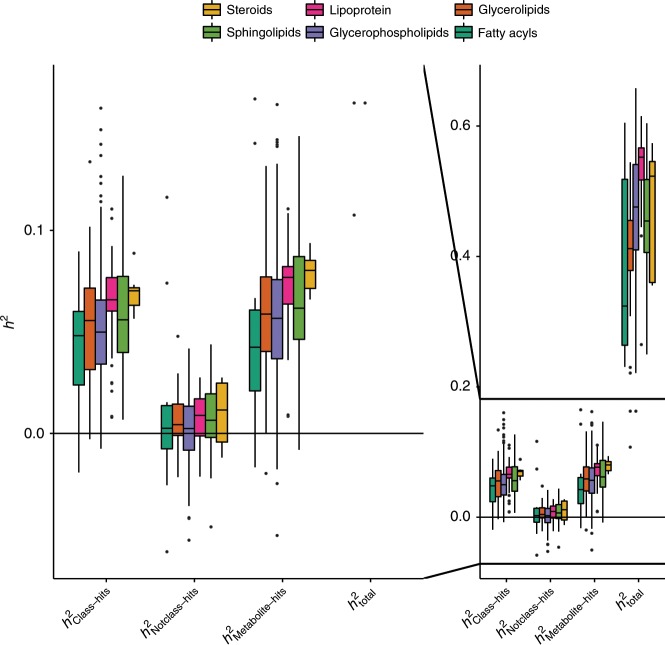
Metabolomics examines the small molecules involved in cellular metabolism. Approximately 50% of total phenotypic differences in metabolite levels is due to genetic variance, but heritability estimates differ across metabolite classes. We perform a review of all genome-wide association and (exome-) sequencing studies published between November 2008 and October 2018, and identify >800 class-specific metabolite loci associated with metabolite levels. In a twin-family cohort (N = 5117), these metabolite loci are leveraged to simultaneously estimate total heritability (h2total), and the proportion of heritability captured by known metabolite loci (h2Metabolite-hits) for 309 lipids and 52 organic acids. Our study reveals significant differences in h2Metabolite-hits among different classes of lipids and organic acids. Furthermore, phosphatidylcholines with a high degree of unsaturation have higher h2Metabolite-hits estimates than phosphatidylcholines with low degrees of unsaturation. This study highlights the importance of common genetic variants for metabolite levels, and elucidates the genetic architecture of metabolite classes.
Conflict of interest statement
The authors declare no competing interests.
Figures
Similar articles
-
A Comparison of Heritability Estimates by Classical Twin Modeling and Based on Genome-Wide Genetic Relatedness for Cardiac Conduction Traits.Twin Res Hum Genet. 2017 Dec;20(6):489-498. doi: 10.1017/thg.2017.55. Epub 2017 Oct 17. Twin Res Hum Genet. 2017. PMID: 29039294
-
Insight in genome-wide association of metabolite quantitative traits by exome sequence analyses.PLoS Genet. 2015 Jan 8;11(1):e1004835. doi: 10.1371/journal.pgen.1004835. eCollection 2015 Jan. PLoS Genet. 2015. PMID: 25569235 Free PMC article.
-
Genetic regulation of mouse liver metabolite levels.Mol Syst Biol. 2014 May 23;10(5):730. doi: 10.15252/msb.20135004. Mol Syst Biol. 2014. PMID: 24860088 Free PMC article.
-
Genome-Wide Association Studies of Metabolite Concentrations (mGWAS): Relevance for Nephrology.Semin Nephrol. 2018 Mar;38(2):151-174. doi: 10.1016/j.semnephrol.2018.01.009. Semin Nephrol. 2018. PMID: 29602398 Review.
-
Twin, association and current "omics" studies.J Matern Fetal Neonatal Med. 2013 Oct;26 Suppl 2:9-12. doi: 10.3109/14767058.2013.830405. J Matern Fetal Neonatal Med. 2013. PMID: 24059544 Review.
Cited by
-
Depicting the genetic and metabolic panorama of chemical diversity in the tea plant.Plant Biotechnol J. 2024 Apr;22(4):1001-1016. doi: 10.1111/pbi.14241. Epub 2023 Dec 4. Plant Biotechnol J. 2024. PMID: 38048231 Free PMC article.
-
Longitudinal multi-omics study reveals common etiology underlying association between plasma proteome and BMI trajectories in adolescent and young adult twins.BMC Med. 2023 Dec 21;21(1):508. doi: 10.1186/s12916-023-03198-7. BMC Med. 2023. PMID: 38129841 Free PMC article.
-
Small phenolic and indolic gut-dependent molecules in the primate central nervous system: levels vs. bioactivity.Metabolomics. 2022 Jan 6;18(1):8. doi: 10.1007/s11306-021-01866-4. Metabolomics. 2022. PMID: 34989922
-
Heritability and genetic correlations of plasma metabolites of pigs with production, resilience and carcass traits under natural polymicrobial disease challenge.Sci Rep. 2021 Oct 19;11(1):20628. doi: 10.1038/s41598-021-99778-9. Sci Rep. 2021. PMID: 34667249 Free PMC article.
-
Genomic prediction for yield and malting traits in barley using metabolomic and near-infrared spectra.Theor Appl Genet. 2025 Jan 9;138(1):24. doi: 10.1007/s00122-024-04806-7. Theor Appl Genet. 2025. PMID: 39786601 Free PMC article.
References
Publication types
MeSH terms
Grants and funding
LinkOut - more resources
Full Text Sources
Medical
