. 2020 Jan 7;11(1):73.
doi: 10.1038/s41467-019-13892-x.

Single-cell analysis based dissection of clonality in myelofibrosis

Affiliations

Single-cell analysis based dissection of clonality in myelofibrosis

Elena Mylonas et al. Nat Commun. .

Abstract

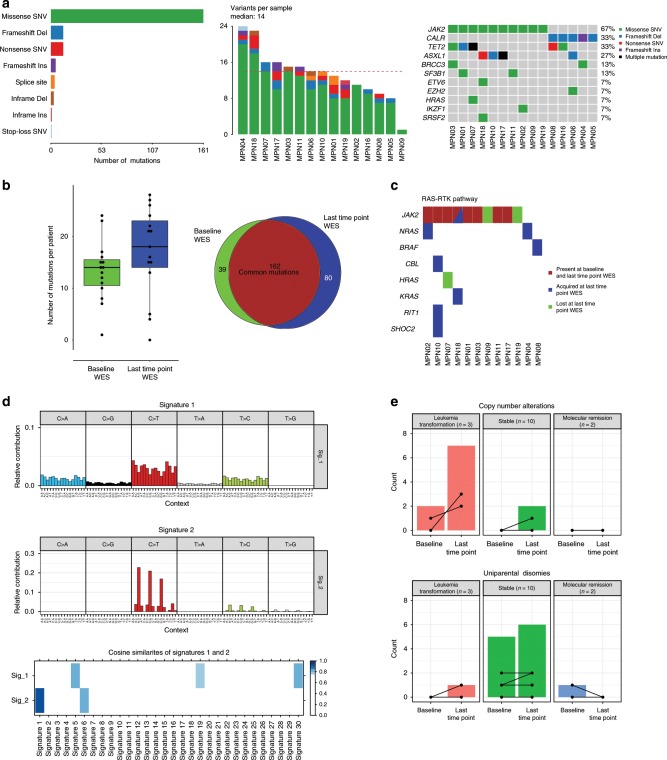
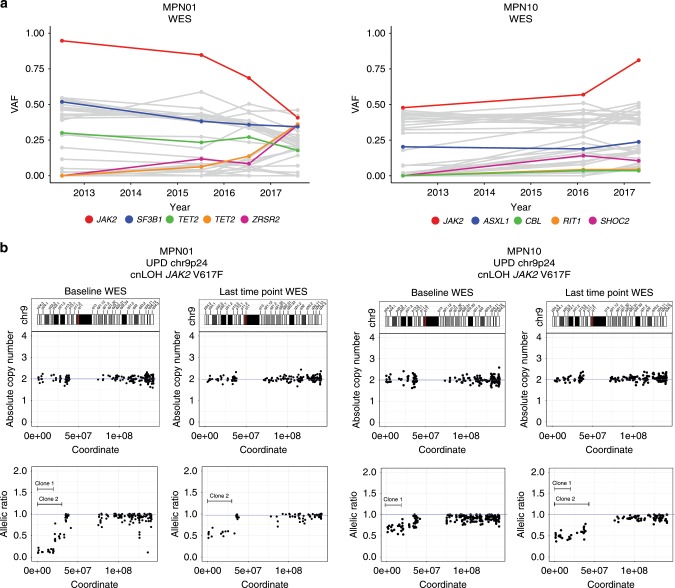
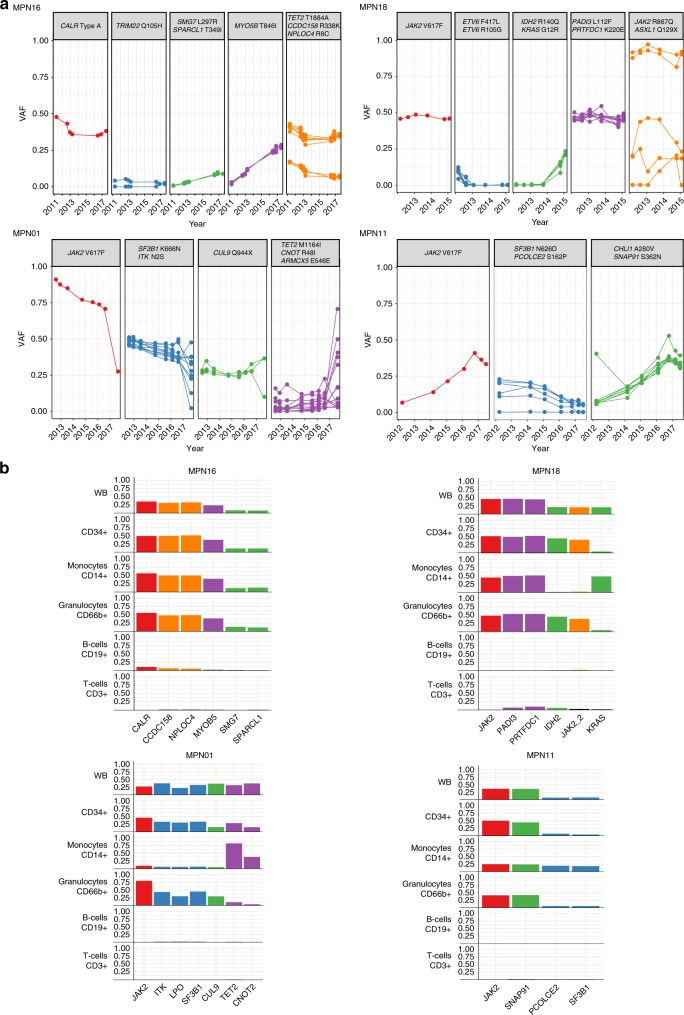
Cancer development is an evolutionary genomic process with parallels to Darwinian selection. It requires acquisition of multiple somatic mutations that collectively cause a malignant phenotype and continuous clonal evolution is often linked to tumor progression. Here, we show the clonal evolution structure in 15 myelofibrosis (MF) patients while receiving treatment with JAK inhibitors (mean follow-up 3.9 years). Whole-exome sequencing at multiple time points reveal acquisition of somatic mutations and copy number aberrations over time. While JAK inhibition therapy does not seem to create a clear evolutionary bottleneck, we observe a more complex clonal architecture over time, and appearance of unrelated clones. Disease progression associates with increased genetic heterogeneity and gain of RAS/RTK pathway mutations. Clonal diversity results in clone-specific expansion within different myeloid cell lineages. Single-cell genotyping of circulating CD34 + progenitor cells allows the reconstruction of MF phylogeny demonstrating loss of heterozygosity and parallel evolution as recurrent events.


Conflict of interest statement

The authors declare the following competing interests: F.D. received research funding from Novartis. P.C. received speakers honoraria from Novartis, BM, Pfizer, and Incyte. All other authors declare no competing interests.

Figures

Fig. 1
Fig. 1. Mutational landscape in MF.
a Type, number, and most frequent mutations in 15 MF patients. b Number of gained and lost mutations comparing baseline and last time point WES. c Mutations affecting genes of the RAS-RTK pathways. d Mutation signatures analysis identified two main signatures at baseline and last time point WES and their respective cosine similarities with established COSMIC signatures. e Number of CNA and CN-LOH per patient. Source data are provided as a Source Data file.
Fig. 2
Fig. 2. Multiple CN-LOH affecting the JAK2 V617 locus.
a Tracking variant allele frequency by serial WES in two patients with JAK2 CN-LOH. Each patient has multiple time points analyzed (MPN01: n = 4; MPN10: n = 3) with at least 5-years of follow-up. Known driver genes with mutation are shown as colored lines, with other genes shown as gray lines. b Depiction of evolution of multiple chromosome 9p acquired UPDs over time by analysis of baseline and last time point WES data. Chromosome 9 ideogram with bands (top), absolute copy number (middle) and allelic ratio (bottom) values ordered by genomic coordinates. Independent clones are indicated by butted lines. Source data are provided as a Source Data file.
Fig. 3
Fig. 3. VAF-based clonal evolution analysis and allele burden quantification in flow-sorted cell fractions.
a Mutations clustered by VAF generated from ultra-deep sequencing at various follow-up time points. Disease-defining mutations in JAK2/CALR are depicted independently to emphasize their specific role in disease pathogenesis. From each cluster representative mutated genes were selected. b Representative mutation distribution in different blood lineages. Patients with differential segregation of mutations are displayed. Bar color correspond to respective clones shown in a. Source data are provided as a Source Data file.
Fig. 4
Fig. 4. Phylogeny of CD34 + progenitors in MF and proportion of subclones.
MPN01 shows two independently originated clones, marked by a JAK2 V617F and TET2 M1164I mutation, respectively. Both MPN01 and MPN10 represent samples with multiple clones (cell genotypes) present with similar subclonal frequency. MPN17 and MPN18 represent samples with a dominant clone and few additional subclones. MPN01, MPN10, and MPN17 show parallel evolution of 9pUPDs (indicated by “JAK2 (LOH)” in red text). Top panel: bar chart displaying the proportion of each observed subclone. Middle panel: genotype matrix for each subclone. Bottom panel: Evolutionary trees generated by analysis of the single-cell data. In each patient a single- phylogenetic tree was constructed and displayed as a vertically oriented rectangular cladogram. The root of the tree harbors either a JAK mutation (MPN10, MPN17, and MPN18) or a wild-type cell genotype (MPN01). Branch lengths are indicated (proportional to the number of evolutionary changes inferred) and the internal nodes (the points at which branches diverge) represent the ancestral clade from which arise all genotypes at the leaves/tips of the tree (descendant subclones). Source data are provided as a Source Data file.
Fig. 5
Fig. 5. Phylogenetic Tree of CD34+ progenitors and proportion of clones in MPN04.
MPN04 showed a complete change in clonal architecture due to an acquired LOH of FGF1 V66M on chromosome 5q31 between the two investigated time points (before and after leukemic transformation). At first time point, a dominant clone harboring mutations in CALR, FGF1, SUZ12, and TRPM5 was present, from which a subclone acquired a del(5)(q23-q32), leading to wild-type FGF1. At the second time point, this subclone developed additional genetic abnormalities affecting CALR and TRPM5. Top panel: bar chart displaying the proportion of each observed subclone. Middle panel: genotype matrix for each subclone. Bottom panel: Evolutionary trees generated by analysis of the single-cell data. A single-phylogenetic tree was constructed and displayed as a vertically oriented rectangular cladogram. The root of the tree harbors a wild-type cell genotype. Branch lengths are indicated (proportional to the number of evolutionary changes inferred) and the internal nodes (the points at which branches diverge) represent the ancestral clade from which arise all genotypes at the leaves/ tips of the tree (descendant subclones). Source data are provided as a Source Data file.

References

    1. Hanahan D, Weinberg RA. Hallmarks of cancer: the next generation. Cell. 2011;144:646–674. doi: 10.1016/j.cell.2011.02.013. - DOI - PubMed
    1. Greaves M, Maley CC. Clonal evolution in cancer. Nature. 2012;481:306–313. doi: 10.1038/nature10762. - DOI - PMC - PubMed
    1. Merlo LM, Pepper JW, Reid BJ, Maley CC. Cancer as an evolutionary and ecological process. Nat. Rev. Cancer. 2006;6:924–935. doi: 10.1038/nrc2013. - DOI - PubMed
    1. Nowell PC. The clonal evolution of tumor cell populations. Science. 1976;194:23–28. doi: 10.1126/science.959840. - DOI - PubMed
    1. Trent JM, Buick RN, Olson S, Horns RC, Jr., Schimke RT. Cytologic evidence for gene amplification in methotrexate-resistant cells obtained from a patient with ovarian adenocarcinoma. J. Clin. Oncol. 1984;2:8–15. doi: 10.1200/JCO.1984.2.1.8. - DOI - PubMed

Publication types

Substances