. 2020 Jan 7;11(1):8.
doi: 10.1038/s41467-019-13858-z.

Automated mass spectrometry imaging of over 2000 proteins from tissue sections at 100-μm spatial resolution

Affiliations

Automated mass spectrometry imaging of over 2000 proteins from tissue sections at 100-μm spatial resolution

Paul D Piehowski et al. Nat Commun. .

Abstract

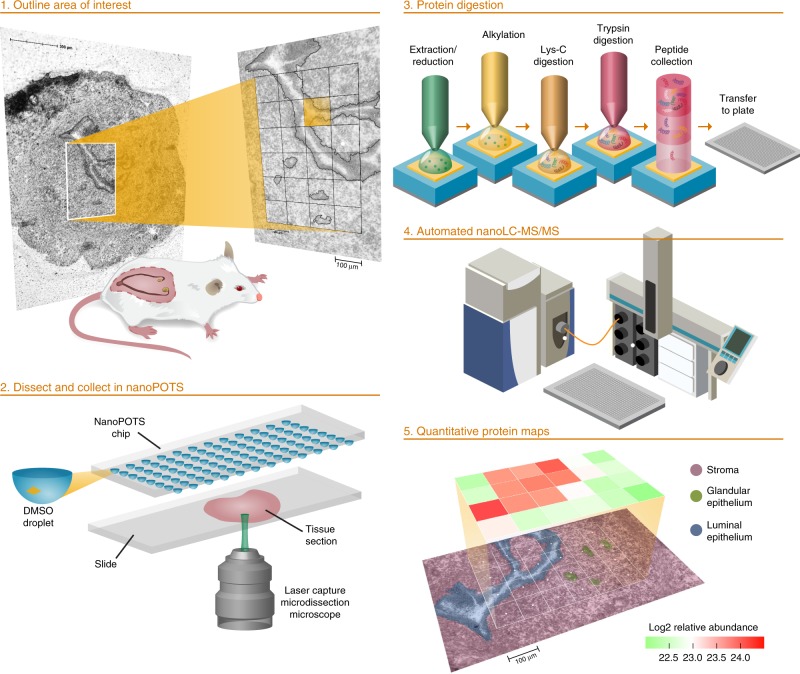
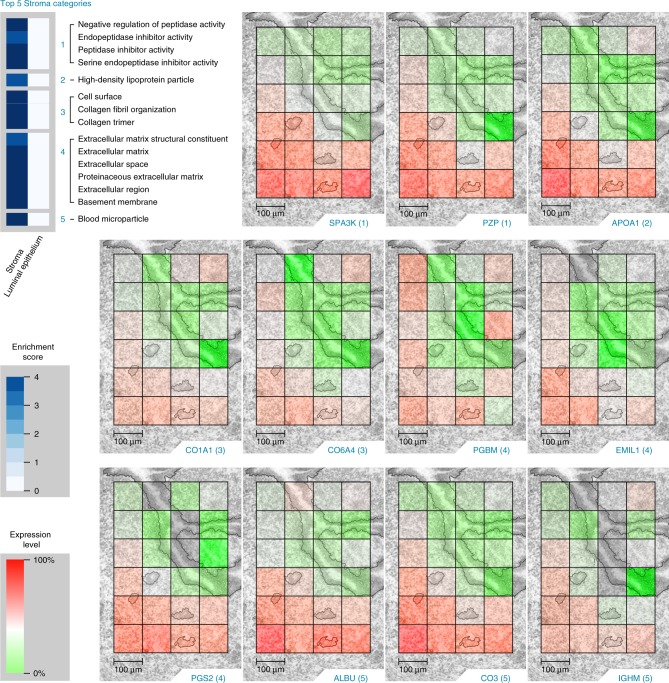
Biological tissues exhibit complex spatial heterogeneity that directs the functions of multicellular organisms. Quantifying protein expression is essential for elucidating processes within complex biological assemblies. Imaging mass spectrometry (IMS) is a powerful emerging tool for mapping the spatial distribution of metabolites and lipids across tissue surfaces, but technical challenges have limited the application of IMS to the analysis of proteomes. Methods for probing the spatial distribution of the proteome have generally relied on the use of labels and/or antibodies, which limits multiplexing and requires a priori knowledge of protein targets. Past efforts to make spatially resolved proteome measurements across tissues have had limited spatial resolution and proteome coverage and have relied on manual workflows. Here, we demonstrate an automated approach to imaging that utilizes label-free nanoproteomics to analyze tissue voxels, generating quantitative cell-type-specific images for >2000 proteins with 100-µm spatial resolution across mouse uterine tissue sections preparing for blastocyst implantation.


Conflict of interest statement

The authors declare no competing interests.

Figures

Fig. 1
Fig. 1. Schematic workflow for high-throughput, spatially resolved proteomics using the nanoPOTS imaging platform.
The authors thank PNNL Graphic Designer Nathan Johnson for preparing the figure.
Fig. 2
Fig. 2. Reproducibility of nanoPOTS analysis on liver tissue.
a Mean number of peptide identifications from four replicate analyses of liver tissue voxels at different lateral resolutions, with and without MBR enabled. b Mean number of protein identifications from four replicate analyses of liver tissue voxels at different lateral resolutions, with and without MBR enabled. c Histogram of protein LFQ intensity coefficient of variation (CV) for 20 replicate voxels from homogeneous tissue sections. Error bars, standard deviation.
Fig. 3
Fig. 3. Pseudocolor optical micrographs of the imaged tissue sections with voxel pattern overlay.
a Stromal-dominant image and b luminal epithelium-dominant image. Scale bar, 100 µm. The authors thank PNNL Graphic Designer Nathan Johnson for preparing the figure.
Fig. 4
Fig. 4. The top six luminal epithelium (LE) Gene Ontology categories (top, left) enriched in the statistically significant (Tukey-adjusted ANOVA or a Holm-adjusted g test, p value <0.05) proteins from the dominant cell population study and the corresponding protein images.
(1) Armadillo repeat protein deleted in velo-cardio-facial syndrome homolog (ARVC), reticulon-4 (RTN4), and CD166 antigen (CD166); (2) junctional adhesion molecule A (JAM1); (3) voltage-dependent anion-selective channel protein 2 (VDAC2); (4) coronin-2A (COR2A); (5) annexin A1 (ANXA1), keratin type I cytoskeletal 19 (K1C19), and catenin beta-1 (CTNB1); (6) erlin-2 (ERLN2), a neutral cholesterol ester hydrolase 1 (NCEH1). Scale bars, 100 µm. The authors thank PNNL Graphic Designer Nathan Johnson for preparing the figure.
Fig. 5
Fig. 5. The top 5 stroma (S) Gene Ontology categories (top, left) enriched in the statistically significant (Tukey-adjusted ANOVA or a Holm-adjusted g test, p value <0.05) proteins from the dominant cell population study and the corresponding protein images.
(1) Serine protease inhibitor A3K (SPA3K), pregnancy zone protein (PZP); (2) apolipoprotein A-I (APOA1); (3) collagen alpha-1(I) chain (CO1A1), collagen alpha-4(VI) chain (CO6A4); (4) basement membrane-specific heparan sulfate proteoglycan core protein (PGBM), EMILIN-1 (EMIL1), Decorin (PGS2); (5) serum albumin (ALBU), complement C3 (CO3), and immunoglobulin heavy constant mu (IGHM). Scale bars, 100 µm. The authors thank PNNL Graphic Designer Nathan Johnson for preparing the figure.
Fig. 6
Fig. 6. Arachidonic acid metabolism localizes to the luminal epithelium.
Prostaglandin H2 (PGH2), prostaglandin E2 (PGE2), 12(S)-hydroperoxyeicosatetraenoic acid (12(S)-HpETE), 15(S)-hydroperoxyeicosatetraenoic acid (15(S)-HpETE). The authors thank PNNL Graphic Designer Nathan Johnson for preparing the figure.

References

    1. Amstalden van Hove ER, Smith DF, Heeren RM. A concise review of mass spectrometry imaging. J. Chromatogr. A. 2010;1217:3946–3954. doi: 10.1016/j.chroma.2010.01.033. - DOI - PubMed
    1. Vaysse PM, Heeren RMA, Porta T, Balluff B. Mass spectrometry imaging for clinical research—latest developments, applications, and current limitations. Analyst. 2017;142:2690–2712. doi: 10.1039/C7AN00565B. - DOI - PubMed
    1. Spraggins JM, et al. MALDI FTICR IMS of intact proteins: using mass accuracy to link protein images with proteomics data. J. Am. Soc. Mass Spectrom. 2015;26:974–985. doi: 10.1007/s13361-015-1147-5. - DOI - PMC - PubMed
    1. van de Ven SM, et al. Protein biomarkers on tissue as imaged via MALDI mass spectrometry: a systematic approach to study the limits of detection. Proteomics. 2016;16:1660–1669. doi: 10.1002/pmic.201500515. - DOI - PubMed
    1. Hsu CC, Chou PT, Zare RN. Imaging of proteins in tissue samples using nanospray desorption electrospray ionization mass spectrometry. Anal. Chem. 2015;87:11171–11175. doi: 10.1021/acs.analchem.5b03389. - DOI - PubMed

Publication types