

Microbial imbalance in inflammatory bowel disease patients at different taxonomic levels
- PMID: 31911822
- PMCID: PMC6942256
- DOI: 10.1186/s13099-019-0341-6
Microbial imbalance in inflammatory bowel disease patients at different taxonomic levels
Abstract
Background: Inflammatory bowel disease (IBD), is a debilitating group of chronic diseases including Crohn's Disease (CD) and ulcerative colitis (UC), which causes inflammation of the gut and affects millions of people worldwide. At different taxonomic levels, the structure of the gut microbiota is significantly altered in IBD patients compared to that of healthy individuals. However, it is unclear how these IBD-affected bacterial groups are related to other common bacteria in the gut, and how they are connected across different disease conditions at the global scale.
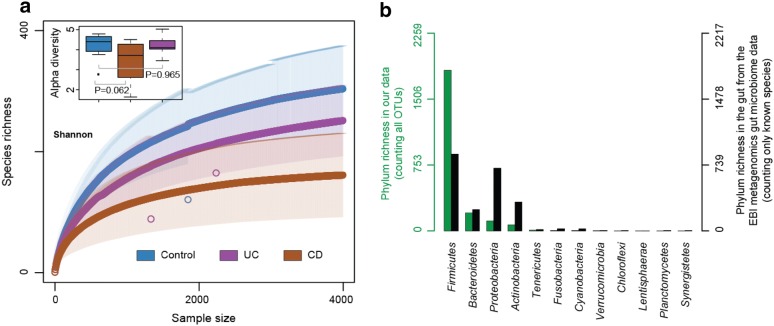
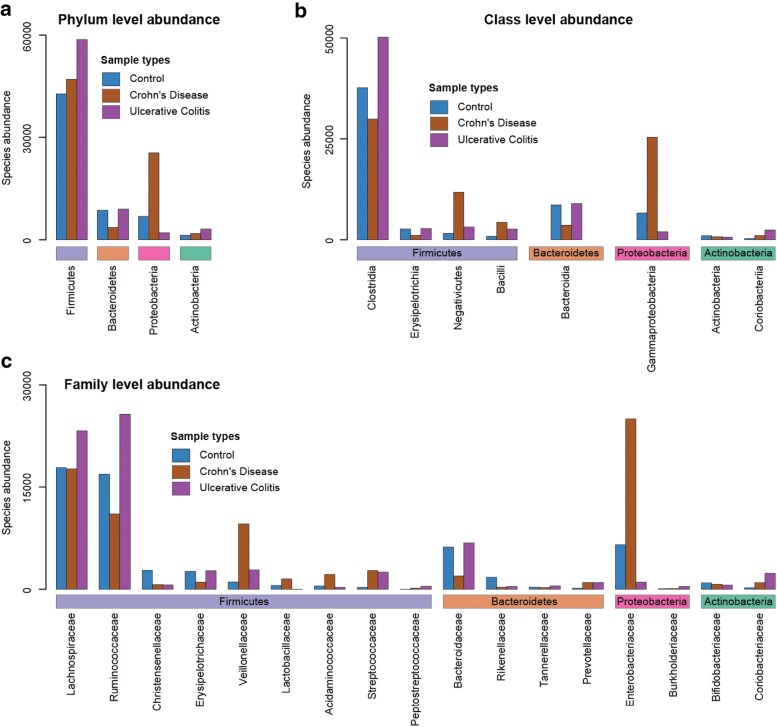
Results: In this study, using faecal samples from patients with IBD, we show through diversity analysis of the microbial community structure based on the 16S rRNA gene that the gut microbiome of IBD patients is less diverse compared to healthy individuals. Furthermore, we have identified which bacterial groups change in abundance in both CD and UC compared to healthy controls. A substantial imbalance was observed across four major bacterial phyla including Firmicutes, Bacteroidetes, Proteobacteria and Actinobacteria, which together constitute > 98% of the gut microbiota. Next, we reconstructed a bacterial family co-abundance network based on the correlation of abundance profiles obtained from the public gut microbiome data of > 22,000 samples of faecal and gut biopsies taken from both diseased and healthy individuals. The data was compiled using the EBI metagenomics database (Mitchell et al. in Nucleic Acids Res 46:D726-D735, 2018). By mapping IBD-altered bacterial families to the network, we show that the bacterial families which exhibit an increased abundance in IBD conditions are not well connected to other groups, implying that these families generally do not coexist together with common gut organisms. Whereas, the bacterial families whose abundance is reduced or did not change in IBD conditions compared to healthy conditions are very well connected to other bacterial groups, suggesting they are highly important groups of bacteria in the gut that can coexist with other bacteria across a range of conditions.
Conclusions: IBD patients exhibited a less diverse gut microbiome compared to healthy individuals. Bacterial groups which changed in IBD patients were found to be groups which do not co-exist well with common commensal gut bacteria, whereas bacterial groups which did not change in patients with IBD were found to commonly co-exist with commensal gut microbiota. This gives a potential insight into the dynamics of the gut microbiota in patients with IBD.
Keywords: Crohn’s disease; Gut microbiota; Inflammatory bowel disease; Microbial imbalance; Ulcerative colitis.
© The Author(s) 2020.
Conflict of interest statement
Competing interestsThe authors declare that they have no competing interests.
Figures

References
-
- Mozdiak E, O’Malley J, Arasaradnam R. Inflammatory bowel disease. BMJ. 2015. h4416. - PubMed
Grants and funding
LinkOut - more resources
Full Text Sources
Other Literature Sources
