. 2020 Jan 1;4(1):26-39.
doi: 10.7150/ntno.38092. eCollection 2020.

FGF2 engineered SPIONs attenuate tumor stroma and potentiate the effect of chemotherapy in 3D heterospheroidal model of pancreatic tumor

Affiliations

FGF2 engineered SPIONs attenuate tumor stroma and potentiate the effect of chemotherapy in 3D heterospheroidal model of pancreatic tumor

Deby Fajar Mardhian et al. Nanotheranostics. .

Abstract

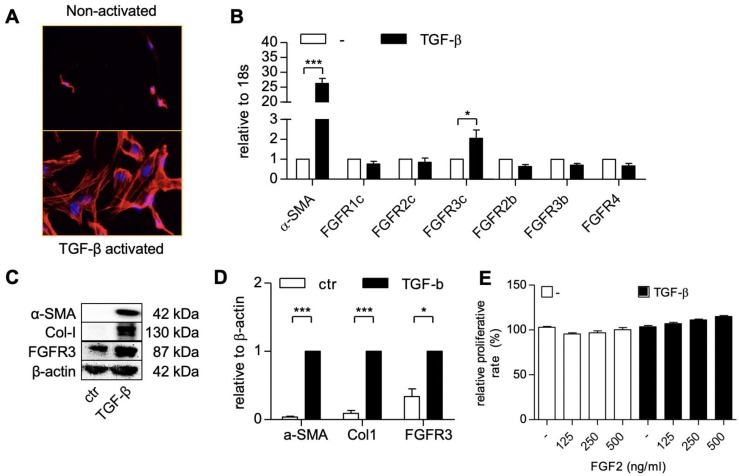
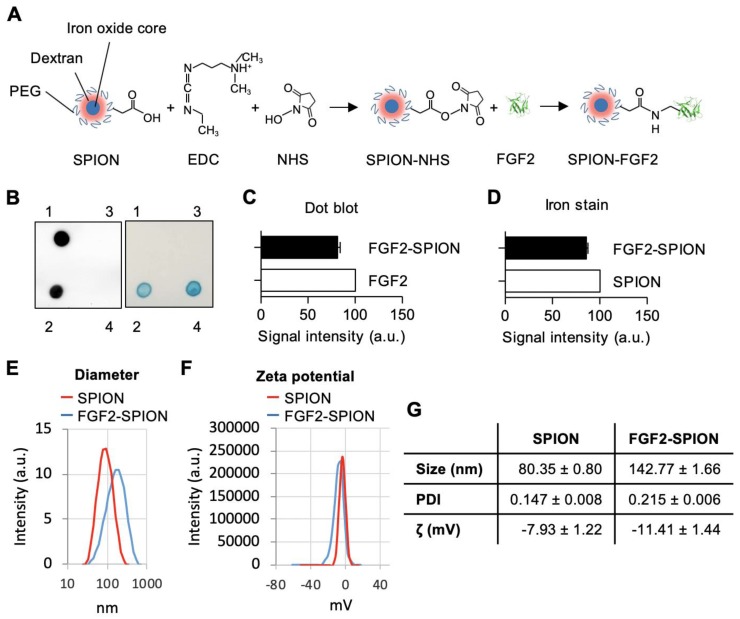
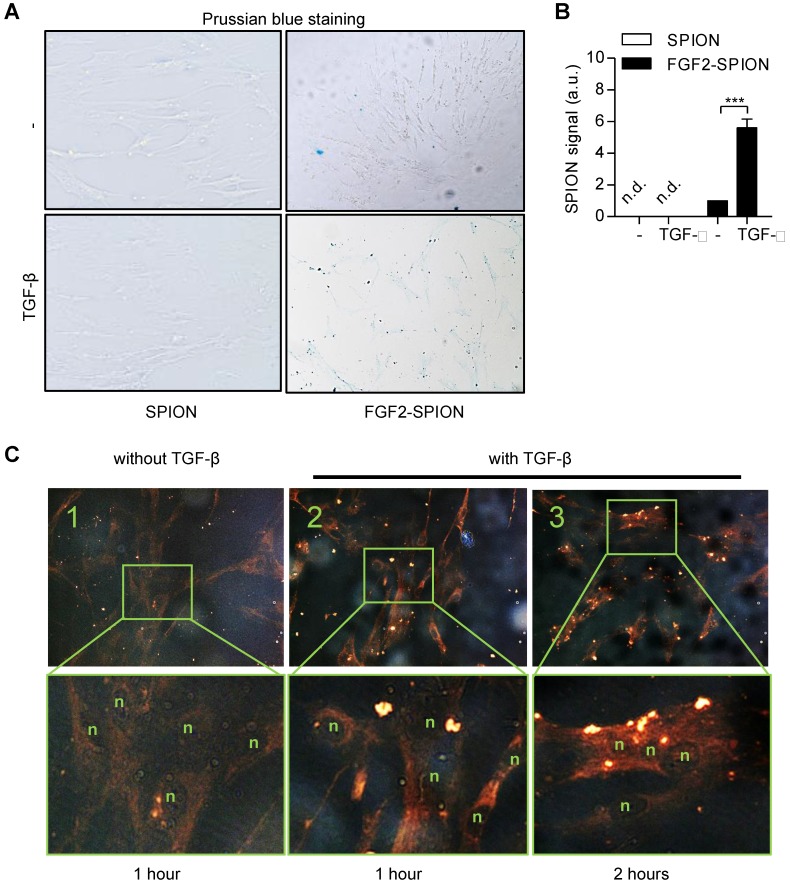
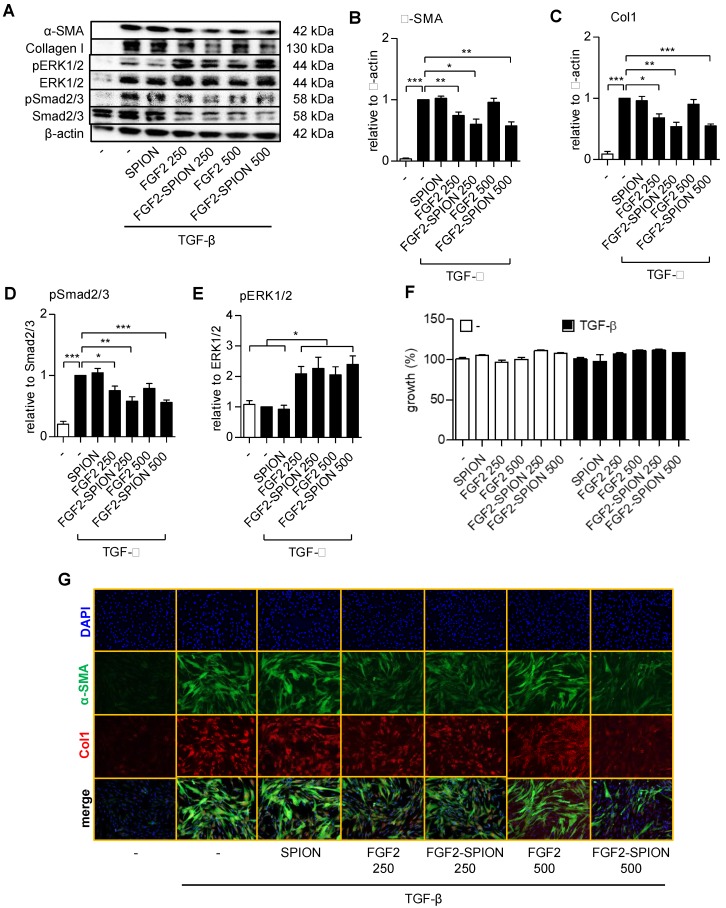
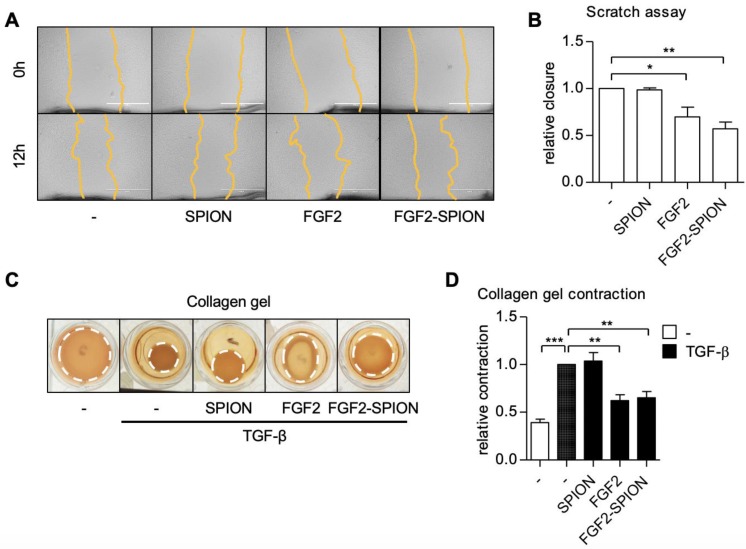
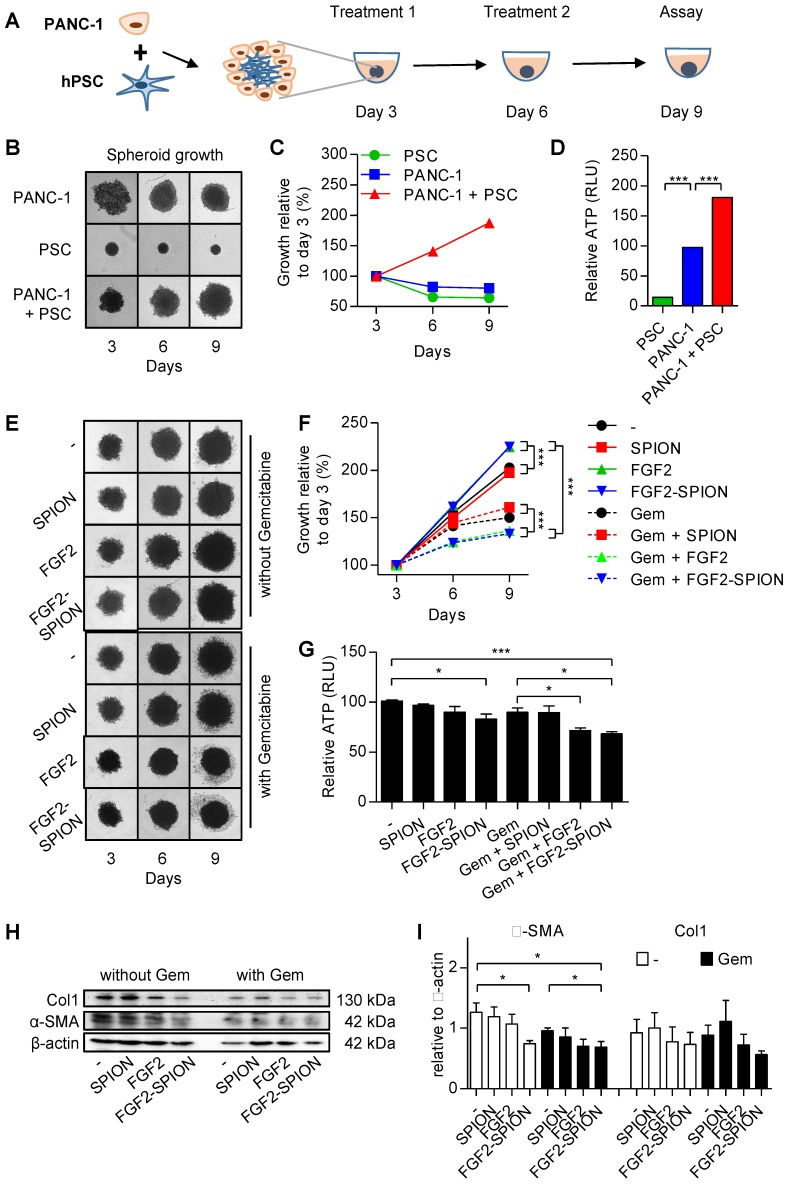
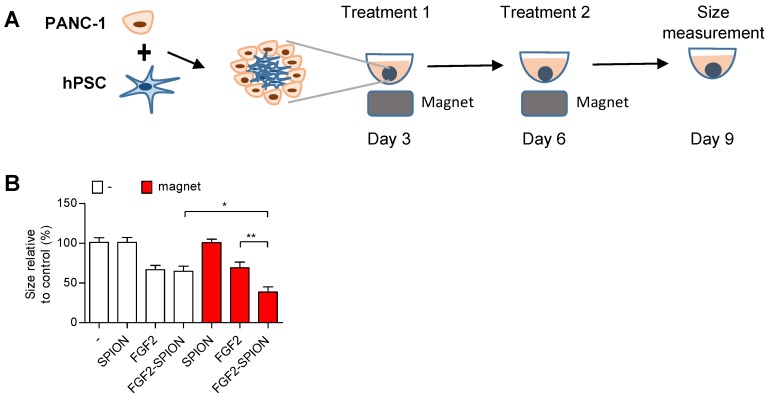
Pancreatic ductal adenocarcinoma (PDAC), characterized with abundant tumor stroma, is a highly malignant tumor with poor prognosis. The tumor stroma largely consists of cancer-associated fibroblasts (CAFs) and extracellular matrix (ECM), and is known to promote tumor growth and progression as well as acts as a barrier to chemotherapy. Inhibition of tumor stroma is highly crucial to induce the effect of chemotherapy. In this study, we delivered fibroblast growth factor 2 (FGF2) to human pancreatic stellate cells (hPSCs), the precursors of CAFs, using superparamagnetic iron oxide nanoparticles (SPIONs). FGF2 was covalently conjugated to functionalized PEGylated dextran-coated SPIONs. FGF2-SPIONs significantly reduced TGF-β induced hPSCs differentiation (α-SMA and collagen-1 expression) by inhibiting pSmad2/3 signaling and inducing ERK1/2 activity, as shown with western blot analysis. Then, we established a stroma-rich self-assembling 3D heterospheroid model by co-culturing PANC-1 and hPSCs in 3D environment. We found that FGF2-SPIONs treatment alone inhibited the tumor stroma-induced spheroid growth. In addition, they also potentiated the effect of gemcitabine, as shown by measuring the spheroid size and ATP content. These effects were attributed to the reduced expression of the hPSC activation and differentiation marker, α-SMA. Furthermore, to demonstrate an application of SPIONs, we applied an external magnetic field to spheroids while incubated with FGF2-SPIONs. This resulted in an enhanced effect of gemcitabine in our 3D model. In conclusion, this study presents a novel approach to target FGF2 to tumor stroma using SPIONs and thereby enhancing the effect of gemcitabine as demonstrated in the complex 3D tumor spheroid model.

Keywords: cancer-associated fibroblasts; fibroblast growth factor 2; pancreatic cancer; pancreatic stellate cells; superparamagnetic iron oxide nanoparticles.


Conflict of interest statement

Competing Interests: The authors have declared that no competing interest exists.

Figures

Figure 1
Figure 1
hPSCs activation and the expression of the human fibroblast growth factor 2 (FGF2) receptors in hPSC. F-actin staining (A) showing morphological changes in hPSCs after treated with 5 ng/ml TGF-β for 24h. Gene expression of α-SMA and FGFR-1c, -2c, -3c, -2b, -3b, -4. (B) in hPSCs after treated with 5 ng/ml TGF-β for 24h. Western blot (C) and quantification (D) showing protein expression of α-SMA, col1, and FGFR3 after treated with 5 ng/ml TGF-β for 48h. (E) Relative growth of cells after 48 hours treatment with FGF2 at different concentration and with or without TGF-β indicating no toxic effect exhibited by FGF2 at mentioned concentration. Data represents mean + SEM for at least 3 independent experiments. Statistical differences are *p<.05, ***p<.001.
Figure 2
Figure 2
Preparation and characterization of FGF2-SPION. (A) Schematic representation of conjugation of FGF2 to SPION using carbodiimide chemistry. Immunoblot and iron staining (B) and quantification of FGF2 (C) and iron (D) showing successful conjugation and recovery. Labels 1-4 denote FGF2, FGF2-SPIONs, supernatant and SPIONs, respectively. Histograms of dynamic light scattering (E), zeta potential (F), and detailed physiochemical data (G) for SPION and FGF2-SPION. Data represents mean + SEM for at least 3 independent synthesis.
Figure 3
Figure 3
Binding of FGF2-SPION on non-activated hPSCs and activated hPSCs. Microscopic images (A) and quantitation (B) showing Prussian blue staining to detect iron oxide in hPSCs incubated with SPIONs or FGF2-SPIONs on non-activated hPSCs and TGF-β activated hPSCs. Representative images (C) of non-activated hPSCs (1) and hPSCs treated with 5 ng/ml TGF-β for 24 h (2, 3) and incubated with FGF2-SPION showing uptake of nanoparticles at 2 h incubation. (n) indicates nuclei. Data represents mean + SEM for at least 3 independent experiments. Statistical difference is ***p<0.001.
Figure 4
Figure 4
Effect of FGF2-SPION on the differentiation of hPSCs. Western blot (A) and quantitation showing the effect of FGF2 and FGF2-SPIONs at 250 ng/ml and 500 ng/ml on the protein expression of α-SMA (B), collagen-1 (col-1) (C) in hPSCs activated with 5 ng/ml TGF-β for 48 h compared to untreated hPSCs. Western blot and quantification showing the effect of FGF2 and FGF2-SPIONs on the phosphorylation of Smad2/3 (D) and ERK1/2 (E) in hPSCs activated with 5 ng/ml TGF-β for 1 h compared to untreated hPSCs. The protein expression levels for α-SMA and col-1 were normalized to β-actin, while pSmad2/3 and pERK1/2 were normalized to respective total protein levels. (F) Relative % growth of cells after 48 hours treatment with SPION, FGF2, or FGF2 SPION at concentration equal to 250 ng/ml or 500 ng/ml FGF2 and with or without TGF-β indicating no toxic effect exhibited by nanoparticles. (G) Representative immunofluorescence images showing the effect of FGF2 and FGF2-SPION on the protein expression of α-SMA and col-1 in TGF-β-activated hPSCs. Data represents mean + SEM for at least 3 independent experiments. Statistical differences are *p<0.05, **p<0.01, ***p<0.001.
Figure 5
Figure 5
Effect of FGF2-SPION on hPSCs migration and contractility. Representative microscopic images (A) and quantification (B) showing the effect FGF2 (250 ng/ml) and FGF2-SPIONs (equivalent to 250 ng/ml FGF2) on the migration of hPSCs after 12 h of incubation. Representative images (C) and quantitation (D) showing the effect of FGF2 (250 ng/ml) and FGF2-SPIONs (equivalent to 250 ng/ml FGF2) on the hPSCs contraction in collagen 3D gel after 96 h incubation with 5 ng/ml TGF-β compared to untreated 3D collagen gel with hPSCs. Data represents mean + SEM for at least 3 independent experiments. Statistical differences are *p<0.05, **p<0.01, ***p<0.001.
Figure 6
Figure 6
Effect of FGF2-SPIONs on the tumor stroma and gemcitabine efficacy in 3D heterospheroids. (A) Schematic representation of heterospheroid culture combining PANC-1 cells with hPSCs in a round bottom 96-well plate. Representative images (B) and quantification (C) showing growth of spheroids after spheroid formation at day 3 of the cell seeding. (D) Relative ATP content (%) at day 9 in homospheroids of PANC-1 or hPSCs and heterospheroids (PANC-1 + hPSCs). Representative images (E) and quantification (F) of PANC-1 + hPSC heterospheroids co-treated with gemcitabine and SPIONs or FGF2 or FGF2-SPIONs. (G) Relative ATP content (%) at day 9 shows the comparative ATP levels versus control untreated heterospheroids. Images were captured every 3rd day. Western blot (H) and quantitation (I) showing a reduction in α-SMA and col1 expression levels. Data represents mean + SEM for at least 3 independent experiments. Statistical differences are *p<0.05, **p<0.0.01, ***p<0.001.
Figure 7
Figure 7
Magnetic driven iron oxide accumulation. Schematic representation (A) of spheroid culture in 96 round-bottom well plate with neodymium magnet as driving force to attract SPION or FGF2-SPION. Measured size (B) of spheroids after 9 days in culture. Data represents mean + SEM for at least 8 spheroids. Statistical differences are *p<0.05, **p<0.01.

Similar articles

Cited by

References

    1. Siegel RL, Miller KD, Jemal A. Cancer statistics, 2018. CA Cancer J Clin. 2018;68:7–30. - PubMed
    1. Kikuyama M, Kamisawa T, Kuruma S, Chiba K, Kawaguchi S, Terada S, Early Diagnosis to Improve the Poor Prognosis of Pancreatic Cancer. Cancers (Basel); 2018. p. 10. - PMC - PubMed
    1. Bliss LA, Witkowski ER, Yang CJ, Tseng JF. Outcomes in operative management of pancreatic cancer. J Surg Oncol. 2014;110:592–8. - PubMed
    1. Ryan DP, Hong TS, Bardeesy N. Pancreatic adenocarcinoma. N Engl J Med. 2014;371:1039–49. - PubMed
    1. Conroy T, Desseigne F, Ychou M, Bouché O, Guimbaud R, Bécouarn Y. et al. Folforinox versus gemcitabine for metastatic pancreatic cancer. N Engl J Med. 2011;364:1817–25. - PubMed

Publication types

MeSH terms