. 2020 Feb 28;48(4):1715-1729.
doi: 10.1093/nar/gkz1206.

Integrative network analysis identifies cell-specific trans regulators of m6A

Affiliations

Integrative network analysis identifies cell-specific trans regulators of m6A

Sanqi An et al. Nucleic Acids Res. .

Abstract

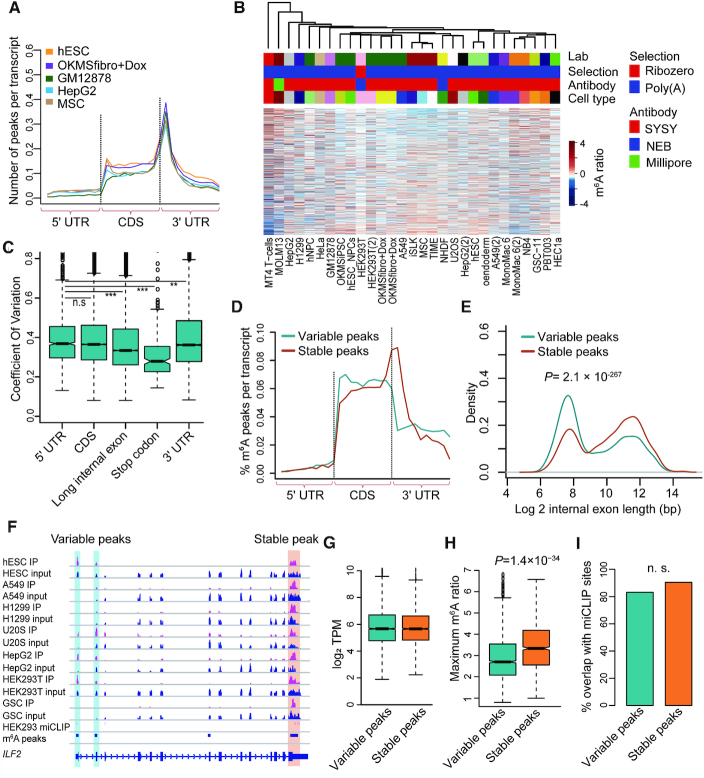
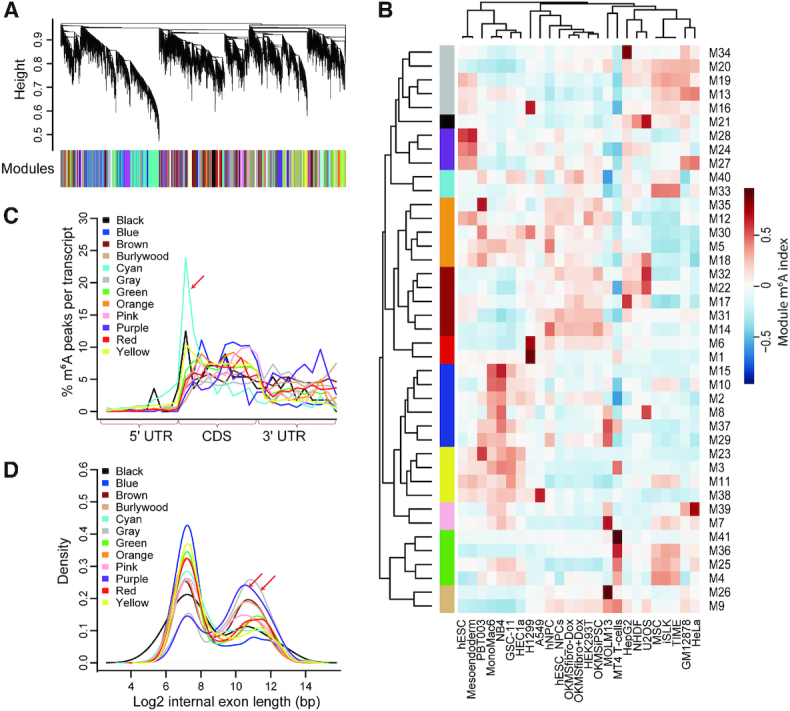
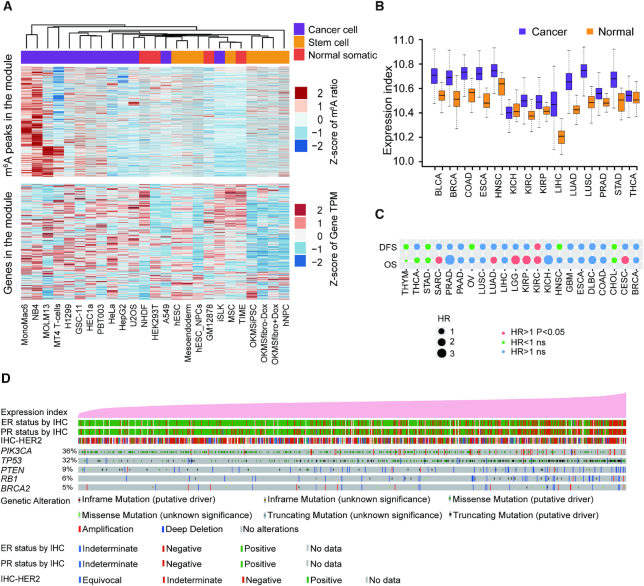
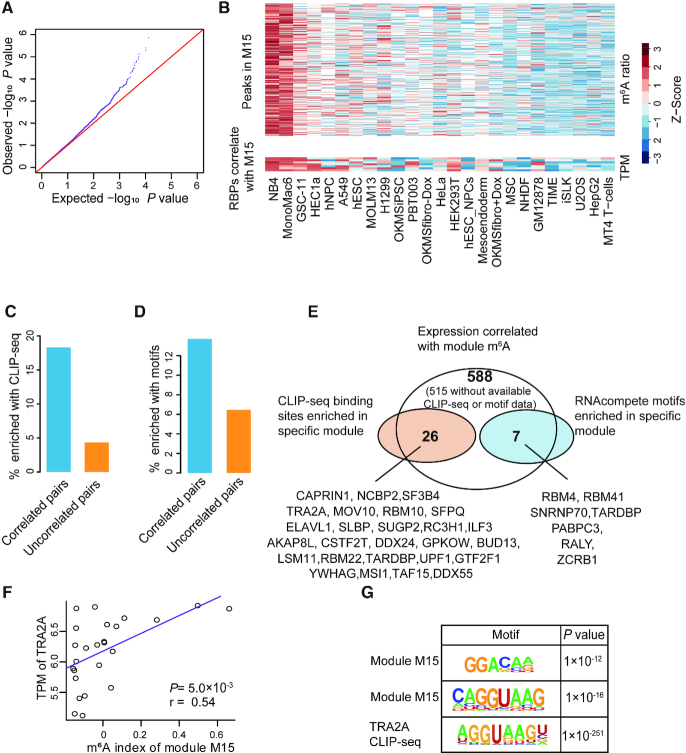
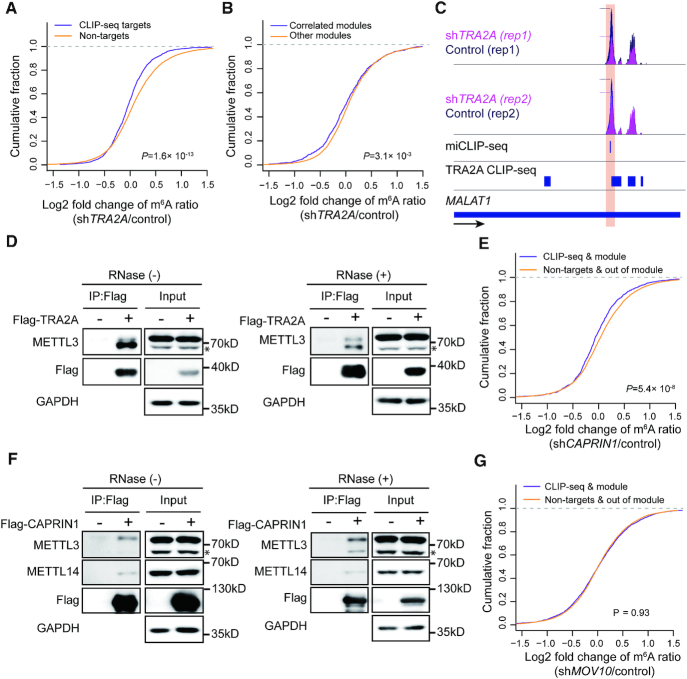
N6-methyladenosine (m6A) is a reversible and dynamic RNA modification in eukaryotes. However, how cells establish cell-specific m6A methylomes is still poorly understood. Here, we developed a computational framework to systematically identify cell-specific trans regulators of m6A through integrating gene expressions, binding targets and binding motifs of large number of RNA binding proteins (RBPs) with a co-methylation network constructed using large-scale m6A methylomes across diverse cell states. We applied the framework and successfully identified 32 high-confidence m6A regulators that modulated the variable m6A sites away from stop codons in a cell-specific manner. To validate them, we knocked down three regulators respectively and found two of them (TRA2A and CAPRIN1) selectively promoted the methylations of the m6A sites co-localized with their binding targets on RNAs through physical interactions with the m6A writers. Knockdown of TRA2A increased the stabilities of the RNAs with TRA2A bound near the m6A sites and decreased the viability of cells. The successful identification of m6A regulators demonstrates a powerful and widely applicable strategy to elucidate the cell-specific m6A regulators. Additionally, our discovery of pervasive trans-acting regulating of m6A provides novel insights into the mechanisms by which spatial and temporal dynamics of m6A methylomes are established.


Figures

Figure 1.
Figure 1.
Schematic flow chart demonstrating the computational framework to identify trans regulators of m6A.
Figure 2.
Figure 2.
Analyses of m6A methylomes of multiple cell lines. (A) Normalized distributions of m6A peaks across 5′ UTR, CDS and 3′ UTR for representative cell lines. (B) The unsupervised hierarchical clustering and heatmap of the m6A ratios for the m6A peaks with the largest CVs across all cell lines. The technical information is indicated above the heatmap. (C) Box plot representing the CVs of m6A ratios for the peaks located at different regions of mRNAs. (D) Normalized distributions of variable and stable m6A peaks across 5′ UTR, CDS and 3′ UTR. (E) Densities of logarithm transformed lengths of the internal exons with variable m6A peaks and stable m6A peaks. The P-value of Wilcoxon test is indicated. (F) Tracks showing the read coverage of the IPs, inputs and the merged m6A peaks of the representative cell lines as well as the HEK293 m6A sites from miCLIP-seq data on ILF2. The tracks are shown for optimal viewing. The variable and stable m6A peaks are highlighted, respectively. (G) Box plots representing the logarithm transformed TPMs of variable and stable m6A peaks. (H), Box plot representing the maximum m6A ratios across all cell lines of variable and stable m6A peaks. (I) Bar plot showing the percentages of variable peaks and stable peaks that overlap with m6A sites obtained from miCLIP-seq. ‘n.s.’ denotes non-significant.
Figure 3.
Figure 3.
Classification and analyses of co-methylated m6A modules. (A) Classification of co-methylated m6A modules through dynamical cutting of the clustering dendrogram of all variable m6A peaks. (B) Heatmap representing the m6A indexes of all the 41 co-methylation modules across all the cell lines. (C) Normalized distributions of m6A peaks in different combined modules across 5′ UTR, CDS and 3′ UTR. (D) Densities of logarithm transformed lengths of the internal exons with m6A peaks in different combined co-methylation modules.
Figure 4.
Figure 4.
Discovery of a co-methylation module specifically methylated in cancer cell lines. (A) Heatmaps representing the Z-scores of m6A ratios (upper panel) and gene expressions (low panel) of the peaks and corresponding genes across all cell lines. The types of cell lines are indicated at the top of the upper panel. (B) Box plot representing the gene expression indexes of the genes corresponding to cancer-specific module for cancer and normal samples of 14 cancer types in TCGA. (C) Cox correlations between the gene expression indexes of the genes corresponding to cancer-specific module and the survival of cancer patients of 14 cancer types in TCGA. OS: overall survival; DFS: disease-free survival; HR: hazard ratio. (D) Tracks representing the gene expression indexes of the genes corresponding to the cancer-specific module and genetic alteration spectrum of the key markers as well as clinical phenotypes of the breast cancer patients from TCGA. The patient samples are sorted according to the gene expression indexes of the cancer-specific module.
Figure 5.
Figure 5.
Systematic identification of m6A regulators. (A) Q-Q plot comparing the distributions of expected P-values and observed P-values of the correlations between the gene expressions of RBPs and m6A indexes of the co-methylation modules. (B) Heatmaps representing the m6A ratios of the m6A peaks within the module M15 (upper panel) and the gene expressions of the RBPs that significantly correlated with the m6A indexes of M15 (lower panel). The cell lines are sorted according to the m6A indexes of M15. (C andD) Barplot representing the percentages of the pairs of RBPs and modules that enriched for CLIP-seq binding sites (C) or motifs (D) of the RBPs out of the pairs that showing significant and non-significant (top 1000 least significant) correlations between gene expressions of the RBPs and the m6A indexes of the modules. (E) Venn diagram demonstrating the identification of 32 high-confidence m6A regulators. (F) Scatter plot showing the correlation between TRA2A gene expression and m6A indexes of module M15 across all cell lines. (G) Representative motifs enriched in module M15 and TRA2A CLIP-seq targets.
Figure 6.
Figure 6.
Experimental validation of selected m6A regulators. (A) Plot of cumulative fraction of log2 fold change of m6A ratios upon TRA2A knockdown for the m6A peaks overlap or non-overlap with TRA2A CLIP-seq targets. P-value of two-tailed Wilcoxon test is indicated. (B) Plot of cumulative fraction of log2 fold change of m6A ratios upon TRA2A knockdown for the m6A peaks within or not within the co-methylation modules correlated with TRA2A. P value of two-tailed Wilcoxon test is indicated. (C) Tracks displaying the read coverage of IPs normalized by inputs as well as the miCLIP-seq m6A sites and TRA2A CLIP-seq peaks in HepG2 cells on the long non-coding gene MALAT1. The m6A peak with down-regulated m6A ratio in shTRA2A is highlighted. The dashed lines indicate the summits of the peaks. (D) Western blots showing the interaction between TRA2A and METTL3 with and without RNase treatment respectively. * indicates a non-specific band (see Supplementary Figure S5B). (E) Plot of cumulative fraction of log2 fold change of m6A ratios upon CAPRIN1 knockdown comparing the m6A peaks in the correlated modules and overlap with CAPRIN1 CLIP-seq targets versus the peaks not within the correlated module or overlap with CAPRIN1 CLIP-seq targets. P-value of two-tailed Wilcoxon test is indicated. (F) Western blots showing the interactions of CAPRIN1 with METTL3 and METTL14 with and without RNase treatment respectively. * indicates a non-specific band (see Supplementary Figure S5B). (G) Plot of cumulative fraction of log2 fold change of m6A ratios upon MOV10 knockdown comparing the m6A peaks in the correlated modules and overlap with MOV10 CLIP-seq targets versus the peaks not within the correlated module or overlap with MOV10 CLIP-seq targets. P-value of two-tailed Wilcoxon test is indicated.

References

    1. Meyer K.D., Saletore Y., Zumbo P., Elemento O., Mason C.E., Jaffrey S.R.. Comprehensive analysis of mRNA methylation reveals enrichment in 3′ UTRs and near stop codons. Cell. 2012; 149:1635–1646. - PMC - PubMed
    1. Dominissini D., Moshitch-Moshkovitz S., Schwartz S., Salmon-Divon M., Ungar L., Osenberg S., Cesarkas K., Jacob-Hirsch J., Amariglio N., Kupiec M. et al. .. Topology of the human and mouse m6A RNA methylomes revealed by m6A-seq. Nature. 2012; 485:201–206. - PubMed
    1. Meyer K.D., Jaffrey S.R.. Rethinking m(6)A readers, writers, and erasers. Annu. Rev. Cell Dev. Biol. 2017; 33:319–342. - PMC - PubMed
    1. Yue Y., Liu J., Cui X., Cao J., Luo G., Zhang Z., Cheng T., Gao M., Shu X., Ma H. et al. .. VIRMA mediates preferential m(6)A mRNA methylation in 3′UTR and near stop codon and associates with alternative polyadenylation. Cell Discov. 2018; 4:10. - PMC - PubMed
    1. Wen J., Lv R., Ma H., Shen H., He C., Wang J., Jiao F., Liu H., Yang P., Tan L. et al. .. Zc3h13 regulates nuclear RNA m(6)A methylation and mouse embryonic stem cell self-renewal. Mol. Cell. 2018; 69:1028–1038. - PMC - PubMed

Publication types