

Clinical Implications of Suspended Scattering Particles in Motion Observed by Optical Coherence Tomography Angiography
- PMID: 31913306
- PMCID: PMC6949280
- DOI: 10.1038/s41598-019-55606-9
Clinical Implications of Suspended Scattering Particles in Motion Observed by Optical Coherence Tomography Angiography
Abstract
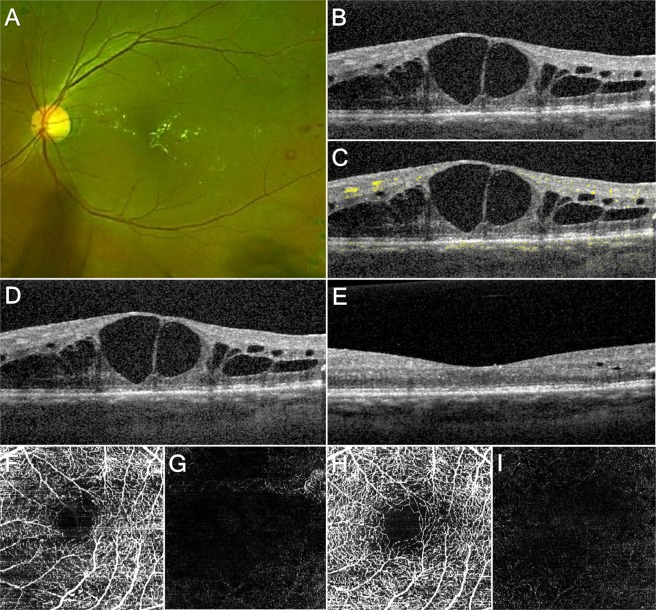
The objective of this study was to investigate the relationship between suspended scattering particles in motion (SSPiM) in optical coherence tomography angiography (OCTA) and treatment response in diabetic macular edema (DME). We retrospectively reviewed the medical records of patients diagnosed with DME who had undergone intravitreal injection. The optical density ratio (ODR) of the intraretinal cyst and the numbers of hyperreflective foci from OCT images and SSPiM from OCTA images were compared, and their association with treatment response was analyzed. Forty-five eyes from 45 patients were included in this study. Twenty-four patients were treated with anti-vascular endothelial growth factor, and 21 patients were treated with a steroid. Binary logistic regression model showed that SSPiM in OCTA images was associated with hyperreflective foci numbers (P = 0.038) and mean ODR of the intraretinal cyst (P = 0.006). Linear regression model showed that SSPiM in the inner nuclear layer was related to treatment response (P = 0.006). SSPiM on OCTA images is related to the poor structural response to treatment in DME.
Conflict of interest statement
The authors declare no competing interests.
Figures


Similar articles
-
The longitudinal follow-up of a newly proposed OCTA imaging finding (SSPiM) and the importance of it as a new biomarker for treatment response in diabetic macular edema.Graefes Arch Clin Exp Ophthalmol. 2024 Aug;262(8):2491-2502. doi: 10.1007/s00417-024-06457-2. Epub 2024 Mar 26. Graefes Arch Clin Exp Ophthalmol. 2024. PMID: 38530451 Free PMC article.
-
SUSPENDED SCATTERING PARTICLES IN MOTION MAY INFLUENCE OPTICAL COHERENCE TOMOGRAPHY ANGIOGRAPHY VESSEL DENSITY METRICS IN EYES WITH DIABETIC MACULAR EDEMA.Retina. 2021 Jun 1;41(6):1259-1264. doi: 10.1097/IAE.0000000000003016. Retina. 2021. PMID: 33165296
-
Suspended scattering particles in motion using OCT angiography in branch retinal vein occlusion disease cases with cystoid macular edema.Sci Rep. 2020 Aug 19;10(1):14011. doi: 10.1038/s41598-020-70784-7. Sci Rep. 2020. PMID: 32814784 Free PMC article.
-
Optical coherence tomography angiography analysis of macular vessel density before and after anti-VEGF therapy in eyes with diabetic retinopathy.Int Ophthalmol. 2019 Oct;39(10):2361-2371. doi: 10.1007/s10792-019-01076-x. Epub 2019 May 22. Int Ophthalmol. 2019. PMID: 31119505
-
Optical Coherence Tomography Angiography of Macular Perfusion Changes after Anti-VEGF Therapy for Diabetic Macular Edema: A Systematic Review.J Diabetes Res. 2021 May 22;2021:6634637. doi: 10.1155/2021/6634637. eCollection 2021. J Diabetes Res. 2021. PMID: 34124270 Free PMC article.
Cited by
-
Topographic associations of hyperreflective materials in diabetic retinopathy: a multimodal correlation with microvascular pathology, structural remodeling and systemic metabolic dysregulation.Front Med (Lausanne). 2025 Jul 16;12:1619819. doi: 10.3389/fmed.2025.1619819. eCollection 2025. Front Med (Lausanne). 2025. PMID: 40740946 Free PMC article.
-
Optical Coherence Tomography Biomarkers in Predicting Treatment Outcomes of Diabetic Macular Edema After Dexamethasone Implants.Front Med (Lausanne). 2022 Jun 9;9:852022. doi: 10.3389/fmed.2022.852022. eCollection 2022. Front Med (Lausanne). 2022. PMID: 35755055 Free PMC article.
-
A Swept source optical coherence tomography angiography study: Imaging artifacts and comparison of non-perfusion areas with fluorescein angiography in diabetic macular edema.PLoS One. 2021 Apr 8;16(4):e0249918. doi: 10.1371/journal.pone.0249918. eCollection 2021. PLoS One. 2021. PMID: 33831123 Free PMC article.
-
Ultrastructural imaging biomarkers in diabetic macular edema: A major review.Indian J Ophthalmol. 2025 Jan 1;73(Suppl 1):S7-S23. doi: 10.4103/IJO.IJO_878_24. Epub 2024 Dec 24. Indian J Ophthalmol. 2025. PMID: 39723865 Free PMC article. Review.
-
The longitudinal follow-up of a newly proposed OCTA imaging finding (SSPiM) and the importance of it as a new biomarker for treatment response in diabetic macular edema.Graefes Arch Clin Exp Ophthalmol. 2024 Aug;262(8):2491-2502. doi: 10.1007/s00417-024-06457-2. Epub 2024 Mar 26. Graefes Arch Clin Exp Ophthalmol. 2024. PMID: 38530451 Free PMC article.
References
Publication types
MeSH terms
Substances
LinkOut - more resources
Full Text Sources
Medical
