. 2020 Jan 8;7(1):6.
doi: 10.1038/s41597-019-0344-7.

A global database for metacommunity ecology, integrating species, traits, environment and space

Alienor Jeliazkov  1   2 Darko Mijatovic  3 Stéphane Chantepie  4 Nigel Andrew  5 Raphaël Arlettaz  6 Luc Barbaro  7   8 Nadia Barsoum  9 Alena Bartonova  10   11 Elena Belskaya  12 Núria Bonada  13 Anik Brind'Amour  14 Rodrigo Carvalho  15   16 Helena Castro  17 Damian Chmura  18 Philippe Choler  19 Karen Chong-Seng  20 Daniel Cleary  21   22 Anouk Cormont  23 William Cornwell  24 Ramiro de Campos  25 Nicole de Voogd  26   27 Sylvain Doledec  28 Joshua Drew  29 Frank Dziock  30 Anthony Eallonardo  31 Melanie J Edgar  32 Fábio Farneda  33   34   35 Domingo Flores Hernandez  36 Cédric Frenette-Dussault  37 Guillaume Fried  38 Belinda Gallardo  39 Heloise Gibb  40 Thiago Gonçalves-Souza  41 Janet Higuti  25 Jean-Yves Humbert  6 Boris R Krasnov  42 Eric Le Saux  8 Zoe Lindo  43 Adria Lopez-Baucells  34   35   44 Elizabeth Lowe  45 Bryndis Marteinsdottir  46 Koen Martens  47   48 Peter Meffert  49 Andres Mellado-Díaz  50   51 Myles H M Menz  52 Christoph F J Meyer  34   35   53 Julia Ramos Miranda  36 David Mouillot  54 Alessandro Ossola  45 Robin Pakeman  55 Sandrine Pavoine  8 Burak Pekin  56 Joan Pino  57 Arnaud Pocheville  58 Francesco Pomati  59 Peter Poschlod  60 Honor C Prentice  61 Oliver Purschke  62   63 Valerie Raevel  64 Triin Reitalu  65 Willem Renema  26 Ignacio Ribera  66 Natalie Robinson  67   68 Bjorn Robroek  69 Ricardo Rocha  34   35 Sen-Her Shieh  70 Rebecca Spake  71 Monika Staniaszek-Kik  72 Michal Stanko  73 Francisco Leonardo Tejerina-Garro  74   75 Cajo Ter Braak  76 Mark C Urban  77 Roel van Klink  3 Sébastien Villéger  54 Ruut Wegman  23 Martin J Westgate  78 Jonas Wolff  45 Jan Żarnowiec  18 Maxim Zolotarev  12 Jonathan M Chase  3   79
Affiliations

A global database for metacommunity ecology, integrating species, traits, environment and space

Alienor Jeliazkov et al. Sci Data. .

Erratum in

  • Author Correction: A global database for metacommunity ecology, integrating species, traits, environment and space.
    Jeliazkov A, Mijatovic D, Chantepie S, Andrew N, Arlettaz R, Barbaro L, Barsoum N, Bartonova A, Belskaya E, Bonada N, Brind'Amour A, Carvalho R, Castro H, Chmura D, Choler P, Chong-Seng K, Cleary D, Cormont A, Cornwell W, de Campos R, de Voogd N, Doledec S, Drew J, Dziock F, Eallonardo A, Edgar MJ, Farneda F, Hernandez DF, Frenette-Dussault C, Fried G, Gallardo B, Gibb H, Gonçalves-Souza T, Higuti J, Humbert JY, Krasnov BR, Saux EL, Lindo Z, Lopez-Baucells A, Lowe E, Marteinsdottir B, Martens K, Meffert P, Mellado-Díaz A, Menz MHM, Meyer CFJ, Miranda JR, Mouillot D, Ossola A, Pakeman R, Pavoine S, Pekin B, Pino J, Pocheville A, Pomati F, Poschlod P, Prentice HC, Purschke O, Raevel V, Reitalu T, Renema W, Ribera I, Robinson N, Robroek B, Rocha R, Shieh SH, Spake R, Staniaszek-Kik M, Stanko M, Tejerina-Garro FL, Braak CT, Urban MC, Klink RV, Villéger S, Wegman R, Westgate MJ, Wolff J, Żarnowiec J, Zolotarev M, Chase JM. Jeliazkov A, et al. Sci Data. 2020 Mar 2;7(1):79. doi: 10.1038/s41597-020-0420-z. Sci Data. 2020. PMID: 32123181 Free PMC article.

Abstract

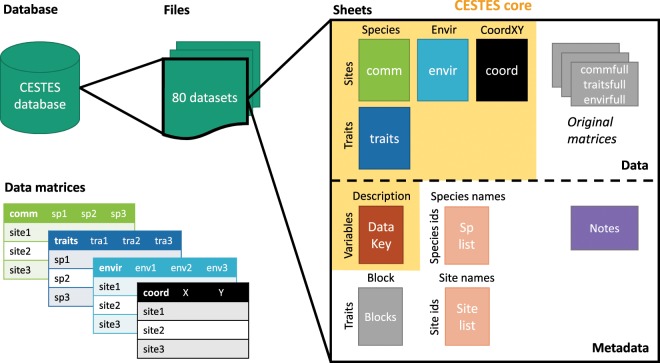
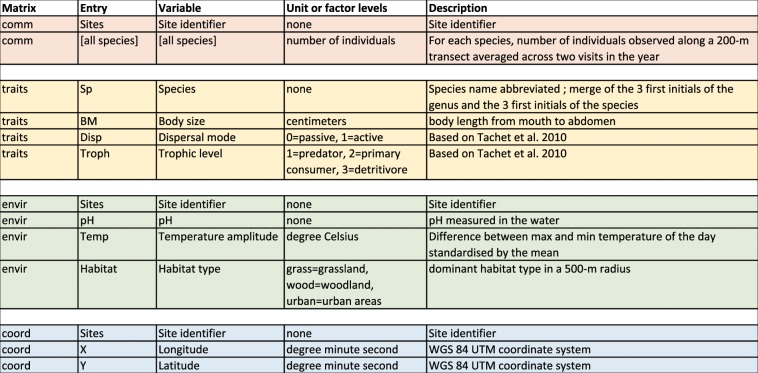
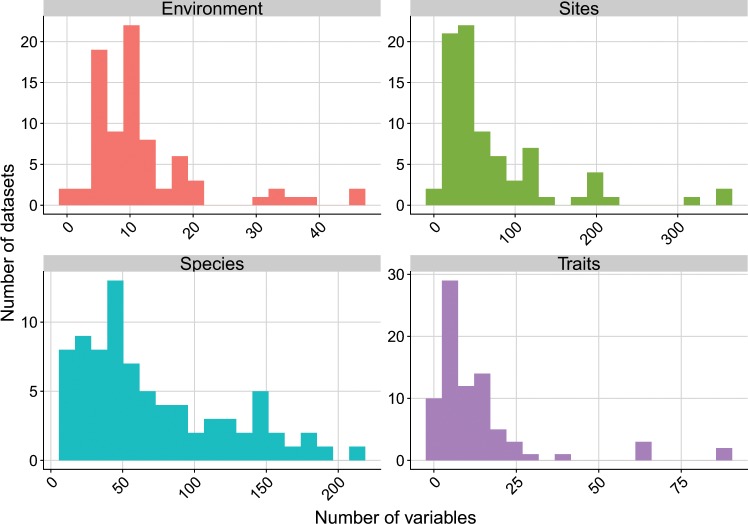
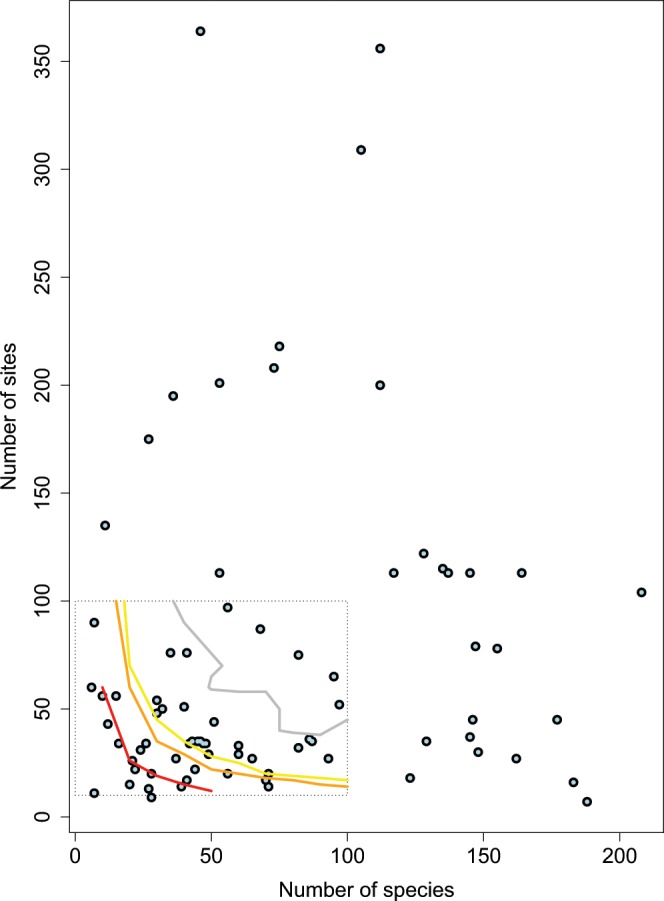
The use of functional information in the form of species traits plays an important role in explaining biodiversity patterns and responses to environmental changes. Although relationships between species composition, their traits, and the environment have been extensively studied on a case-by-case basis, results are variable, and it remains unclear how generalizable these relationships are across ecosystems, taxa and spatial scales. To address this gap, we collated 80 datasets from trait-based studies into a global database for metaCommunity Ecology: Species, Traits, Environment and Space; "CESTES". Each dataset includes four matrices: species community abundances or presences/absences across multiple sites, species trait information, environmental variables and spatial coordinates of the sampling sites. The CESTES database is a live database: it will be maintained and expanded in the future as new datasets become available. By its harmonized structure, and the diversity of ecosystem types, taxonomic groups, and spatial scales it covers, the CESTES database provides an important opportunity for synthetic trait-based research in community ecology.


Conflict of interest statement

The authors declare no competing interests.

Figures

Fig. 1
Fig. 1
Structure of the CESTES database. The database includes 80 Excel files for 80 datasets. Each dataset is composed of four matrices of data stored in spreadsheets: comm (species abundances [n = 68] or presences/absences [n = 12]), traits (species traits), envir (environmental variables), and coord (spatial coordinates). Each dataset also includes a DataKey (description of the entries of the Data tables), a Notes sheet (contact information for the dataset, and, when relevant, processing information), a Species list, and a Site list. The grey components can be the original data matrices, and additional information and do not appear in all the datasets, depending on specific needs (see Methods - Data processing section).
Fig. 2
Fig. 2
Overview of the CESTES database. Upper panel: Map of the 80 dataset locations over the globe (blue spots) (the orange smaller spots represent the 10 ancillary datasets from ceste, the non-spatial supplement of CESTES - see the Methods section); the four coloured polygons represent four datasets that are covering continental extents. The background world map is from OpenStreetMap contributors. Bottom panel: Bar plots and histogram describing the content of the database in terms of: study group, ecological realm, level of human disturbance, and spatial extent of the study.
Fig. 3
Fig. 3
Success rates of the data search and request. Barplot showing the percentage of the different outputs from the data collection process. Percentages are calculated from a total of 139 datasets identified as eligible for the CESTES database (based on literature search and networking). Incomplete data mainly refer to the datasets that had no spatial coordinates (ceste), included unsolved issues, or provided insufficient metadata information. (“Agreed but did not share” refers to authors who replied positively to the first request but then never sent their data despite reminders because e.g., they did not find time to prepare the data).
Fig. 4
Fig. 4
“DataKey” structure and example of metadata information in CESTES datasets. A description is given when the variable full name is not self-explanatory or when potentially relevant information was available. Possible empty cells are due to lack of information that could not be recovered from the original publication nor from the data owners.
Fig. 5
Fig. 5
Data content of the CESTES database. Distribution of the number of environmental, site, species and trait variables across the datasets.
Fig. 6
Fig. 6
Power check of the CESTES datasets with respect to fourth-corner analysis’ requirements. After the Fig. 4a from Dray & Legendre. Plot of the CESTES datasets (blue dots) according to their number of sites and number of species compared to three power thresholds observed in the fourth-corner simulation study from Dray & Legendre. The dashed rectangle represents the range of values tested in the simulations of Dray & Legendre. The curves represent their observed thresholds of Type II error rates - red = 30%, orange = 10%, yellow = 5%, grey = 0%. The datasets that fall below these thresholds are theoretically exposed to respectively 30%, 10%, 5% or 0% chance to fail to detect significant TERs with fourth-corner analysis although these exist. The figure shows that the majority of the CESTES datasets fall in a medium (70%) to very good (>95%) power zone (Power = 100% − Type II error).

Similar articles

Cited by

  • Functional trait dataset of benthic macroinvertebrates in South Korean streams.
    Adhurya S, Lee DY, Lee DS, Park YS. Adhurya S, et al. Sci Data. 2023 Nov 28;10(1):838. doi: 10.1038/s41597-023-02678-y. Sci Data. 2023. PMID: 38017016 Free PMC article.
  • A roadmap to define and select aquatic biological traits at different scales of analysis.
    Morim T, Henriques S, Vasconcelos R, Dolbeth M. Morim T, et al. Sci Rep. 2023 Dec 22;13(1):22947. doi: 10.1038/s41598-023-50146-9. Sci Rep. 2023. PMID: 38135700 Free PMC article.
  • Estimating the movements of terrestrial animal populations using broad-scale occurrence data.
    Supp SR, Bohrer G, Fieberg J, La Sorte FA. Supp SR, et al. Mov Ecol. 2021 Dec 11;9(1):60. doi: 10.1186/s40462-021-00294-2. Mov Ecol. 2021. PMID: 34895345 Free PMC article. Review.
  • Delineating reef fish trophic guilds with global gut content data synthesis and phylogeny.
    Parravicini V, Casey JM, Schiettekatte NMD, Brandl SJ, Pozas-Schacre C, Carlot J, Edgar GJ, Graham NAJ, Harmelin-Vivien M, Kulbicki M, Strona G, Stuart-Smith RD. Parravicini V, et al. PLoS Biol. 2020 Dec 28;18(12):e3000702. doi: 10.1371/journal.pbio.3000702. eCollection 2020 Dec. PLoS Biol. 2020. PMID: 33370276 Free PMC article.
  • Distance decay 2.0 - A global synthesis of taxonomic and functional turnover in ecological communities.
    Graco-Roza C, Aarnio S, Abrego N, Acosta ATR, Alahuhta J, Altman J, Angiolini C, Aroviita J, Attorre F, Baastrup-Spohr L, Barrera-Alba JJ, Belmaker J, Biurrun I, Bonari G, Bruelheide H, Burrascano S, Carboni M, Cardoso P, Carvalho JC, Castaldelli G, Christensen M, Correa G, Dembicz I, Dengler J, Dolezal J, Domingos P, Erös T, Ferreira CEL, Filibeck G, Floeter SR, Friedlander AM, Gammal J, Gavioli A, Gossner MM, Granot I, Guarino R, Gustafsson C, Hayden B, He S, Heilmann-Clausen J, Heino J, Hunter JT, Huszar VLM, Janišová M, Jyrkänkallio-Mikkola J, Kahilainen KK, Kemppinen J, Kozub Ł, Kruk C, Kulbiki M, Kuzemko A, Christiaan le Roux P, Lehikoinen A, Teixeira de Lima D, Lopez-Urrutia A, Lukács BA, Luoto M, Mammola S, Marinho MM, Menezes LS, Milardi M, Miranda M, Moser GAO, Mueller J, Niittynen P, Norkko A, Nowak A, Ometto JP, Ovaskainen O, Overbeck GE, Pacheco FS, Pajunen V, Palpurina S, Picazo F, Prieto JAC, Rodil IF, Sabatini FM, Salingré S, De Sanctis M, Segura AM, da Silva LHS, Stevanovic ZD, Swacha G, Teittinen A, Tolonen KT, Tsiripidis I, Virta L, Wang B, Wang J, Weisser W, Xu Y, Soininen J. Graco-Roza C, et al. Glob Ecol Biogeogr. 2022 Jul;31(7):1399-1421. doi: 10.1111/geb.13513. Epub 2022 May 12. Glob Ecol Biogeogr. 2022. PMID: 35915625 Free PMC article.

References

    1. Vellend, M. The Theory of Ecological Communities (MPB-57). (Princeton University Press, 2016).
    1. Leibold, M. A. & Chase, J. M. Metacommunity Ecology. (Princeton University Press, 2017).
    1. Cadotte MW, Carscadden K, Mirotchnick N. Beyond species: functional diversity and the maintenance of ecological processes and services. Journal of Applied Ecology. 2011;48:1079–1087. doi: 10.1111/j.1365-2664.2011.02048.x. - DOI
    1. Lavorel S, Garnier E. Predicting changes in community composition and ecosystem functioning from plant traits: revisiting the Holy Grail. Functional Ecology. 2002;16:545–556. doi: 10.1046/j.1365-2435.2002.00664.x. - DOI
    1. McGill BJ, Enquist BJ, Weiher E, Westoby M. Rebuilding community ecology from functional traits. Trends in Ecology & Evolution. 2006;21:178–185. doi: 10.1016/j.tree.2006.02.002. - DOI - PubMed

Publication types