. 2020 Mar 2;219(3):e201906039.
doi: 10.1083/jcb.201906039.

Mps1-mediated release of Mad1 from nuclear pores ensures the fidelity of chromosome segregation

Affiliations

Mps1-mediated release of Mad1 from nuclear pores ensures the fidelity of chromosome segregation

Sofia Cunha-Silva et al. J Cell Biol. .

Abstract

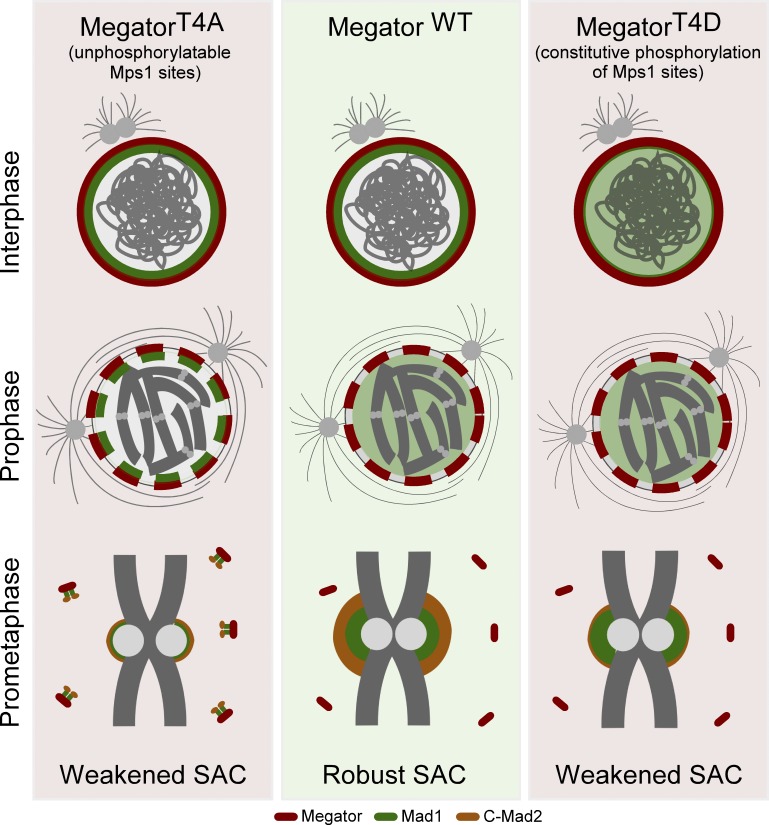
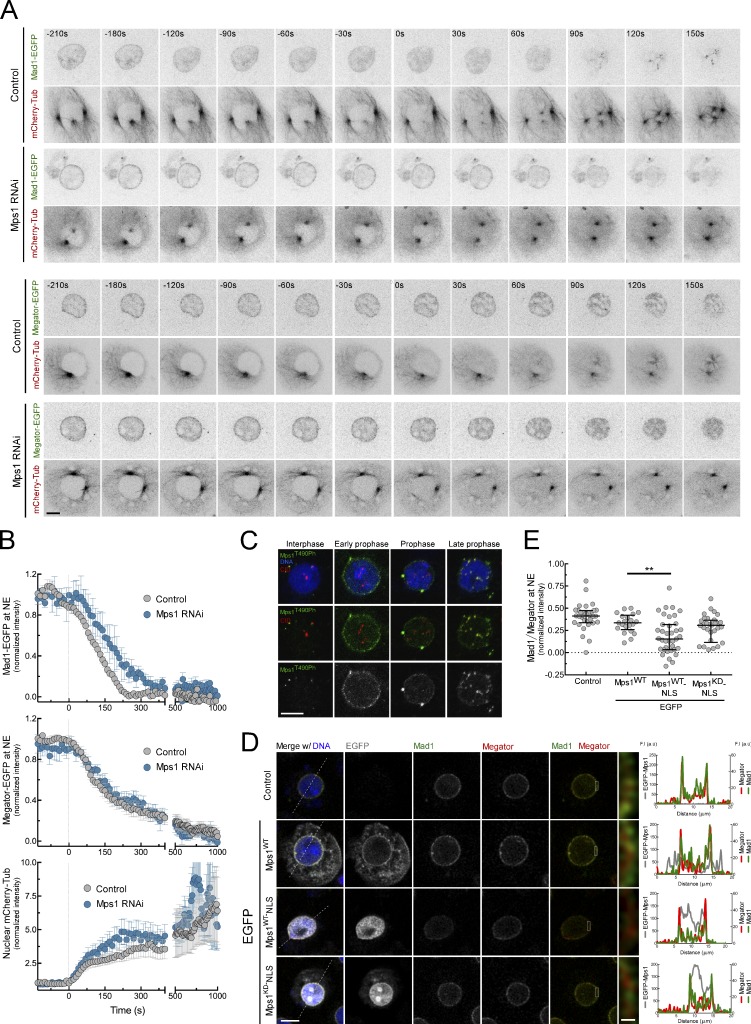
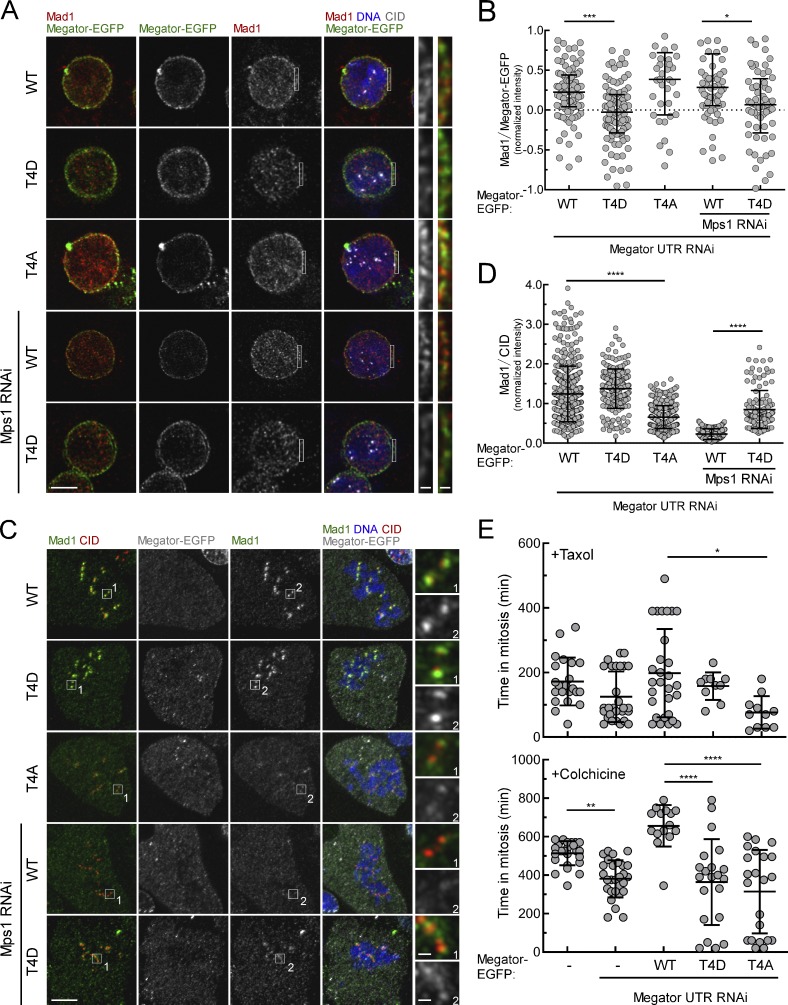
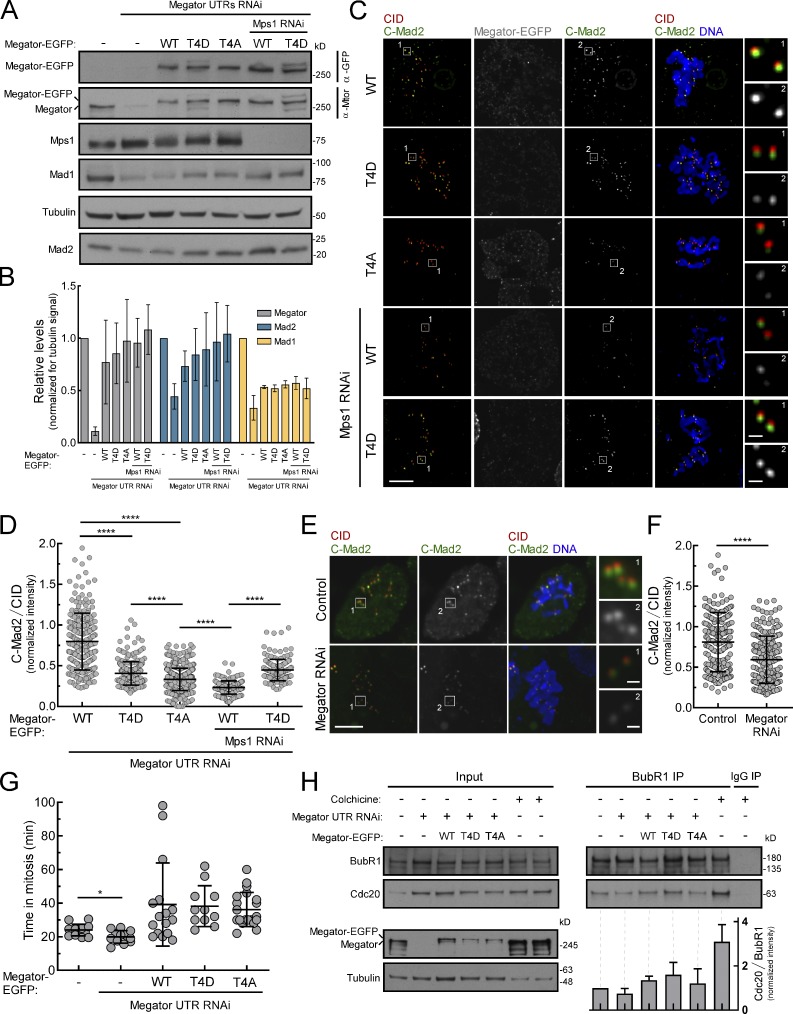
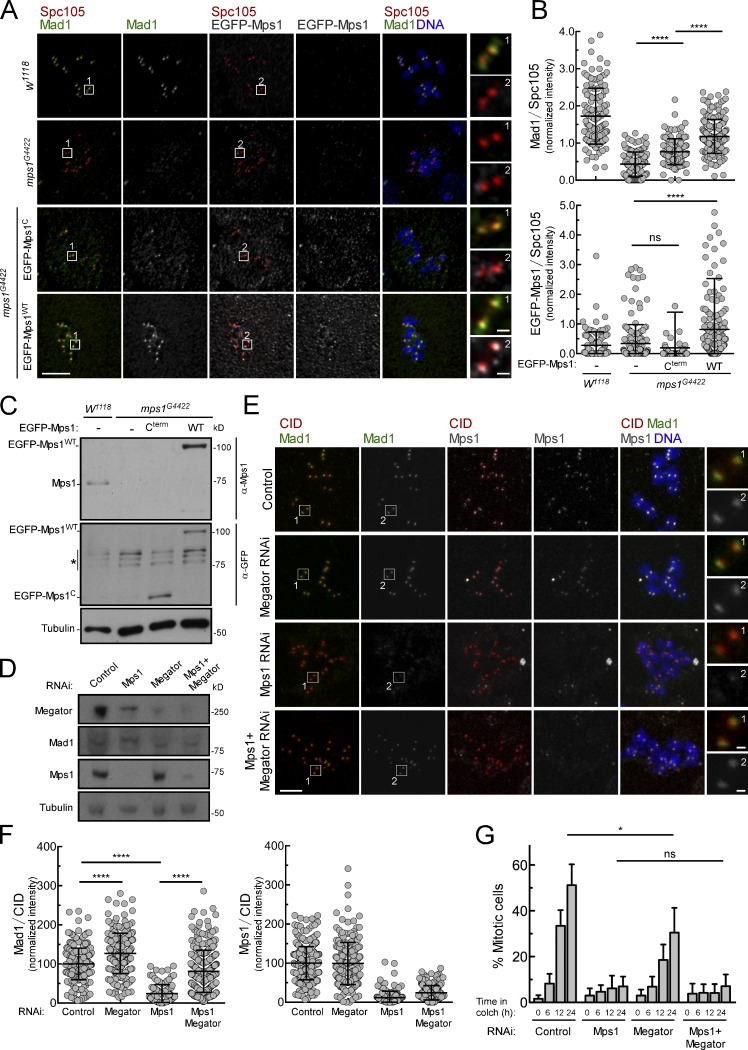
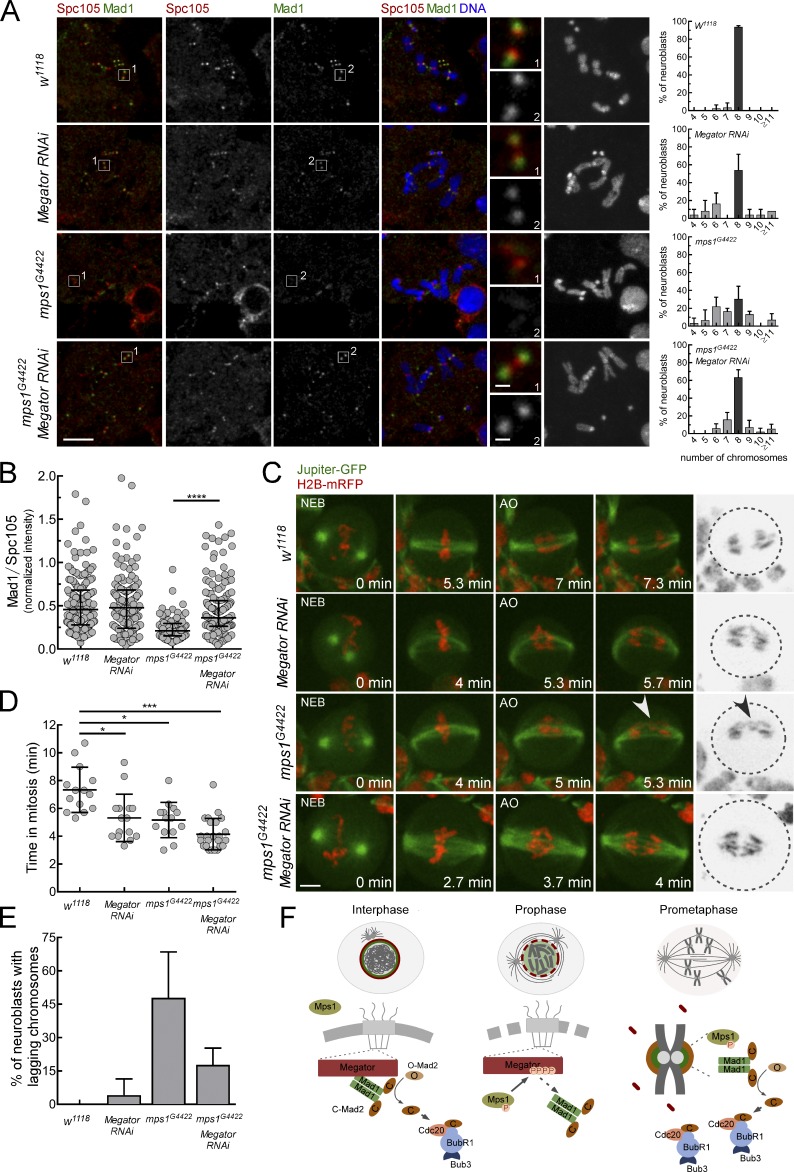
The spindle assembly checkpoint (SAC) relies on the recruitment of Mad1-C-Mad2 to unattached kinetochores but also on its binding to Megator/Tpr at nuclear pore complexes (NPCs) during interphase. However, the molecular underpinnings controlling the spatiotemporal redistribution of Mad1-C-Mad2 as cells progress into mitosis remain elusive. Here, we show that activation of Mps1 during prophase triggers Mad1 release from NPCs and that this is required for kinetochore localization of Mad1-C-Mad2 and robust SAC signaling. We find that Mps1 phosphorylates Megator/Tpr to reduce its interaction with Mad1 in vitro and in Drosophila cells. Importantly, preventing Mad1 from binding to Megator/Tpr restores Mad1 accumulation at kinetochores, the fidelity of chromosome segregation, and genome stability in larval neuroblasts of mps1-null mutants. Our findings demonstrate that the subcellular localization of Mad1 is tightly coordinated with cell cycle progression by kinetochore-extrinsic activity of Mps1. This ensures that both NPCs in interphase and kinetochores in mitosis can generate anaphase inhibitors to efficiently preserve genomic stability.


Figures

None
Graphical abstract
Figure 1.
Figure 1.
Msp1 promotes the dissociation of Mad1 from NPCs during prophase. (A and B) Mitotic progression (A) and quantification (B) of Mad1-EGFP (n ≥ 7 cells) or Megator-EGFP (n ≥ 6 cells) levels at NE and of mCherry-tubulin levels in the nucleus of control and Mps1-depleted Drosophila S2 cells. Time 0 corresponds to NEB. (C) Immunofluorescence images of Mps1T490Ph localization in interphase and prophase S2 cells. (D and E) Immunofluorescence images (D) and quantifications (E) of Mad1 levels at NE of interphase control S2 cells and interphase S2 cells expressing the indicated transgenes. Graphs in D represent the intensity profiles of EGFP-Mps1, Mad1, and Megator signal along the dotted lines (n ≥ 21 cells). In B, data are presented as mean ± SD; in E, data are presented as median with the interquartile range. **, P < 0.005 (Kruskal–Wallis, Dunn’s multiple comparison test). Scale bars, 5 µm (inset, 0.5 µm).
Figure S1.
Figure S1.
Additional information related to Figs. 1, 2, and 3. (A) Immunofluorescence images of EGFP-Mps1, Mps1T490Ph, and Megator localization pattern in interphase control S2 cells and interphase S2 cells expressing EGFP-Mps1WT, EGFP-Mps1WT-NLS, or EGFP-Mps1KD-NLS. To prevent nuclear export, cultured cells were treated with 10 µM Leptomycin B for 3 h. Graphs represent the intensity profiles of GFP-Mps1, Mps1T490Ph, and Megator signal along the dotted lines. (B) Pull-downs of the indicated recombinant MBP-Megator fragments by bead-immobilized 6xHis-Mad11–493 or 6xHis-BubR1359–696 (negative control). Beads (B) and flow-through (FT) were blotted for the indicated proteins. (C) Pull-downs of recombinant purified MBP-Megator1,187–1,655/T2D, MBP-Megator1,187–1,655/T3D, MBP-Megator1,187–1,655/T4D and MBP-Megator1,187–1,655/T4A by bead-immobilized 6xHis-Mad11–493 or 6xHis-BubR11–358 (negative control). B and FT were blotted for the indicated proteins. (D) Quantification of MBP-Megator binding to 6xHis-Mad11–493 from pull-downs in C. The graph represents the ratio between the signal intensities of MBP-Megator and 6xHis-Mad11–493. The value obtained for MBP-Megator1,187–1,655/T4A was set to 1. (E and F) Representative immunofluorescence images (E) and corresponding quantifications (F) of Mad1 at the NE of interphase S2 cells depleted of endogenous Megator and expressing the indicated Megator-EGFP transgenes. Mad1 fluorescence intensities were determined relative to Nup107 signal (n ≥ 24 cells). In F, data are presented as mean ± SD. ***, P < 0.001 (Student’s t test). Scale bars, 5 µm (inset, 0.5 µm).
Figure 2.
Figure 2.
Msp1-mediated phosphorylation of Megator disrupts its interaction with Mad1. (A and B) Western blot analysis of Mad1 immunoprecipitates (IP; A) and Megator hyperphosphorylation (B) from lysates of asynchronous and mitotically enriched (+ colchicine) control and Mps1-depleted S2 cells. When indicated, lysates were treated with λ-phosphatase (λPP). (C) In vitro kinase assay with recombinant MBP-Megator fragments and GST-Mps1 in the presence of [γ-32P]ATP. (D) Schematic representation of Drosophila Megator (ELM resource) and Clustal Omega (EMBL-EBI) local sequence alignment for the indicated Megator/Tpr orthologues. Residues conservation: *, fully conserved;:, strongly similar properties;., weakly similar properties. Residues phosphorylated by Mps1 (P) were identified by MS analysis after in vitro kinase assay. (E and F) Pull-downs of recombinant MBP-Megator1,187–1,655 fragments by bead-immobilized 6xHis-Mad11–493 or 6xHis-BubR11–358 (negative control; E) and corresponding quantifications (F) from two independent experiments. B, beads; FT, flow-through. (G and H) Immunofluorescence images (G) and schematic representation (H) of EGFP-Megator1,187–1,655 clustering by LARIAT in mitotic S2 cells. EGFP-aPKC was used as negative control. (I and J) Quantification of Mad1 levels at EGFP-Megator1,187–1,655 clusters (n ≥ 114 clusters; I) and at KTs (n ≥ 64 KTs; J). In F, I, and J, data are presented as mean ± SD. **, P < 0.01; ****, P < 0.0001 (Kruskal–Wallis, Dunn’s multiple comparison test). Scale bars, 5 µm (inset, 1 µm).
Figure 3.
Figure 3.
Recruitment of Mad1 to unattached KTs and robust SAC signaling require phosphorylation of Megator by Mps1. (A and B) Immunofluorescence images (A) and quantifications (B) of Mad1 at NE of interphase S2 cells depleted of endogenous Megator and expressing Megator-EGFP transgenes (n ≥ 41 cells). (C and D) Immunofluorescence images (C) and corresponding quantification (D) of Mad1 at unattached KTs of S2 cells depleted of endogenous Megator and expressing Megator-EGFP transgenes (n ≥ 125 KTs). (E) Mitotic timings of control and Megator-depleted S2 cells expressing Megator-EGFP transgenes upon addition of taxol (100 nM; n ≥ 11 cells) or colchicine (30 µM; n ≥ 15 cells). In B, data are presented as median with interquartile range; in D and E, data are presented as mean ± SD. *, P < 0.05; **, P < 0.01; ***, P < 0.001; ****, P < 0.0001 (Kruskal–Wallis, Dunn’s multiple comparison test). Scale bars, 5 µm (inset, 0.5 µm).
Figure 4.
Figure 4.
Constitutive impairment of Mad1–Megator interaction reduces the levels of C-Mad2 at KTs. (A and B) Western blots (A) and quantifications (B) of Megator, Mad1, and Mad2 protein levels in lysates from control and Megator-depleted S2 cells expressing Megator-EGFP transgenes. The graph represents the signal intensities of Megator, Mad1, and Mad2 relative to tubulin from at least two independent experiments. The mean value for control parental cells was set to 1. (C and D) Immunofluorescence images (C) and quantifications (D) of C-Mad2 at unattached KTs of S2 cells depleted of endogenous Megator and expressing Megator-EGFP transgenes (n ≥ 148 KTs). (E and F) Immunofluorescence images (E) and quantifications (F) of C-Mad2 levels at unattached KTs of control and Megator-depleted S2 cells (n ≥ 224 KTs). (G) Mitotic timings of control and Megator-depleted S2 cells expressing Megator-EGFP transgenes under unperturbed (absence of spindle poisons) conditions (n ≥ 11 cells). (H) Immunoprecipitates (IP) of BubR1 from lysates of control and Megator-depleted S2 cells expressing Megator-EGFP transgenes. When indicated, cells were incubated with colchicine for 18 h. The graph represents the ratio between the signal intensities of Cdc20 and BubR1 present in BubR1 IPs from two independent experiments. The values for control parental cells were set to 1. In B, data are presented as mean ± SEM; in D, F, G, and H, data are presented as mean ± SD. *, P < 0.05; ****, P < 0.0001 (Kruskal–Wallis, Dunn’s multiple comparison test in D and Student’s t test in F and G). Scale bars, 5 µm (inset, 0.5 µm).
Figure S2.
Figure S2.
KT-extrinsic activity of Mps1 contributes to Mad1 KT recruitment. (A and B) Immunofluorescence images (A) and quantifications (B) of Mad1 and Mps1 levels at unattached KTs of neuroblasts from w1118 or homozygous mps1G4422 flies. When indicated, EGFP-Mps1-Cterm or EGFP-Mps1-WT transgenes were expressed under control of Mps1 native promoter in a homozygous mps1G4422 background. To generate unattached KTs, neuroblasts were incubated with colchicine (50 µM) for 90 min. Mad1 and Mps1 fluorescence intensities were determined relative to Spc105 signal (n ≥ 106 KTs). (C) Western blot analysis of endogenous Mps1, EGFP-Mps1-WT, and EGFP-Mps1-Cterm levels in total lysates of third instar larval brains from A. (D) Western blot analysis of Mps1, Megator, and Mad1 relative levels in control S2 cells and in cells depleted of the indicated proteins. Cells were incubated with MG123 (20 µM) for 1 h and with colchicine (30 µM) for 2 h. Asterisk denotes bands resulting from unspecific anti-GFP blotting. (E and F) Immunofluorescence images (E) and quantifications (F) of Mad1 and Mps1 levels at unattached KTs of control S2 cells and cells depleted of the indicated proteins. Cells were incubated with MG123 (20 µM) for 3 h and with colchicine (30 µM) for 2 h. Mad1 and Mps1 fluorescence intensities were determined relative to CID signal (n ≥ 109 KT for Mad1, n ≥ 139 KTs for Mps1). (G) Mitotic index quantification based on H3Ser10Ph staining of control S2 cells and cells depleted of the indicated proteins. Cells were incubated with colchicine (30 µM) for the indicated time periods. In B, F, and G, data are presented as mean ± SD. *, P < 0.05; ****, P < 0.0001 (Kruskal–Wallis, Dunn’s multiple comparison test). Scale bars, 5 µm (inset, 0.5 µm).
Figure 5.
Figure 5.
Depletion of Megator restores Mad1 KT recruitment and mitotic fidelity in Drosophila mps1-null neuroblasts. (A and B) Immunofluorescence images with ploidy histograms (A) and quantifications (B) of Mad1 levels at unattached KTs of w1118, InscGal4>UAS-MegatorRNAi, homozygous mps1G4422, or homozygous mps1G4422;InscGal4>UAS-MegatorRNAi neuroblasts treated with colchicine (50 µM) for 90 min (n ≥ 91 KTs). (C–E) Mitotic progression (C), mitotic timing (D), and percentage of anaphases with lagging chromosomes (E) in neuroblasts with indicated genotypes coexpressing the microtubule-associated protein Jupiter-GFP and H2B-mRFP. The mitotic timing corresponds to the time from NEB to anaphase onset (AO; n ≥ 14 neuroblasts from at least two independent experiments). The arrowhead in C points to a lagging chromosome. (F) Model for the control of Mad1 subcellular redistribution during the G2/M transition. In interphase, inactive Mps1 (unphosphorylated T-loop) is in the cytoplasm and Mad1-C-Mad2 is docked to Megator at the nucleoplasmic side of NPCs, where it catalyzes the assembly of premitotic MCC. During prophase, active Mps1 (phosphorylated T-loop) becomes detectable in the nucleus and is now able to phosphorylate Megator, disrupting the interaction with Mad1. This ensures timely release of Mad1-C-Mad2 from NPCs, which enables Mad1-C-Mad2 to accumulate at prometaphase KTs and instate robust SAC signaling. In A–C and E, data are presented as mean ± SD. *, P < 0.05; ***, P < 0.001; ****, P < 0.0001 (Kruskal–Wallis, Dunn’s multiple comparison test). Scale bars, 5 µm (inset, 0.5 µm).
Figure S3.
Figure S3.
Depletion of Tpr partially restores Mad1 KT recruitment in human cells lacking Mps1 activity. Immunofluorescence images (A and B) and quantifications (C and D) of Mad1 levels at unattached KTs of HeLa (A and C) or RPE1 cultured cells (B and D) in the indicated conditions. Cells were incubated with nocodazole (3.3 µM) and MG132 (1 µM) for 3 h (HeLa) or 6 h (RPE). When indicated, cells were treated with Tpr siRNA (50 nM) for 48 h and/or reversine (1 µM) for 1 h before nocodazole + MG132 incubation. Mad1 fluorescence intensities were determined relative to CenpC (n ≥ 4,081 KTs for HeLa cells, n ≥ 519 KTs for RPE cells). Data are presented as mean ± SD. ****, P < 0.0001 (Kruskal–Wallis, Dunn’s multiple comparison test). Scale bars, 5 µm (inset, 0.5 µm).

References

    1. Akera T., Goto Y., Sato M., Yamamoto M., and Watanabe Y.. 2015. Mad1 promotes chromosome congression by anchoring a kinesin motor to the kinetochore. Nat. Cell Biol. 17:1124–1133. 10.1038/ncb3219 - DOI - PubMed
    1. Althoff F., Karess R.E., and Lehner C.F.. 2012. Spindle checkpoint-independent inhibition of mitotic chromosome segregation by Drosophila Mps1. Mol. Biol. Cell. 23:2275–2291. 10.1091/mbc.e12-02-0117 - DOI - PMC - PubMed
    1. Bellen H.J., Levis R.W., He Y., Carlson J.W., Evans-Holm M., Bae E., Kim J., Metaxakis A., Savakis C., Schulze K.L., et al. . 2011. The Drosophila gene disruption project: progress using transposons with distinctive site specificities. Genetics. 188:731–743. 10.1534/genetics.111.126995 - DOI - PMC - PubMed
    1. Chen R.H., Shevchenko A., Mann M., and Murray A.W.. 1998. Spindle checkpoint protein Xmad1 recruits Xmad2 to unattached kinetochores. J. Cell Biol. 143:283–295. 10.1083/jcb.143.2.283 - DOI - PMC - PubMed
    1. Chung E., and Chen R.-H.. 2002. Spindle checkpoint requires Mad1-bound and Mad1-free Mad2. Mol. Biol. Cell. 13:1501–1511. 10.1091/mbc.02-01-0003 - DOI - PMC - PubMed

Publication types

MeSH terms