

A U-statistics for integrative analysis of multilayer omics data
- PMID: 31913435
- PMCID: PMC7178407
- DOI: 10.1093/bioinformatics/btaa004
A U-statistics for integrative analysis of multilayer omics data
Abstract
Motivation: The emerging multilayer omics data provide unprecedented opportunities for detecting biomarkers that are associated with complex diseases at various molecular levels. However, the high-dimensionality of multiomics data and the complex disease etiologies have brought tremendous analytical challenges.
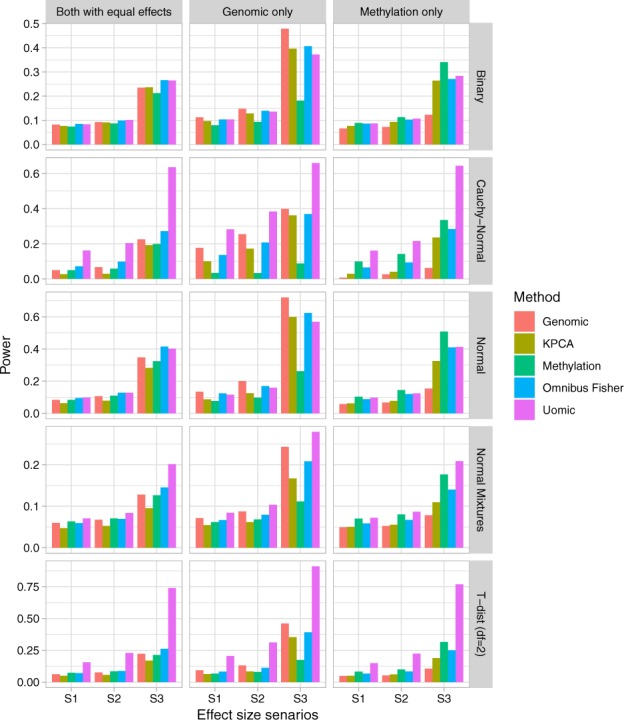
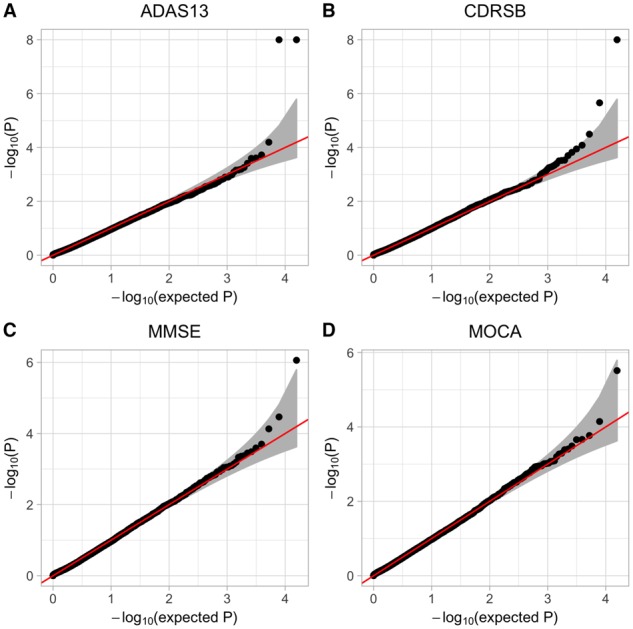
Results: We developed a U-statistics-based non-parametric framework for the association analysis of multilayer omics data, where consensus and permutation-based weighting schemes are developed to account for various types of disease models. Our proposed method is flexible for analyzing different types of outcomes as it makes no assumptions about their distributions. Moreover, it explicitly accounts for various types of underlying disease models through weighting schemes and thus provides robust performance against them. Through extensive simulations and the application to dataset obtained from the Alzheimer's Disease Neuroimaging Initiatives, we demonstrated that our method outperformed the commonly used kernel regression-based methods.
Availability and implementation: The R-package is available at https://github.com/YaluWen/Uomic.
Supplementary information: Supplementary data are available at Bioinformatics online.
© The Author(s) 2020. Published by Oxford University Press. All rights reserved. For permissions, please e-mail: journals.permissions@oup.com.
Figures


References
-
- Ashley E.A. (2015) The precision medicine initiative: a new national effort. JAMA, 313, 2119–2120. - PubMed
