. 2020 Jan 1;35(1):44-57.
doi: 10.1093/humrep/dez247.

Putative human myometrial and fibroid stem-like cells have mesenchymal stem cell and endometrial stromal cell properties

Affiliations

Putative human myometrial and fibroid stem-like cells have mesenchymal stem cell and endometrial stromal cell properties

Amanda L Patterson et al. Hum Reprod. .

Abstract

Study question: Can endometrial stromal stem/progenitor cell markers, SUSD2 and CD146/CD140b, enrich for human myometrial and fibroid stem/progenitor cells?

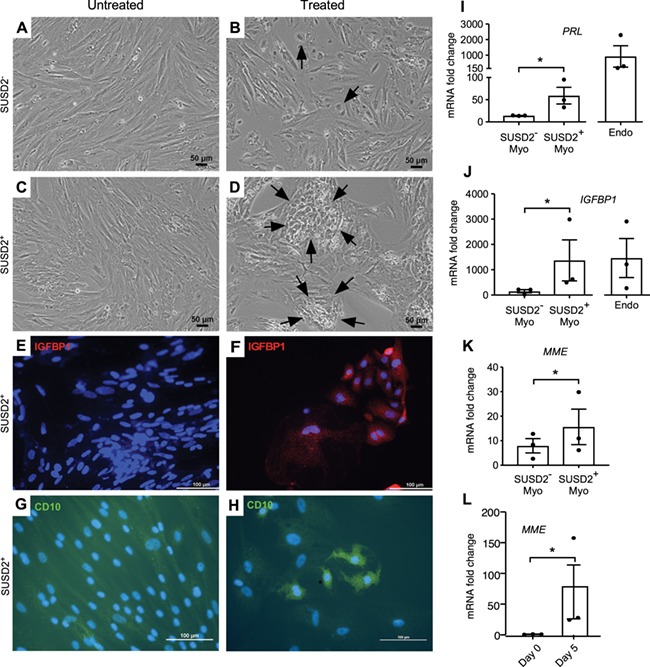
Summary answer: SUSD2 enriches for myometrial and fibroid cells that have mesenchymal stem cell (MSC) characteristics and can also be induced to decidualise.

What is known already: Mesenchymal stem-like cells have been separately characterised in the endometrial stroma and myometrium and may contribute to diseases in their respective tissues.

Study design, size, duration: Normal myometrium, fibroids and endometrium were collected from hysterectomies with informed consent. Primary cells or tissues were used from at least three patient samples for each experiment.

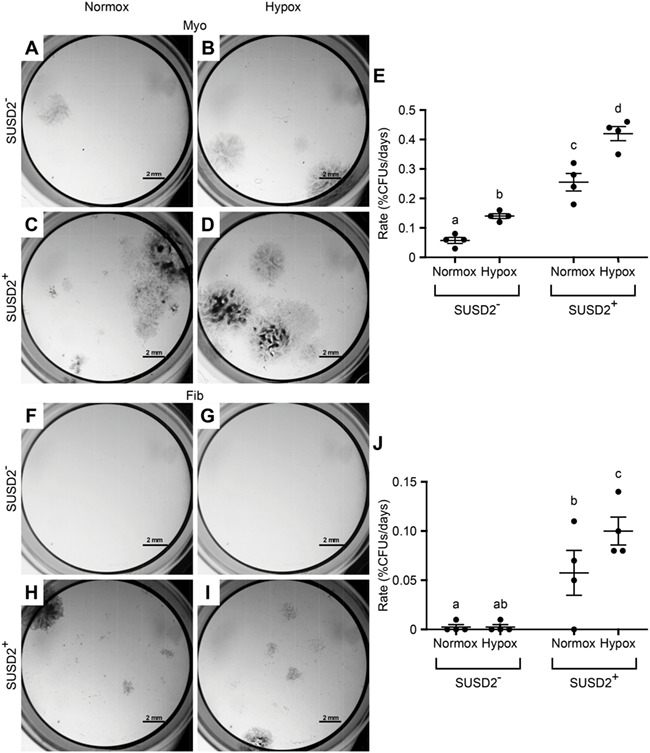
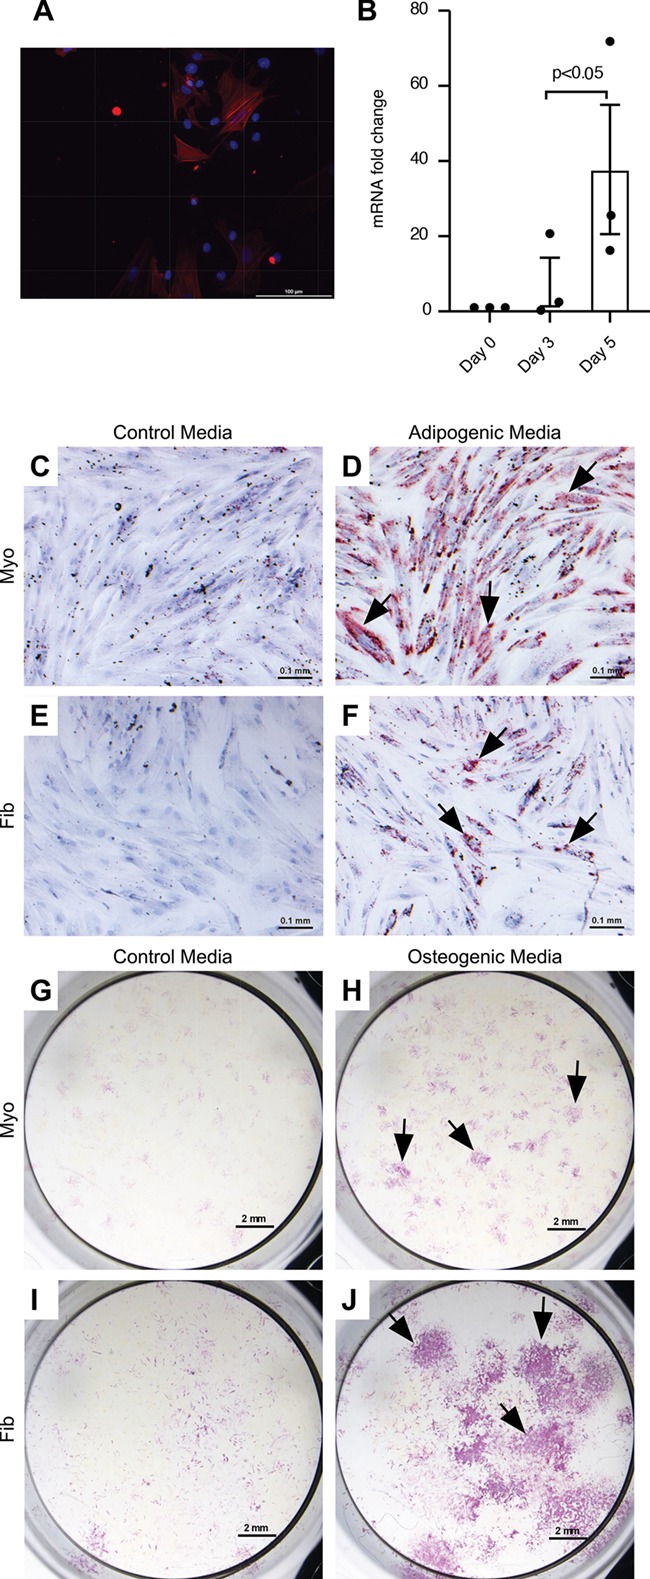
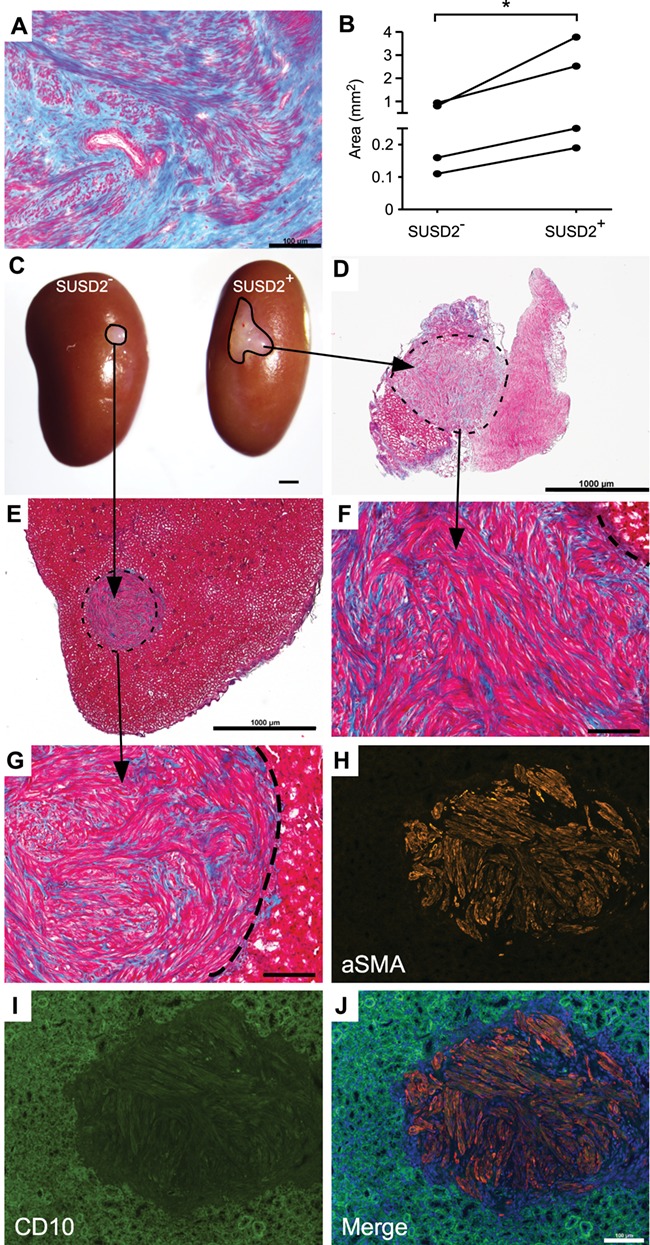
Participants/materials, setting, methods: Flow cytometry, immunohistochemistry and immunofluorescence were used to characterise tissues. In vitro colony formation in normoxic and hypoxic conditions, MSC lineage differentiation (osteogenic and adipogenic) and decidualisation were used to assess stem cell activity. Xenotransplantation into immunocompromised mice was used to determine in vivo stem-like activity. Endpoint measures included quantitative PCR, colony formation, trichrome, Oil Red O and alkaline phosphatase activity staining.

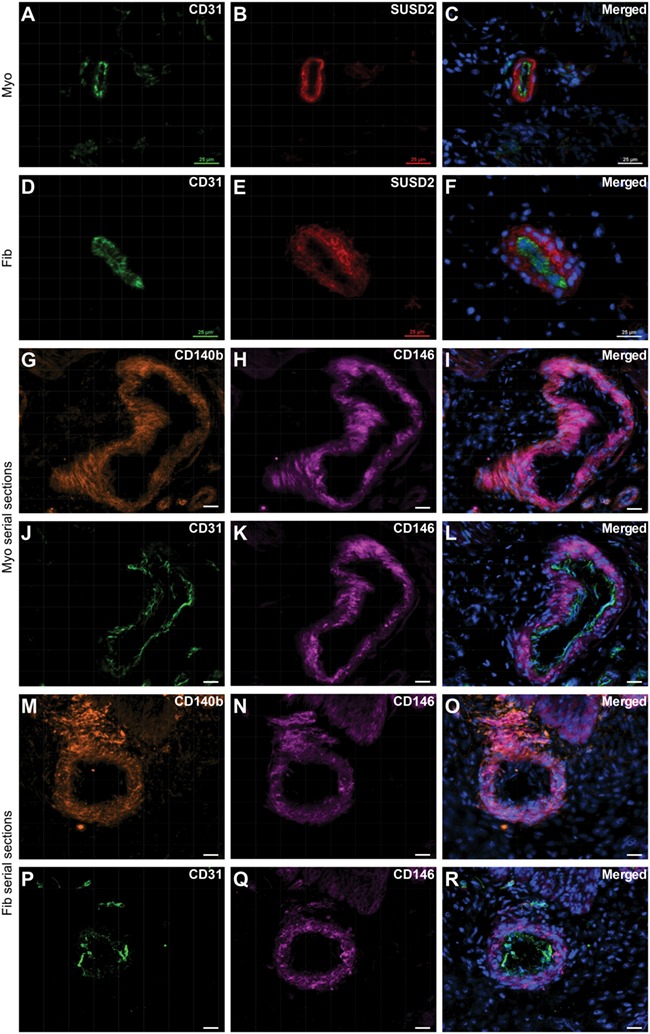
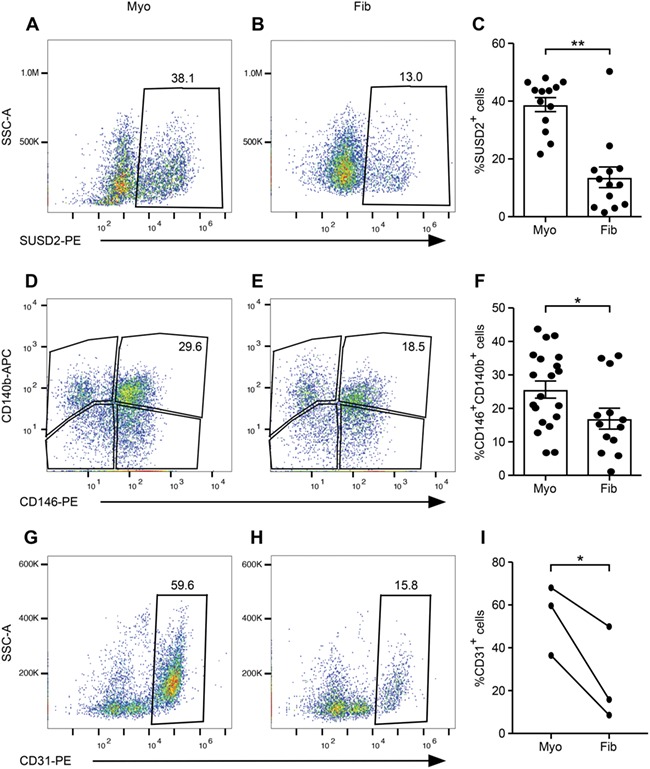
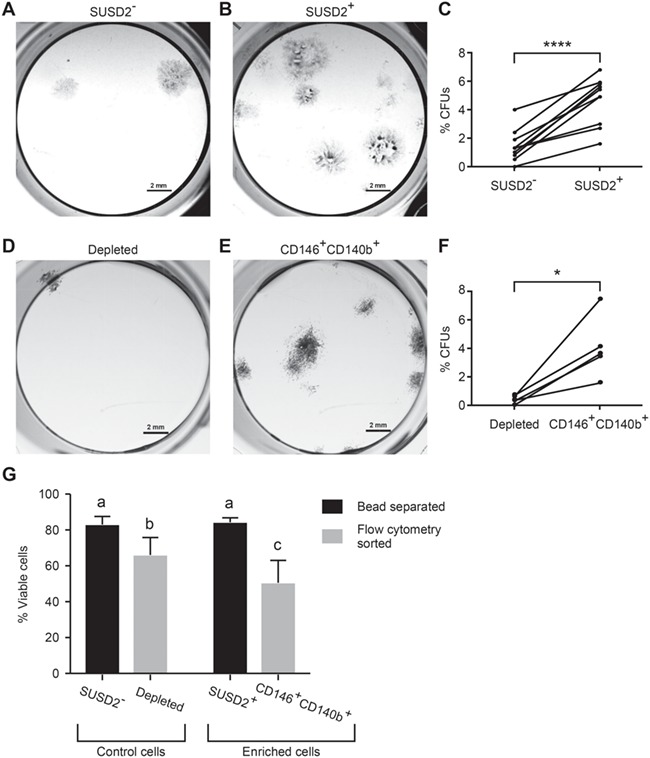
Main results and the role of chance: CD146+CD140b+ and/or SUSD2+ myometrial and fibroid cells were located in the perivascular region and formed more colonies in vitro compared to control cells and differentiated down adipogenic and osteogenic mesenchymal lineages in vitro. SUSD2+ myometrial cells had greater in vitro decidualisation potential, and SUSD2+ fibroid cells formed larger tumours in vivo compared to control cells.

Large-scale data: N/A.

Limitations, reasons for caution: Markers used in this study enrich for cells with stem/progenitor cell activity; however, they do not distinguish stem from progenitor cells. SUSD2+ myometrial cells express markers of decidualisation when treated in vitro, but in vivo assays are needed to fully demonstration their ability to decidualise.

Wider implications of the findings: These results suggest a possible common MSC for the endometrial stroma and myometrium, which could be the tumour-initiating cell for uterine fibroids.

Study funding/competing interest(s): These studies were supported by NIH grants to JMT (R01OD012206) and to ALP (F32HD081856). The authors certify that we have no conflicts of interest to disclose.

Keywords: endometrial stromal stem/progenitor cells; fibroids; mesenchymal stem cells; myometrium; stem/progenitor cells.


Figures

Figure 1
Figure 1
Localisation of SUSD2 + and CD146 + CD140b + cells in myometrium and fibroid tissues. Immunofluorescence analyses were performed on frozen tissue sections to localise putative MSC markers. SUSD2 expression (B, E) is primarily localised to the perivascular region surrounding CD31+ endothelial cells (A, D) in myometrial (A–C) and fibroid (D–F) tissue. (GI) CD146 and CD140b co-expressing cells in myometrium tissue. (J–L) serial section to (G–I) showing CD31+ endothelial cells with surrounding CD146+ perivascular cells. (M–O) CD146 and CD140b co-expressing cells in fibroid tissue and (P–R) serial section showing CD31+ endothelial cells with surrounding CD146+ perivascular cells. Scale bars are 25 μM; nuclei are shown stained with DAPI in merged images, which are representative of n = 5 patient samples.
Figure 2
Figure 2
Flow cytometry characterisation of myometria and fibroids. Representative flow cytometry scatter plots of SUSD2 (A, B), CD146/CD140b (D, E) and CD31 (G, H) expressing cells are shown in myometrial (A, D, G) and fibroid (B, E, H) tissues. Graphs show the percentages of SUSD2+ [(C), n = 13, Wilcoxon matched-pairs signed-rank test, P = 0.004], CD146+CD140b+ [(F), n = 20 myometria, n = 13 fibroids, unpaired t test with equal SD, P = 0.04], and CD31+ [(I) (n = 3, paired t test with equal SD, P = 0.05] cells in myometrial and fibroid samples. Error bars are ± SEM. SSC-A, side scatter area, PE, phycoerythrin, APC, allophycocyanin.
Figure 3
Figure 3
Colony-forming unit (CFU) assay of myometrial cells enriched for SUSD2 or CD146/CD140b expression. Colony formation assays were performed to assess stem cell activity. Representative images are of colonies formed by (A) SUSD2, (B) SUSD2+, depleted (D) (myometrial cells depleted of CD146+CD140b+ cells) and (E) matched CD146+CD140b+ cells. Graphs show the colony forming efficiency represented as %CFUs (colony #/cells seeded × 100) of SUSD2 and SUSD2+ cells (C) (n = 11, P < 0.0001) and depleted and CD146+CD140b+ cells (F) (n = 5, P = 0.016). Statistical analysis performed by paired t test, error bars are +/− SEM. (G) %viable cells by Trypan Blue staining after bead separation of SUSD2 and SUSD2+ cells (n = 3) and after flow cytometry sorting of depleted and CD146+CD140b+ (n = 4) were compared using a Poisson-mixed-effects model with a random intercept for each individual to determine whether flow versus bead data differed significantly. Kendall’s tau was also used to determine the level of concordance between both of these methods. Different letters indicate significant differences.
Figure 4
Figure 4
CFU assay of SUSD2 + myometrial and fibroid cells under normoxic and hypoxic conditions. Colony formation assays were performed to assess stem cell activity in normal (20%, Normox) and hypoxic (2%, Hypox) oxygen levels. Representative images are of colonies formed by myometrial (AD) and fibroid (FI) SUSD2 (A, B, F, G) and SUSD2+ (C, D, H, I) cells grown under Normox (A, C, F, H) or Hypox (B, D, G, I) conditions. Graphs show the rate of colony forming efficiency represented as %CFUs/days for myometrial (E) and fibroid (J) cells. Statistical analysis performed by beta mixed effects with n = 4% transformed matched myometrial and fibroid sample values. Different letters indicate significant differences (P < 0.5). Error bars are +/− SEM.
Figure 5
Figure 5
Mesenchymal lineage differentiation of SUSD2 + cells. (A) αSMA immunofluorescence in SUSD2+ myometrial cells after differentiation and (B) αSMA mRNA fold induction with differentiation. Day 0 represents the SUSD2+ cells before plating. Columns represent the average of n = 3 patient myometrial samples. Error bars equal SEM, and ratio paired t test was used to determine significance. Representative images of SUSD2+ myometrial (C, D, G, H) and fibroid (E, F, I, J) cells grown in control growth media (C, E, G, I) and adipogenic (D, F) or osteogenic (H, J) differentiation media. Adipogenic and control cultures were stained with Oil Red O (red colour, black arrows), and osteogenic and control cultures were stained for alkaline phosphatase activity (purple colour, black arrows). 3/3 myometrial and 2/3 fibroid samples analysed showed adipogenic differentiation. All myometrial and fibroid samples showed osteogenic differentiation. Adipogenic and control cultures were counter stained with hematoxylin. Scale bars are 0.1 mm for αSMA, adipogenic and control cultures and 2 mm for osteogenic and control cultures.
Figure 6
Figure 6
In vitro decidualisation of SUSD2 + myometrial cells. To assess the ability of SUSD2+ and SUSD2 cells to decidualise, cells were cultured in untreated low serum media or with decidualisation cocktail (E2, MPA and db-cAMP). Representative images of SUSD2 (A, B) and SUSD2+ (C, D) cells grown in untreated (A, C) or with decidualisation cocktail (B, D) in low serum media after 5 days. Black arrows point to epithelial-like cells in (B) and large epithelial-like nests in (D). Immunocytochemistry for IGFBP1 is shown in (E, F) and for CD10 in (G, H). Nuclei are stained with DAPI. Fold induction of mRNA levels for PRL (I)IGFBP1 (J) and MME (CD10) (K) of SUSD2 and SUSD2+ myometrial cells, and endometrial stromal (Endo, control) cells (n = 3 each) grown in decidual induction media relative to RPL17, and untreated control cells. (L) mRNA levels of MME in SUSD2+ myometrial cells before plating (Day 0) and 5 days after treatment (Day 5) with the decidualisation cocktail. Statistical analysis was performed using the ratio paired t test; *P < 0.05. Columns represent mean fold change, and error bars represent SEM. Endo is shown for visual comparison and was not included in the statistical analyses.
Figure 7
Figure 7
Xenotransplantation and tumour formation of SUSD2 + cells. Xenotransplantation was performed to assess in vivo stem cell activity. (A) Trichrome staining of the parental fibroid for the xenotransplant images shown in this figure. Red colour shows staining of cytoplasm of muscle cells, and blue shows staining of collagen. Bar = 100 μm. (B) Graph of tumour size 8 weeks after transplantation. Statistical analysis performed was ratio paired t test for tumour area (mm2) from SUSD2 and SUSD2+ cells. *P = 0.038. (C) Representative image (n = 4) of fibroid-like tumours that formed from SUSD2 and SUSD2+ cell pellets transplanted under the renal capsule of immunocompromised mice. Representative low magnification images (D, E; bar = 1 mm) and high-magnification images (F, G; bar = 100 μm) of trichrome staining of tumours that formed in C. Dotted lines demarcate fibroid-like tumours from kidney tissue. Representative αSMA (H) and CD10 (I) immunofluorescence images of the fibroid xenotransplants. Green fluorescence observed in the kidney is background fluorescence. Merged αSMA and CD10 image with added DAPI channel shown in (J). Bar = 100 μm

References

    1. Aghajanova L, Horcajadas JA, Esteban FJ, Giudice LC. The bone marrow-derived human mesenchymal stem cell: potential progenitor of the endometrial stromal fibroblast. Biol Reprod 2010;82:1076–1087. - PMC - PubMed
    1. Arango NA, Szotek PP, Manganaro TF, Oliva E, Donahoe PK, Teixeira J. Conditional deletion of beta-catenin in the mesenchyme of the developing mouse uterus results in a switch to adipogenesis in the myometrium. Dev Biol 2005;288:276–283. - PubMed
    1. Bianco P, Robey PG, Simmons PJ. Mesenchymal stem cells: revisiting history, concepts, and assays. Cell Stem Cell 2008;2:313–319. - PMC - PubMed
    1. Biteau B, Hochmuth CE, Jasper H. Maintaining tissue homeostasis: dynamic control of somatic stem cell activity. Cell Stem Cell 2011;9:402–411. - PMC - PubMed
    1. Blanpain C, Fuchs E. Epidermal homeostasis: a balancing act of stem cells in the skin. Nat Rev Mol Cell Biol 2009;10:207–217. - PMC - PubMed

Publication types