. 2020 Nov;16(11):1949-1973.
doi: 10.1080/15548627.2020.1712108. Epub 2020 Jan 10.

SQSTM1/p62 activates NFE2L2/NRF2 via ULK1-mediated autophagic KEAP1 degradation and protects mouse liver from lipotoxicity

Affiliations

SQSTM1/p62 activates NFE2L2/NRF2 via ULK1-mediated autophagic KEAP1 degradation and protects mouse liver from lipotoxicity

Da Hyun Lee et al. Autophagy. 2020 Nov.

Abstract

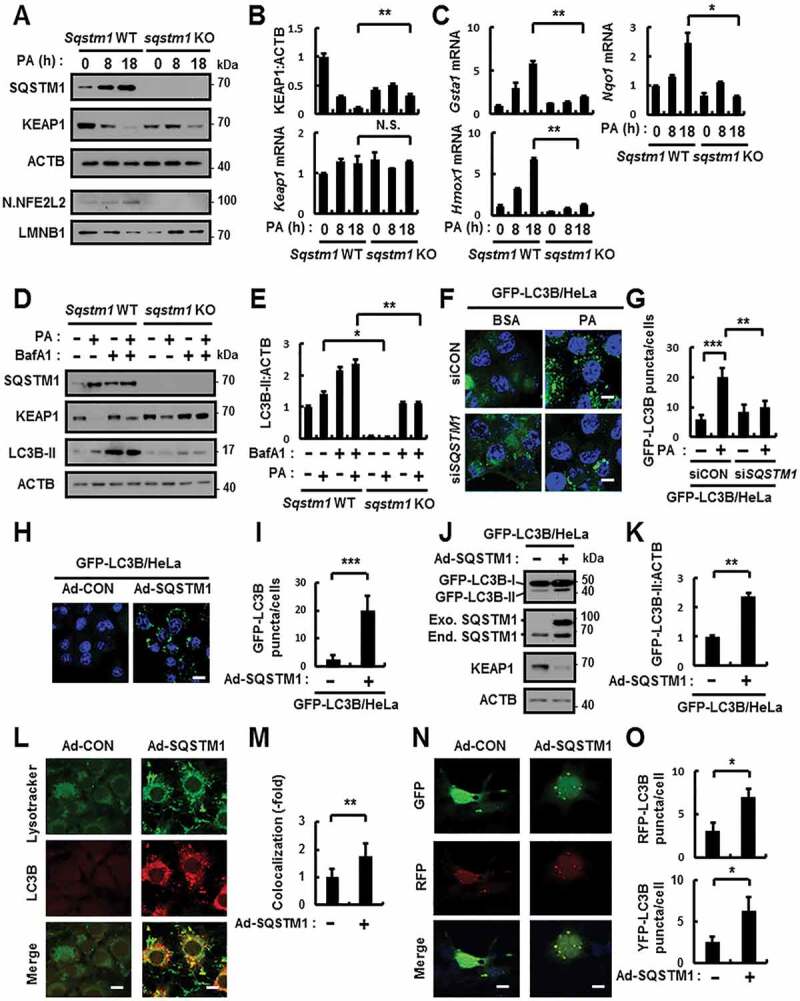
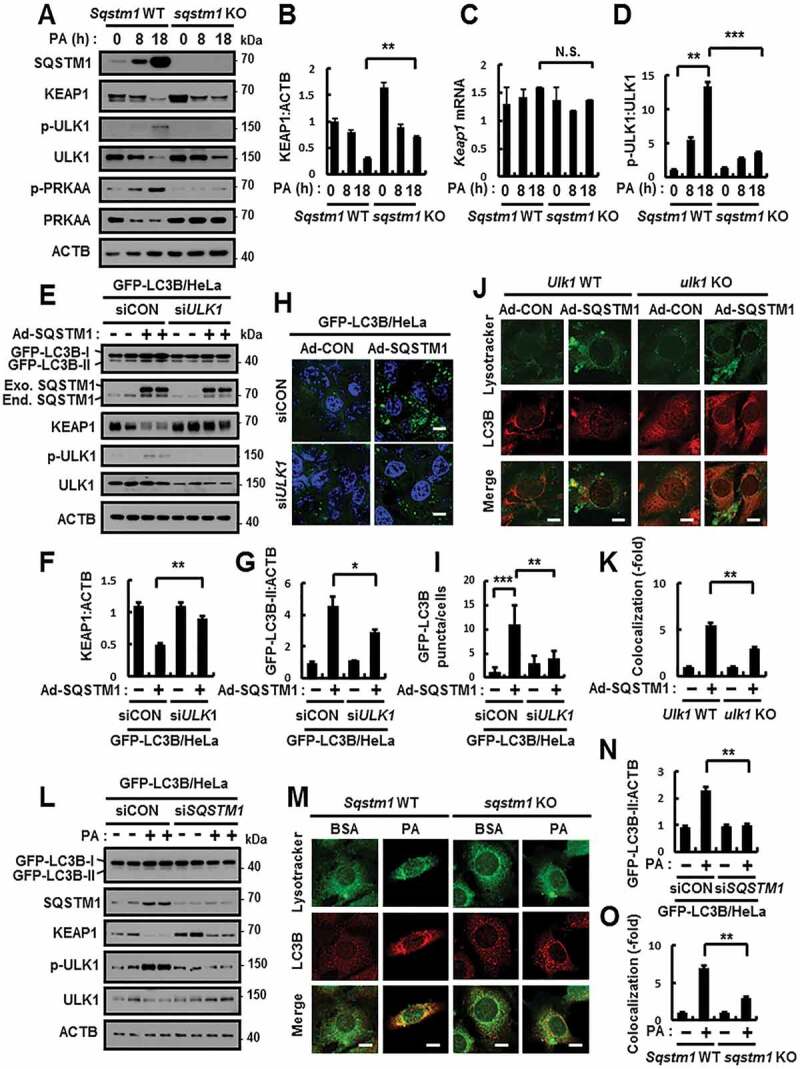
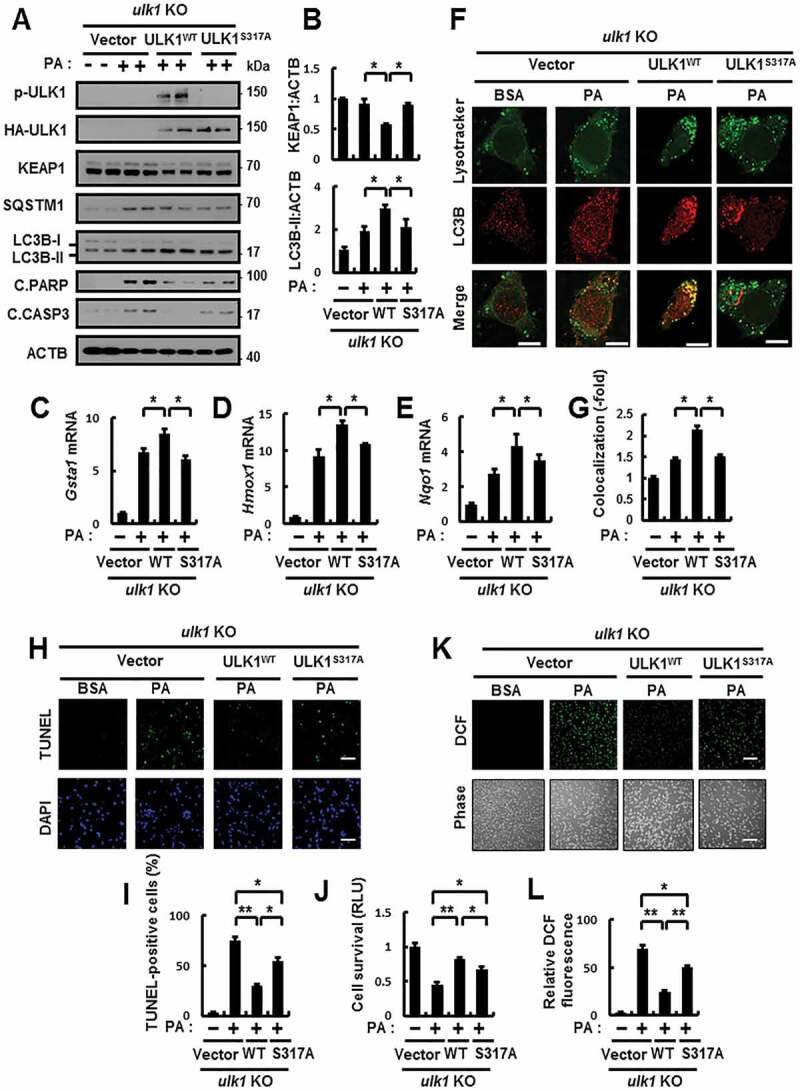
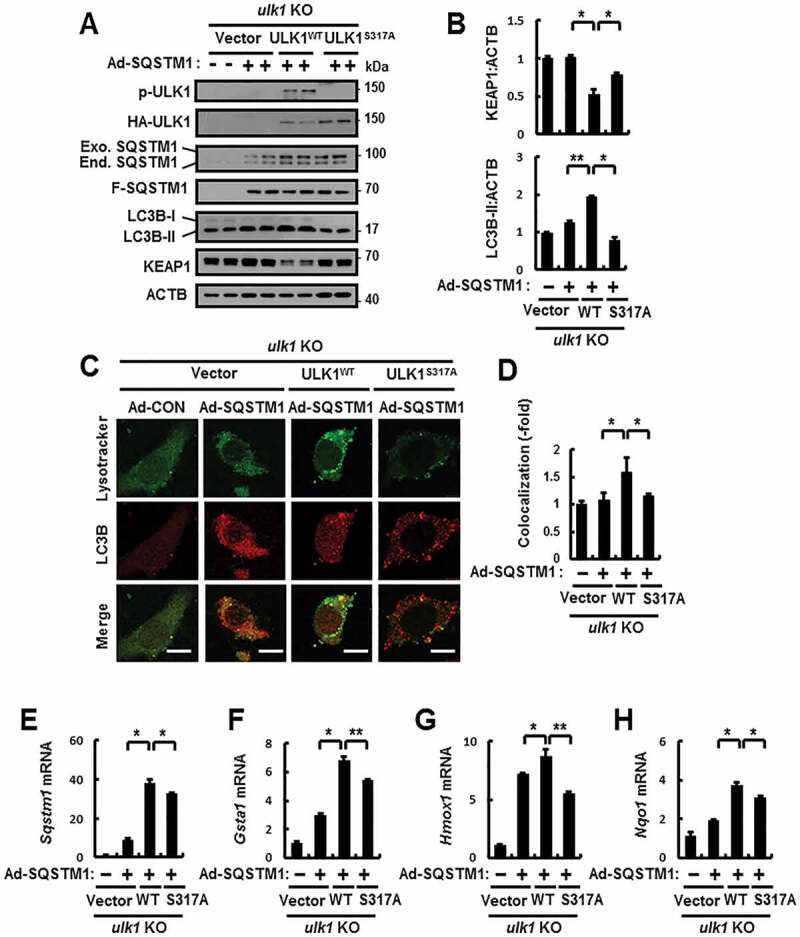
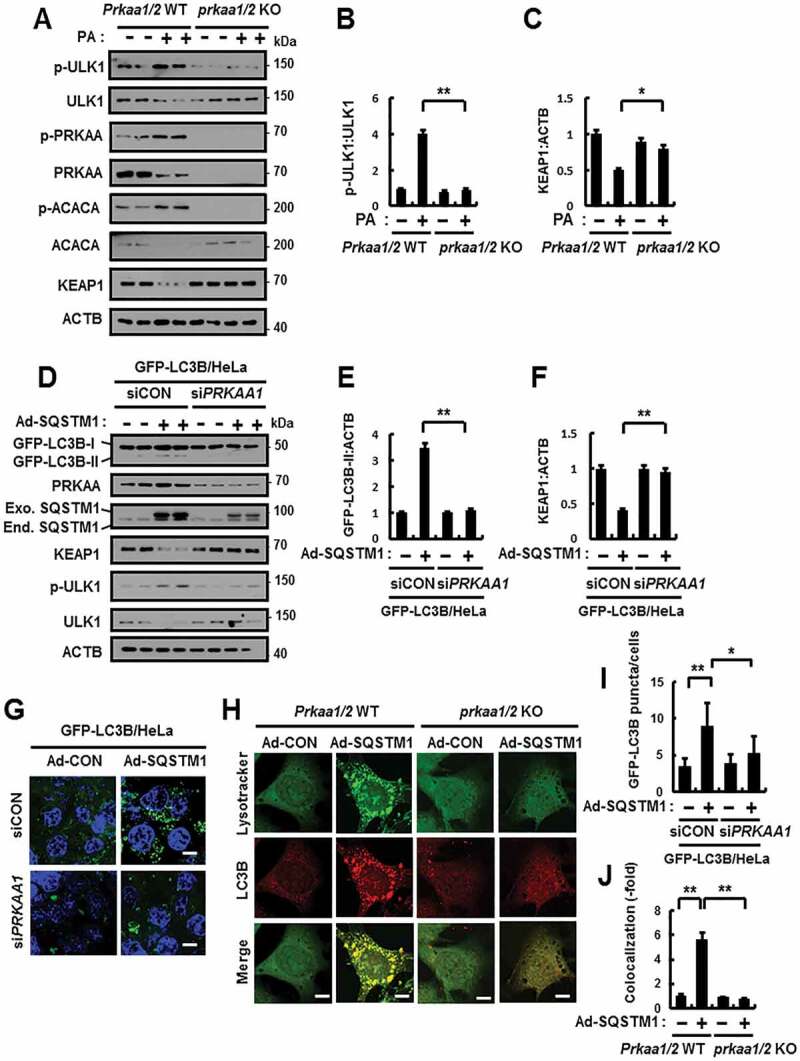
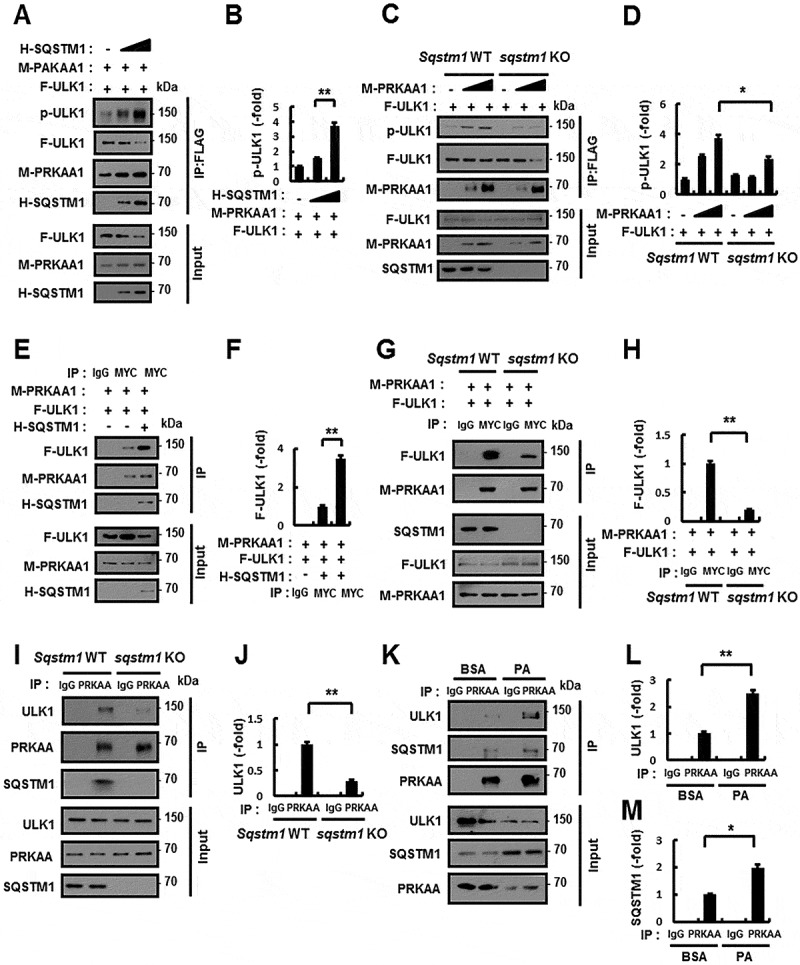
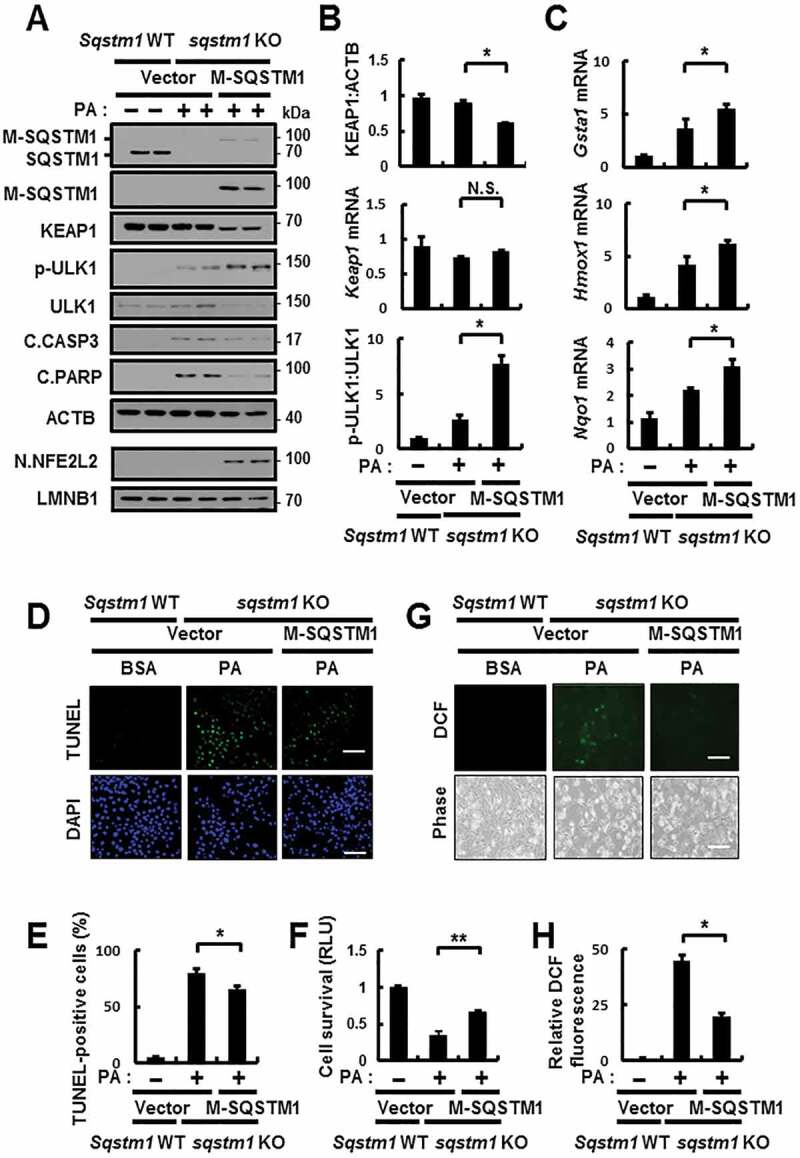
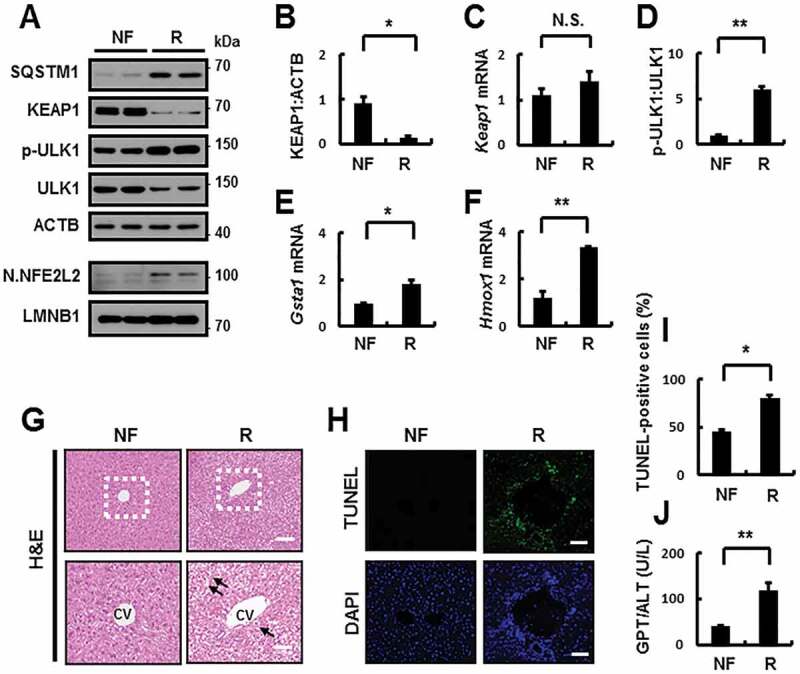
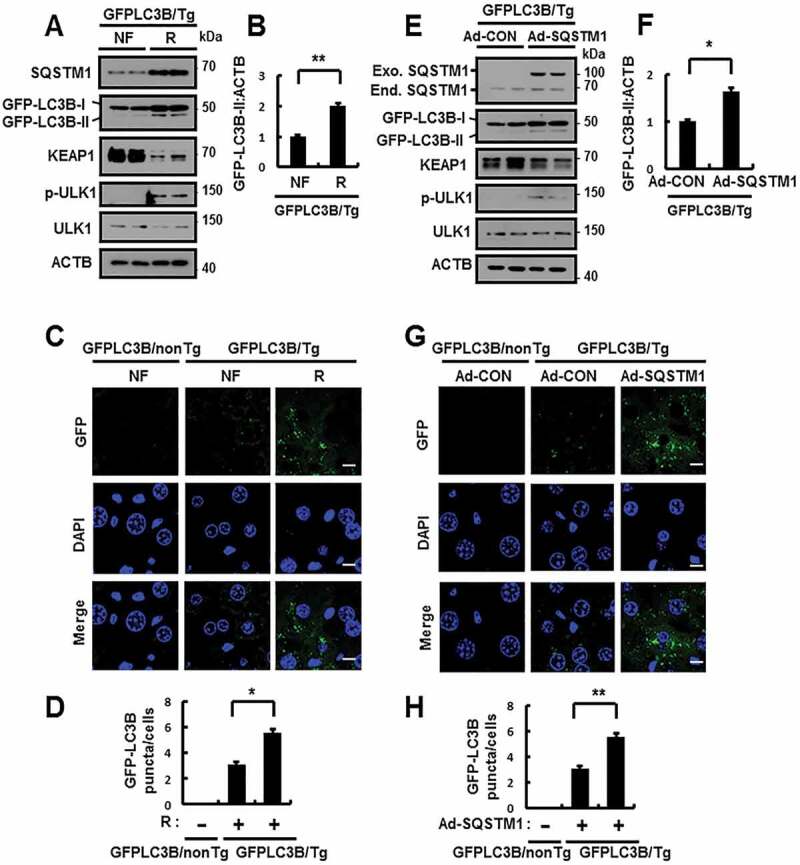
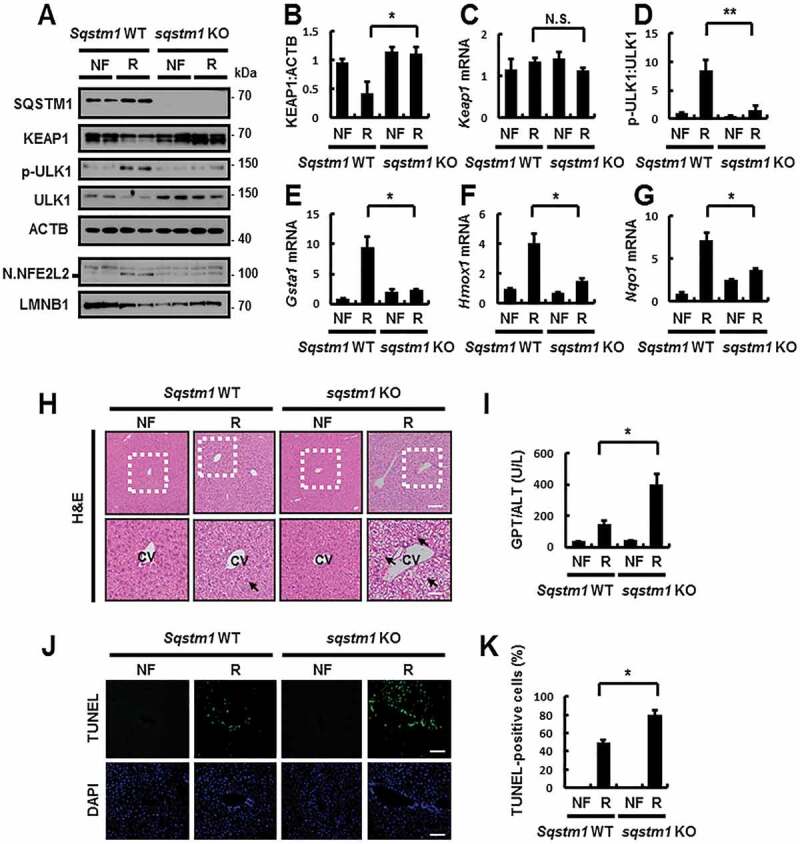
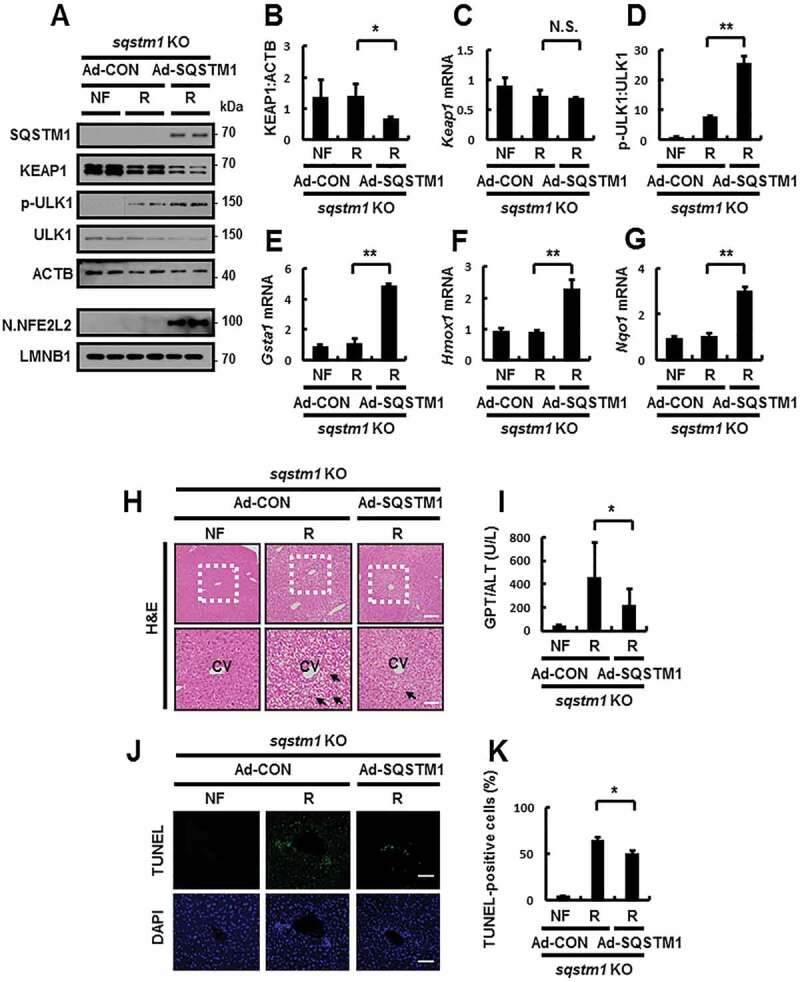
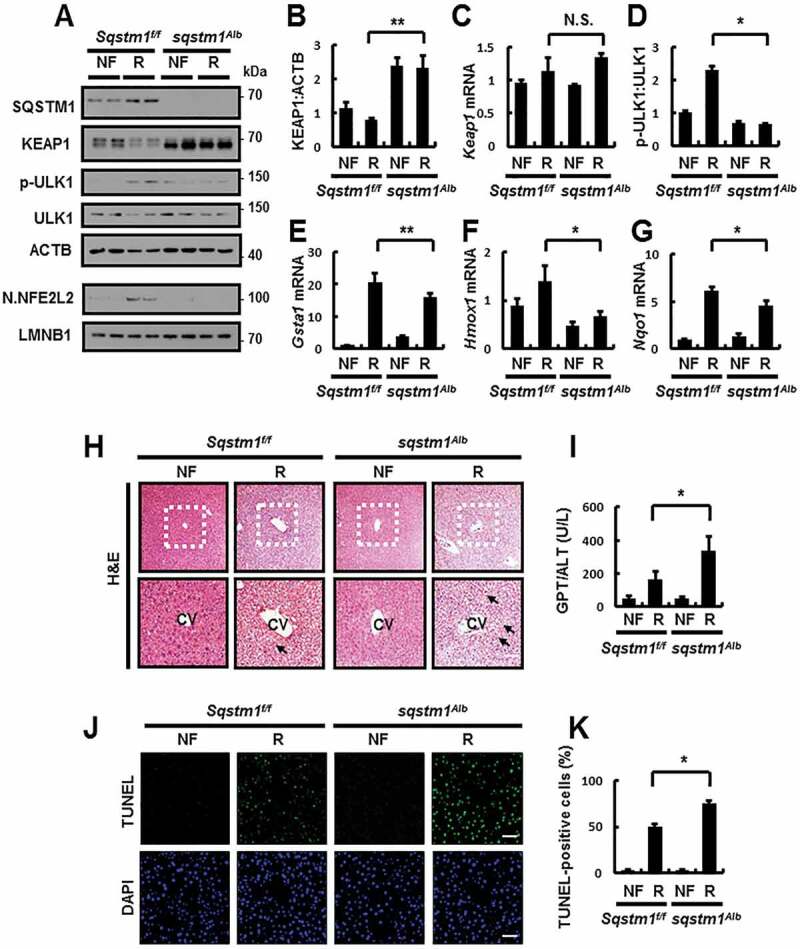
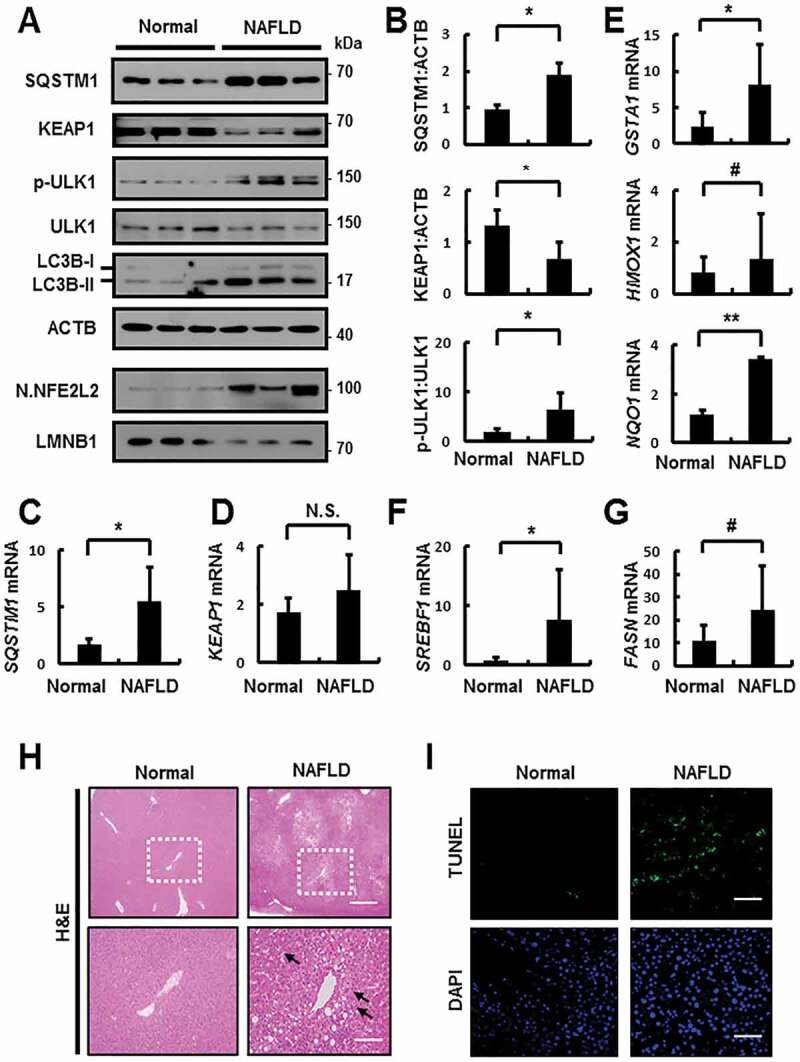
Lipotoxicity, induced by saturated fatty acid (SFA)-mediated cell death, plays an important role in the pathogenesis of nonalcoholic fatty liver disease (NAFLD). The KEAP1 (kelch like ECH associated protein 1)-NFE2L2/NRF2 (nuclear factor, erythroid 2 like 2) pathway is a pivotal defense mechanism against lipotoxicity. We previously reported that SQSTM1/p62 has a cytoprotective role against lipotoxicity through activation of the noncanonical KEAP1- NFE2L2 pathway in hepatocytes. However, the underlying mechanisms and physiological relevance of this pathway have not been clearly defined. Here, we demonstrate that NFE2L2-mediated induction of SQSTM1 activates the noncanonical KEAP1-NFE2L2 pathway under lipotoxic conditions. Furthermore, we identified that SQSTM1 induces ULK1 (unc-51 like autophagy activating kinase 1) phosphorylation by facilitating the interaction between AMPK (AMP-activated protein kinase) and ULK1, leading to macroautophagy/autophagy induction, followed by KEAP1 degradation and NFE2L2 activation. Accordingly, the activity of this SQSTM1-mediated noncanonical KEAP1-NFE2L2 pathway conferred hepatoprotection against lipotoxicity in the livers of conventional sqstm1- and liver-specific sqstm1-knockout mice. Moreover, this pathway activity was evident in the livers of patients with nonalcoholic fatty liver. This axis could thus represent a novel target for NAFLD treatment. Abbreviations: ACACA: acetyl-CoA carboxylase alpha; ACTB: actin beta; BafA1: bafilomycin A1; CM-H2DCFDA:5-(and-6)-chloromethyl-2',7'-dichlorodihydrofluorescein diacetate; CQ: chloroquine; CUL3: cullin 3; DMSO: dimethyl sulfoxide; FASN: fatty acid synthase; GSTA1: glutathione S-transferase A1; HA: hemagglutinin; Hepa1c1c7: mouse hepatoma cells; HMOX1/HO-1: heme oxygenase 1; KEAP1: kelch like ECH associated protein 1; MAP1LC3B/LC3B: microtubule-associated protein 1 light chain 3; MEF: mouse embryonic fibroblast; MTORC1: mechanistic target of rapamycin kinase complex 1; MTT: 3-(4,5-dimethylthiazol-2-yl)-2,5-diphenyltetrazolium bromide; NAC: N-acetyl-L-cysteine; NAFLD: nonalcoholic fatty liver disease; NASH: nonalcoholic steatohepatitis; NFE2L2/NRF2: nuclear factor, erythroid 2 like 2; NQO1: NAD(P)H quinone dehydrogenase 1; PA: palmitic acid; PARP: poly (ADP-ribose) polymerase 1; PRKAA1/2: protein kinase AMP-activated catalytic subunits alpha1/2; RBX1: ring-box 1; ROS: reactive oxygen species; SESN2: sestrin 2; SFA: saturated fatty acid; siRNA: small interfering RNA; SQSTM1/p62: sequestosome 1; SREBF1: sterol regulatory element binding transcription factor 1; TBK1: TANK binding kinase 1; TUNEL: terminal deoxynucleotidyl transferase-mediated dUTP nick-end labeling; ULK1: unc-51 like autophagy activating kinase.

Keywords: KEAP1-NFE2L2 pathway; NAFLD; SQSTM1; ULK1; lipotoxicity.


Conflict of interest statement

No potential conflict of interest was reported by the authors.

Figures

Figure 1.
Figure 1.
SQSTM1 activates autophagy in response to lipotoxicity. (A) Sqstm1 WT or sqstm1 KO MEFs were incubated with PA (500 μM) for indicated times and subjected to immunoblot analysis with antibodies against SQSTM1, KEAP1, ACTB (loading control), nuclear (N) NFE2L2, and LMNB1 (nuclear marker). (B) The densitometric analysis of KEAP1 immunoblots. (B–C) Total mRNA isolation from cells were treated as described in (A) and subjected to qRT-PCR analysis for relative mRNA expression of Keap1 (B), Gsta1, Hmox1, and Nqo1 (C). (D) Sqstm1 WT or sqstm1 KO MEFs were incubated with PA (500 μM) and BafA1 (10 nM) and subjected to immunoblot analysis with antibodies against SQSTM1, KEAP1, LC3B, and ACTB (loading control). (E) Densitometric analysis of LC3B-II immunoblots. (F) GFP-LC3B fluorescence analysis of puncta by confocal microscopy using GFP-LC3B HeLa cells transfected with control siRNA (siCON) or SQSTM1 siRNA and treated with PA for 18 h. The representative single optical sections and merge images are shown. Scale bar: 10 μm. (G) Quantitative analysis of GFP-LC3B puncta. (H) GFP-LC3B fluorescence analysis of puncta by confocal microscopy using GFP-LC3B HeLa cells infected with Ad-SQSTM1 for 18 h. The representative single optical sections and merge images are shown. Scale bar: 20 μm. (I) Quantitative analysis of GFP-LC3B puncta. (J) Immunoblot analysis with antibodies against GFP, SQSTM1, KEAP1 and ACTB. (K) Densitometric analysis of GFP-LC3B-II immunoblots. (L) The colocalization of Lysotracker and LC3B by confocal microscopy using Ad-SQSTM1-infected cells. The representative single optical sections and merge images are shown. Scale bar: 10 μm. (M) Quantitative analysis of colocalization. (N) Hepa1c1c7 cells were transfected with mRFP-GFP-LC3B plasmids and infected with Ad-SQSTM1. The representative single optical sections and merge images are shown. Scale bar: 10 μm. (O) Quantitative analysis of RFP-LC3B and YFP-LC3B. Data are presented as the mean ± SD from 3 independent experiments. *p < 0.05, **p < 0.01, ***p < 0.001, and N.S., not significant
Figure 2.
Figure 2.
SQSTM1-mediated autophagy activation is dependent on ULK1. (A) Sqstm1 WT or sqstm1 KO MEFs were incubated with PA (500 μM) for indicated times and subjected to immunoblot analysis with antibodies against SQSTM1, KEAP1, p-ULK1(S317), ULK1, p-PRKAA(T172), PRKAA, and ACTB (loading control). (B, D) Densitometric analysis of KEAP1 (B) and p-ULK1:ULK1 (D) immunoblots. (C) Total mRNA isolation from cells were treated as described in (A) and subjected to qRT-PCR analysis for relative mRNA expression of Keap1. (E) GFP-LC3B HeLa cells transfected with control siRNA (siCON) or ULK1 siRNA and infected with Ad-SQSTM1 for 18 h and subjected to immunoblot analysis with antibodies against GFP, SQSTM1, KEAP1, p-ULK1, ULK1, and ACTB. (F-G) Densitometric analysis of KEAP1 (F) and GFP-LC3B-II (G) immunoblots. (H–I) GFP-LC3B fluorescence analysis of puncta by confocal microscopy as described in (E), and (I) quantitative analysis of GFP-LC3B puncta. The representative single optical sections and merge images are shown. Scale bar: 10 μm. (J) Ulk1 WT or ulk1 KO MEFs were infected with Ad-SQSTM1 for 18 h, and confocal microscopy analysis of colocalization of Lysotracker and LC3B. (K) Quantitative analysis of colocalization. The representative single optical sections and merge images are shown. Scale bar: 5 μm. (L) GFP-LC3B HeLa cells were transfected with SQSTM1 siRNA and treated with PA (500 μM) for 18 h. Immunoblot analysis with antibodies against GFP, SQSTM1, KEAP1, p-ULK1(S317), ULK1, and ACTB (loading control). (N) Densitometric analysis of GFP-LC3B-II immunoblots. (M) Sqstm1 WT or sqstm1 KO MEFs were treated with PA (500 μM) for 18 h, and confocal microscopy analysis of colocalization of Lysotracker and LC3B. The representative single optical sections and merge images are shown. Scale bar: 5 μm. (O) Quantitative analysis of colocalization. Data are presented as the mean ± SD from 3 independent experiments. *p < 0.05, **p < 0.01, ***p < 0.001, and N.S., not significant
Figure 3.
Figure 3.
The phosphorylation of ULK1 is required for autophagy activation in response to lipotoxicity. (A) ulk1 KO MEFs co-transfected with vectors encoding HA-WT ULK1 or the HA-ULK1S317A mutant were incubated with PA (500 μM) for 18 h and subjected to immunoblot analysis with antibodies against p-ULK1(S317), HA-ULK1, KEAP1, SQSTM1, LC3B, C.PARP, C.CASP3, and ACTB (loading control). (B) Densitometric analysis of KEAP1 and LC3B-II immunoblots. (C–E) Total mRNA isolation from cells treated as described in (A) and subjected to qRT-PCR analysis for relative mRNA expression of Gsta1 (C), Hmox1 (D), Nqo1 (E). (F) Confocal microscopy analysis of colocalization of Lysotracker and LC3B the cells treated as described in (A). The representative single optical sections and merge images are shown. Scale bar: 10 μm. (G) Quantitative analysis of colocalization. (H) TUNEL analysis of cells treated as in (A). Scale bar: 100 μm. (I) Quantification of TUNEL-positive cells. (J) Cell viability was estimated using a Cell titer-Glo assay kit. Live cell numbers were expressed as absorbance at luminescence. (K) Reactive oxygen species (ROS) were determined using CM-H2DCFH-DA. The representative images are shown. Scale bar: 100 μm. (L) Quantification of relative DCF fluorescence. Data are presented as the mean ± SD from 3 independent experiments. *p < 0.05, **p < 0.01
Figure 4.
Figure 4.
SQSTM1-mediated ULK1 phosphorylation induces autophagy activation. (A) ulk1 KO MEFs co-transfected with vectors encoding HA-WT ULK1 or the HA-ULK1S317A mutant were infected with Ad-SQSTM1 for 18 h and subjected to immunoblot analysis with antibodies against p-ULK1(S317), HA-ULK1, SQSTM1, FLAG-SQSTM1, LC3B, KEAP1, and ACTB (loading control). (B) Densitometric analysis of KEAP1 and LC3B-II immunoblots. (C) Confocal microscopy analysis of colocalization of Lysotracker and LC3B the cells treated as described in (A). The representative single optical sections and merge images are shown. Scale bar: 10 μm. (D) Quantitative analysis of colocalization. (E–H) Total mRNA isolation from cells treated as described in (a) and subjected to qRT-PCR analysis for relative mRNA expression of sqstm1 (E), Gsta1 (F), Hmox1 (G), and Nqo1 (H). Data are presented as the mean ± SD from 3 independent experiments. *p < 0.05, **p < 0.01
Figure 5.
Figure 5.
SQSTM1-mediated autophagy activation is dependent on ULK1-AMPK axis. (A) Prkaa1/2 WT or prkaa1/2 KO MEFs were incubated with PA (500 μM) for 18 h and subjected to immunoblot analysis with antibodies against p-ULK1(S317), ULK1, p-PRKAA(T172), PRKAA, p-ACACA(S79), ACACA KEAP1 and ACTB. (B–C) Densitometric analysis of p-ULK1:ULK1 (B) and KEAP1 (C) immunoblots. (D) GFP-LC3B HeLa cells transfected with control siRNA (siCON) or PRKAA1 siRNA (siPRKAA1) and infected with Ad-SQSTM1 for 18 h and subjected to immunoblot analysis with antibodies against GFP, PRKAA, SQSTM1, KEAP1, p-ULK1(S317), ULK1, and ACTB. (E–F) Densitometric analysis of GFP-LC3B-II (E) and KEAP1 (F) immunoblots. (G) Confocal microscopy analysis of GFP-LC3B puncta and representative single optical sections and merge images are shown. Scale bar: 10 μm. (H) Prkaa1/2 WT or prkaa1/2 KO MEFs were infected with Ad-SQSTM1 for 18 h, and confocal microscopy analysis of Lysotracker and LC3B, and representative single optical sections and merge images are shown. Scale bar: 5 μm. (I) Quantitative analysis of GFP-LC3B puncta. (J) Quantitative analysis of colocalization. Data are presented as the mean ± SD from 3 independent experiments. *p < 0.05, **p < 0.01
Figure 6.
Figure 6.
SQSTM1-mediated phosphorylation of ULK1 via enhanced interactions between PRKAA1/2 and ULK1. (A) Lysates from HEK-293 cells transfected with vectors encoding MYC-PRKAA1 (M-PRKAA1) and FLAG-ULK1 (F-ULK1) together with those expressing HA-SQSTM1 (H-SQSTM1) were subjected to immunoprecipitation with antibodies against FLAG, and the resulting precipitates (IPs) as well as whole cell lysates (WCLs) were subjected to immunoblot analysis with antibodies against p-ULK1, FLAG, MYC, and HA. (B) Densitometric analysis was obtained. (C) Lysates from Sqstm1 WT or sqstm1 KO MEFs were transfected with vectors encoding FLAG-ULK1 together with those expressing MYC-PRKAA1, and subjected to immunoprecipitation with antibodies to FLAG, and the resulting IPs and WCLs were subjected to immunoblot analysis with antibodies against p-ULK1(S317), FLAG, and MYC. (D) Densitometric analysis was obtained. (E) Lysates from HEK-293 cells transfected with vectors encoding MYC-PRKAA1, FLAG-ULK1, and HA-SQSTM1 were subjected to immunoprecipitation with antibodies against MYC, and the resulting IPs and WCLs were subjected to immunoblot analysis with antibodies against FLAG, MYC, and HA. (F) Densitometric analysis was obtained. (G) Sqstm1 WT or sqstm1 KO MEFs transfected with vectors encoding MYC-PRKAA1 and FLAG-ULK1 were subjected to immunoprecipitation with antibodies against MYC, and the resulting IPs and WCLs were subjected to immunoblot analysis with antibodies against FLAG, MYC, and SQSTM1. (H) Densitometric analysis was obtained. (I) Lysates from Sqstm1 WT or sqstm1 KO MEFs were subjected to immunoprecipitation with antibodies against PRKAA, and the resulting IPs and WCLs were subjected to immunoblot analysis with antibodies against ULK1, PRKAA, and SQSTM1. (J) Densitometric analysis was obtained. (K) Lysates from Hepa1c1c7 cells were treated with PA (500 μM) and subjected to immunoprecipitation with antibodies against PRKAA, and the resulting IPs and WCLs were subjected to immunoblot analysis with antibodies against ULK1, SQSTM1, and PRKAA. (L-M) Densitometric analysis of ULK1 (L) and SQSTM1 (M) immunoblots. Data are presented as the mean ± SD from 3 independent experiments. *p < 0.05, **p < 0.01
Figure 7.
Figure 7.
SQSTM1-mediated noncanonical activation of the KEAP1-NFE2L2 pathway is required for cytoprotection against lipotoxicity. (A) sqstm1 KO MEFs were transfected with MYC-SQSTM1 and treated with PA (500 μM) for 18 h, and subjected to immunoblot analysis of SQSTM1, MYC, KEAP1, p-ULK1(S317), ULK1, C.CASP3, C.PARP, ACTB (loading control), nuclear NFE2L2, and LMNB1 (nuclear marker). (B) Densitometric analysis of KEAP1 and p-ULK1:ULK1 immunoblots. (B–C) Total mRNA isolation from cells were treated as described in (A) and subjected to qRT-PCR analysis for relative mRNA expression of Keap1 (B), Gsta1, Hmox1, Nqo1 (C). (D) TUNEL analysis of cells treated as in (A). Scale bar: 100 μm. (E) Quantification of TUNEL-positive cells. (F) Cell viability was estimated using a Cell titer-Glo assay kit. Live cell numbers were expressed as absorbance at luminescence. (G) Reactive oxygen species (ROS) were determined using CM-H2DCFH-DA. The representative images are shown. Scale bar: 100 μm. (H) Quantification of relative DCF fluorescence. Data are presented as the mean ± SD from 3 independent experiments. *p < 0.05, **p < 0.01, and N.S., not significant
Figure 8.
Figure 8.
Activation of the SQSTM1-dependent noncanonical KEAP1-NFE2L2 pathway in mouse liver under lipotoxic stress. C57BL/6J mice were maintained in a non-fasted state (NF) or fasted overnight and then re-fed a high-carbohydrate, fat-free diet (R). These animals were randomly assigned to 2 groups (8–9 mice in each group). (A) Immunoblot analysis of SQSTM1, KEAP1, p-ULK1(S317), ULK1, ACTB (loading control), nuclear NFE2L2, and LMNB1 (nuclear marker). (B, D) Densitometric analysis of KEAP1 (B) and p-ULK1:ULK1 (D) immunoblots. (C, E-F) Total mRNA isolation from tissue and subjected to qRT-PCR analysis for relative mRNA expression of Keap1 (C), Gsta1 (E), Hmox1 (F). (G) Liver sections of mice were stained with hematoxylin and eosin (H&E). CV, central vein. Scale bar: 200 μm. (H) Images from TUNEL analysis of liver sections. Scale bar: 200 μm. (I-J) Quantification of TUNEL-positive cells (I) and serum GPT/ALT (glutamic pyruvic transaminase, soluble) levels (J) in mice. Data are presented relative to corresponding values in non-fasted mice and are means ± standard errors for 8–9 mice per group. *p < 0.05, **p < 0.01, and N.S., not significant
Figure 9.
Figure 9.
SQSTM1 activates autophagy in mouse liver under lipotoxic stress. GFP-LC3B transgenic mice were maintained in a non-fasted state (NF) or fasted overnight and then re-fed a high-carbohydrate, fat-free diet (R). These animals were randomly assigned to 2 groups (3–4 mice in each group). (A) Immunoblot analysis of SQSTM1, GFP, KEAP1, p-ULK1(S317), ULK1, and ACTB (loading control). (B) Densitometric analysis of GFP-LC3B-II immunoblots. (C) GFP-LC3B fluorescence analysis of puncta by confocal microscopy. Scale bar: 10 μm. (D) Quantitative analysis of GFP-LC3B puncta. GFP-LC3B transgenic mice were injected with empty vector (Ad-CON)- or SQSTM1 (Ad-SQSTM1)-expressing adenovirus. (E) Immunoblot analysis of SQSTM1, GFP, KEAP1, p-ULK1(S317), ULK1, and ACTB (loading control). (F) Densitometric analysis of GFP-LC3B-II immunoblots. (G) GFP-LC3B fluorescence analysis of puncta by confocal microscopy. Scale bar: 10 μm. (H) Quantitative analysis of GFP-LC3B puncta. Data are presented relative to corresponding values in non-fasted mice and are means ± standard errors for 3–4 mice per group. *p < 0.05 and **p < 0.01
Figure 10.
Figure 10.
SQSTM1 has a hepatoprotective role against acute lipotoxicity in the mouse liver. Sqstm1 WT or sqstm1 KO mice were maintained in a non-fasted state (NF) or fasted overnight and then re-fed a high-carbohydrate, fat-free diet (R). These animals were randomly assigned to 4 groups (5–6 mice in each group). (A) Immunoblot analysis of SQSTM1, KEAP1, p-ULK1(S317), ULK1, ACTB (loading control), nuclear NFE2L2, and LMNB1 (nuclear marker). (B, D) Densitometric analysis of KEAP1 (B) and p-ULK1:ULK1 (D) immunoblots. (C, E-G) Total mRNA isolation from tissue and subjected to qRT-PCR analysis for relative mRNA expression of Keap1 (C), Gsta1 (E), Hmox1 (F) and Nqo1 (G). (H) Liver sections of mice were stained with H&E. CV, central vein. Scale bar: 200 μm. (I) Serum GPT/ALT levels in mice. (J) Images from TUNEL analysis of liver sections. Scale bar: 200 μm. (K) Quantification of TUNEL-positive cells in liver sections. Data are presented relative to corresponding values in non-fasted mice and are means ± standard errors for 5–6 mice per group. *p < 0.05, **p < 0.01, and N.S., not significant
Figure 11.
Figure 11.
Reinforcement of SQSTM1 ameliorates acute lipotoxicity-induced liver injury in sqstm1 KO mice. sqstm1 KO mice were injected with control vector (Ad-CON)- or SQSTM1 (Ad-SQSTM1)-expressing adenovirus and maintained in a non-fasted state (NF) or fasted overnight and then re-fed a high-carbohydrate, fat-free diet (R). These animals were randomly assigned to 3 groups (5–6 mice in each group). (A) Immunoblot analysis of SQSTM1, KEAP1, p-ULK1(S317), ULK1, ACTB (loading control), nuclear NFE2L2, and LMNB1 (nuclear marker). (B, D) Densitometric analysis of KEAP1 (B) and p-ULK1:ULK1 (D). (C, E-G) qRT-PCR analysis for relative mRNA expression of Keap1 (C), Gsta1 (E), Hmox1 (F), and Nqo1 (G). (H) Liver sections from mice were stained with H&E. CV, central vein. Scale bar: 200 μm. (I) Serum GPT/ALT levels in mice. (J) Images from TUNEL analysis of liver sections. Scale bar: 200 μm. (K) Quantitative analysis of TUNEL-positive cells in liver sections. Data are presented relative to the corresponding value for non-fasted mice and are means ± standard errors for 5–6 mice per group. *p < 0.05, **p < 0.01, and N.S., not significant
Figure 12.
Figure 12.
Hepatic SQSTM1 protects against acute lipotoxicity in the mouse liver. Sqstm1 f/f or sqstm1Alb mice were maintained in a non-fasted state (NF) or fasted overnight and then re-fed a high-carbohydrate, fat-free diet (R). These animals were randomly assigned to 4 groups (5–6 mice in each group). (A) Immunoblot analysis of SQSTM1, KEAP1, p-ULK1(S317), ULK1, ACTB (loading control), nuclear NFE2L2, and LMNB1 (nuclear marker). (B, D) Densitometric analysis of KEAP1 (B) and p-ULK1:ULK1 (D) immunoblots. (C, E–G) qRT-PCR analysis for relative mRNA expression of Keap1 (C), Gsta1 (E), Hmox1 (F), and Nqo1 (G). (H) Liver sections of mice were stained with H&E. CV, central vein. Scale bar: 200 μm. (I) Serum GPT/ALT levels in mice. (J) Images from TUNEL analysis of liver sections. Scale bar: 200 μm. (K) Quantitative analysis of TUNEL-positive cells in liver sections. Data are presented relative to corresponding values in non-fasted mice and are means ± standard errors for 5–6 mice per group. *p < 0.05, **p < 0.01, and N.S., not significant
Figure 13.
Figure 13.
Reinforcement of SQSTM1 ameliorates acute lipotoxicity in liver-specific sqstm1 KO mouse livers. sqstm1Alb mice were injected with control vector (Ad-CON)- or SQSTM1 (Ad-SQSTM1)-expressing adenovirus and maintained in a non-fasted state (NF) or fasted overnight and then re-fed a high-carbohydrate, fat-free diet (R). These animals were randomly assigned to 3 groups (5–6 mice in each group). (A) Immunoblot analysis of SQSTM1, KEAP1, p-ULK1(S317), ULK1, ACTB (loading control), nuclear NFE2L2, and LMNB1 (nuclear marker). (B, D) Densitometric analysis of KEAP1 (B) and p-ULK1:ULK1 (D). (C, E-G) qRT-PCR analysis for relative mRNA expression of Keap1 (C), Gsta1 (E), Hmox1 (F), and Nqo1 (G). (H) Liver sections from mice were stained with H&E. CV, central vein. Scale bar: 200 μm. (I) Serum GPT/ALT levels in mice. (J) Images from TUNEL analysis of liver sections. Scale bar: 200 μm. (K) Quantitative analysis of TUNEL-positive cells in liver sections. Data are presented relative to the corresponding value for non-fasted mice and are means ± standard errors for 5–6 mice per group. *p < 0.05, **p < 0.01, and N.S., not significant
Figure 14.
Figure 14.
Activation of the SQSTM1-dependent noncanonical KEAP1-NFE2L2 pathway through ULK1 phosphorylation in patients with nonalcoholic fatty liver disease (NAFLD). (A) Immunoblotting for SQSTM1, KEAP1, p-ULK1(S317), ULK1, LC3B, ACTB (loading control), nuclear NFE2L2, and LMNB1 (nuclear marker) from human liver samples. (B) Densitometric analysis of SQSTM1, KEAP1, and p-ULK1:ULK1 immunoblots. (C–G) qRT-PCR analysis for relative mRNA expression of SQSTM1 (C), KEAP1 (D), GSTA1, HMOX1, NQO1 (E), SREBF1 (F), and FASN (G). (H) Representative images of H&E staining. Scale bar: 200 μm. (I) TUNEL analysis of liver sections from patients with NAFLD. Scale bar: 200 μm. Data are means ± standard errors for 3 per group. *p < 0.05, **p < 0.01, #p = 0.1, and N.S., not significant

References

    1. Browning JD, Horton JD.. Molecular mediators of hepatic steatosis and liver injury. J Clin Invest.2004 Jul;114(2):147–52. PubMed PMID: 15254578; PubMed Central PMCID: PMCPMC449757. - PMC - PubMed
    1. Fuchs M, Sanyal AJ.. Lipotoxicity in NASH. J Hepatol. 2012. January;56(1):291–293. PubMed PMID: 21741924. - PubMed
    1. Musso G, Cassader M, Gambino R. Non-alcoholic steatohepatitis: emerging molecular targets and therapeutic strategies. Nat Rev Drug Discov. 2016. April;15(4):249–274. PubMed PMID: 26794269. - PubMed
    1. Garcia-Ruiz C, Fernandez-Checa JC. Mitochondrial oxidative stress and antioxidants balance in fatty liver disease. Hepatol Commun. 2018. December;2(12):1425–1439. PubMed PMID: 30556032; PubMed Central PMCID: PMCPMC6287487. - PMC - PubMed
    1. Kensler TW, Wakabayashi N, Biswal S. Cell survival responses to environmental stresses via the Keap1-Nrf2-ARE pathway. Annu Rev Pharmacol Toxicol. 2007;47:89–116. PubMed PMID: 16968214. - PubMed

Publication types

MeSH terms