. 2020 Mar 2;217(3):e20191306.
doi: 10.1084/jem.20191306.

Absence of GP130 cytokine receptor signaling causes extended Stüve-Wiedemann syndrome

Affiliations

Absence of GP130 cytokine receptor signaling causes extended Stüve-Wiedemann syndrome

Yin-Huai Chen et al. J Exp Med. .

Abstract

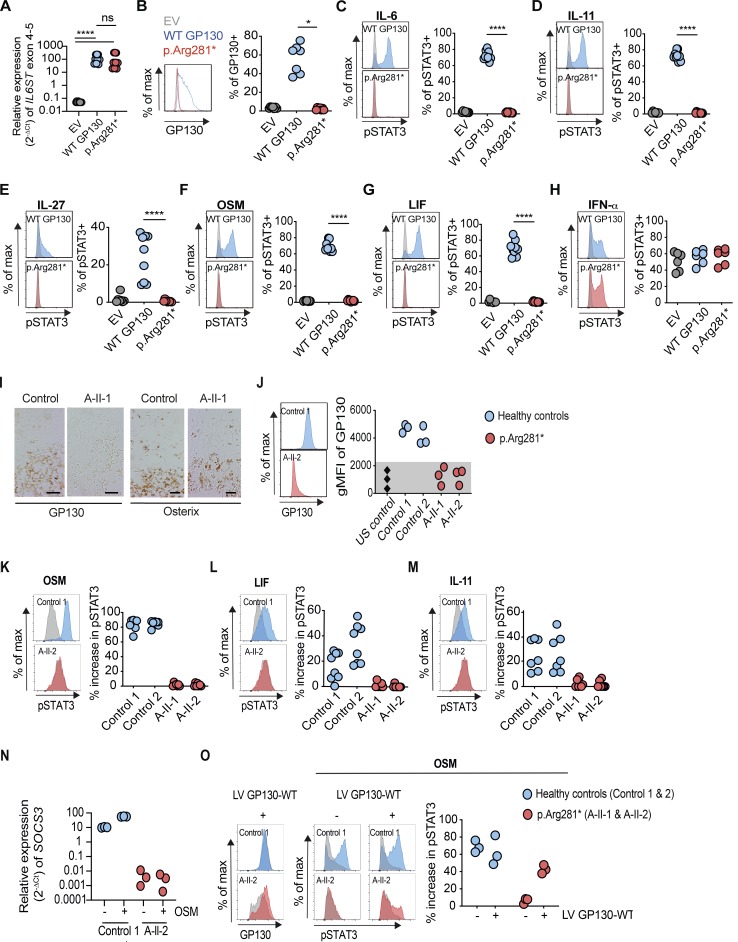
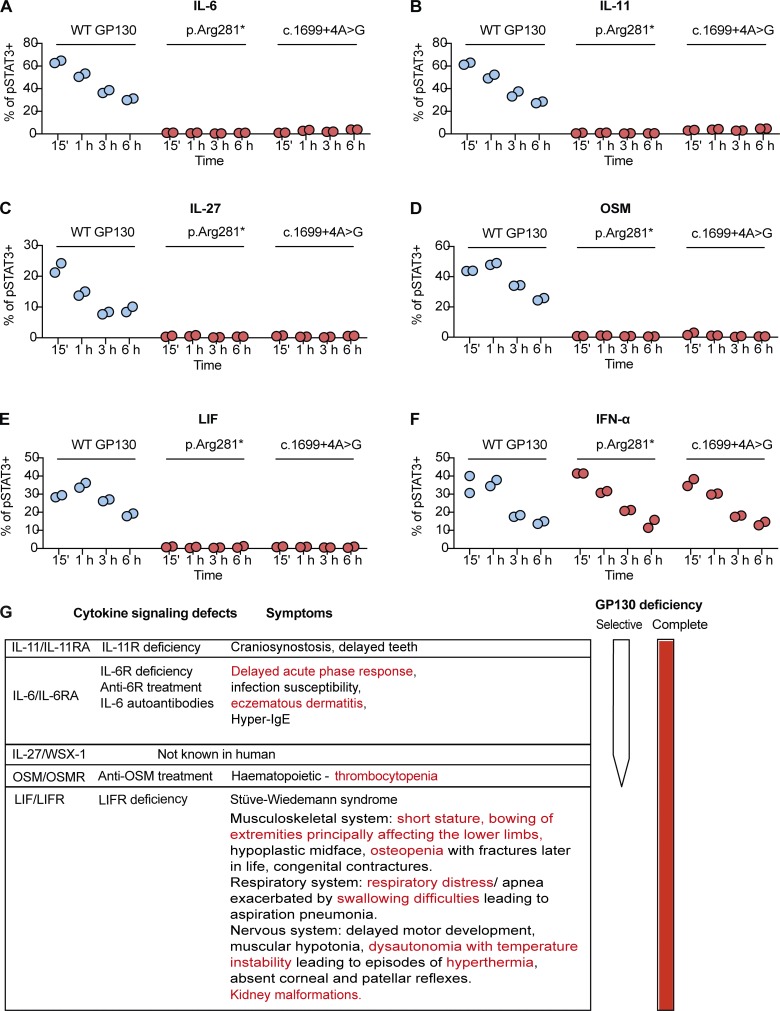
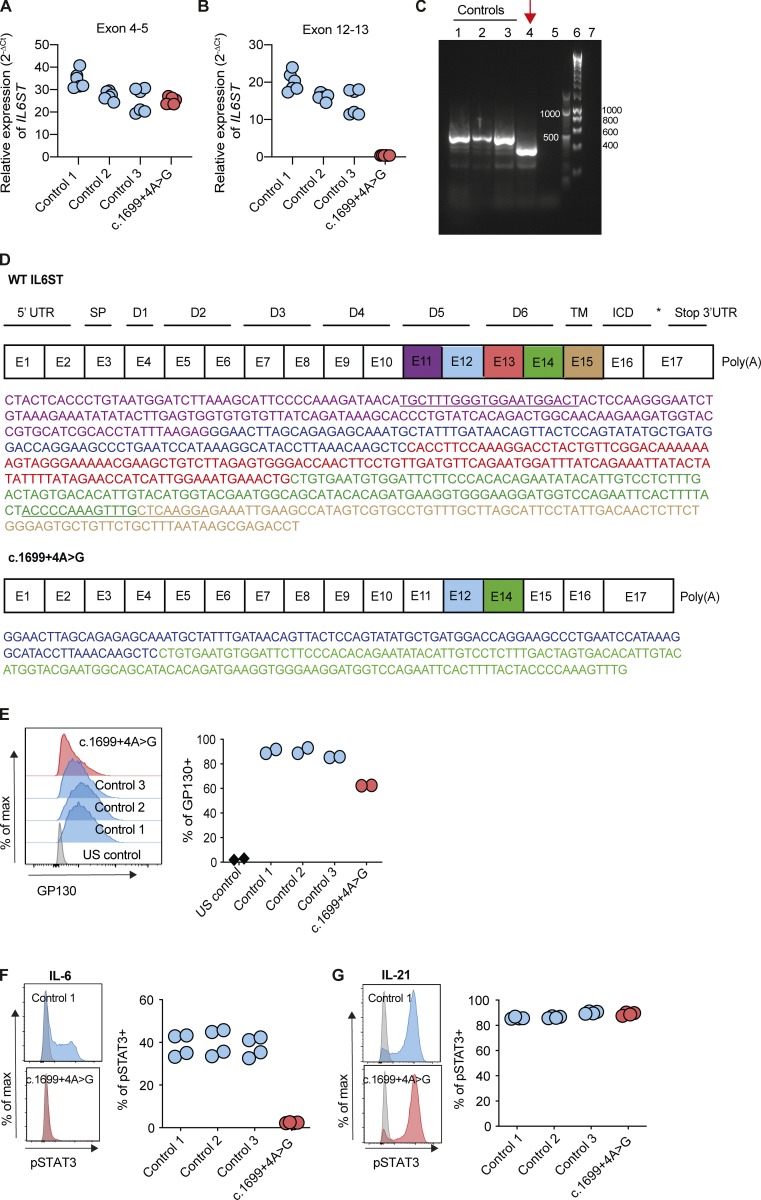
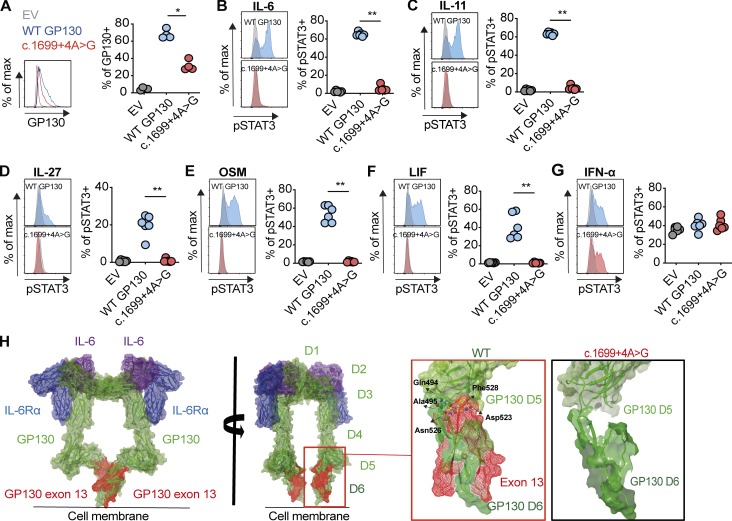
The gene IL6ST encodes GP130, the common signal transducer of the IL-6 cytokine family consisting of 10 cytokines. Previous studies have identified cytokine-selective IL6ST defects that preserve LIF signaling. We describe three unrelated families with at least five affected individuals who presented with lethal Stüve-Wiedemann-like syndrome characterized by skeletal dysplasia and neonatal lung dysfunction with additional features such as congenital thrombocytopenia, eczematoid dermatitis, renal abnormalities, and defective acute-phase response. We identified essential loss-of-function variants in IL6ST (a homozygous nonsense variant and a homozygous intronic splice variant with exon skipping). Functional tests showed absent cellular responses to GP130-dependent cytokines including IL-6, IL-11, IL-27, oncostatin M (OSM), and leukemia inhibitory factor (LIF). Genetic reconstitution of GP130 by lentiviral transduction in patient-derived cells reversed the signaling defect. This study identifies a new genetic syndrome caused by the complete lack of signaling of a whole family of GP130-dependent cytokines in humans and highlights the importance of the LIF signaling pathway in pre- and perinatal development.


Conflict of interest statement

Disclosures: Dr. Chen reported grants from Celgene during the conduct of the study and grants from Celgene outside the submitted work. Dr. Devey is an employee and stockholder of Celgene and is a former employee and stockholder of GlaxoSmithKline. Dr. Shanmugasundaram is an employee and stockholder of Celgene and a stockholder of Pfizer. Celgene has now become a wholly-owned subsidiary of Bristol-Myers Squibb. Dr. Aschenbrenner reported grants from UCB Pharma GmbH and grants from Eli Lilly and Company outside the submitted work. Dr. Uhlig reported grants from Celgene during the conduct of the study, grants from UCB Pharma, grants from Eli Lilly, personal fees from AbbVie, personal fees from Pfizer, and "other" from Regeneron outside the submitted work. No other disclosures were reported.

Figures

Figure 1.
Figure 1.
Clinical phenotypes and genetic findings in families A, B, and C. (A) Pedigree of family A. Patients affected by an extended STWS and homozygous for the pathogenic variant NM_002184.3; c.841C>T; p.Arg281* in IL6ST are shown in solid symbols (A-II-1, female fetus from terminated pregnancy; A-II-2, live-born female infant; A-II-3, fetus). (B–E) Radiographs of patient A-II-1 and A-II-2 with a skeletal manifestation with bent bone dysplasia. Radiograph of A-II-1 (B) shows severe bowing of the long bones, particularly striking in the lower extremities. Magnified views of the extremities of A-II-1 and A-II-2 (C, D, and E) demonstrate broadening of the metaphyses with a triangular zone of irregular trabecular pattern and cortical thickening of the concave side of the diaphyses. (F) Overview of H&E staining of femur sections from A-II-1, featuring uneven bone trabeculation pattern in the tubular bones. Scale bar indicates 5 mm. (G) Sanger sequencing of heterozygous c.841C>T variant in the parents (A-I-1 and A-I-2) and unaffected offspring (A-II-3) and homozygous variant in both A-II-1 and A-II-2. (H) Pedigree of family B. Patients with c.841C>T; p.Arg281* in IL6ST are shown in solid black symbols (B-II-3, male fetus; B-II-4, male fetus). (I–K) Fetal ultrasound pictures of patient B-II-3 and B-II-4 showing bent long bones: B-II-3 (I) shows obtuse bending of the femur, and B-II-4 (J and K) shows sharp bending of the tibia, fibula, radius, and ulna. (L) Sequencing of heterozygous c.841C>T variant in the parents (B-I-1 and B-I-2) and homozygous variant in B-II-4. (M) Pedigree of family C. Patient with homozygous intronic IL6ST pathogenic variant (c.1699+4A>G) in solid black symbols (C-II-3). C-II-1 is in solid gray because he was clinically affected but his DNA was not available for sequencing. (N and O) Radiographs of patients C-II-1 and C-II-3, demonstrating mild broadening of the metaphyses with mild undermineralization and diaphyseal cortical thickening. (P) Sequencing trace of the homozygous c.1699+4A>G variant in IL6ST of patient C-II-3. (Q) Sequences covering the end of exon 13 and the start of intron 13 of the IL6ST gene in humans, in comparison to other species from the UCSC genome browser. In A, H, and M, black symbols represent affected status with confirmed mutations; gray solid symbols indicate clinically affected patient whose DNA was not available for genetic analyses. Where genotype has been confirmed by sequencing, it is referred to as either WT/V or V/V under the symbol. WT, wild-type (black); V, variant (red).
Figure S1.
Figure S1.
Bone phenotype, MLPA analysis of the IL6ST gene, RNA-seq expression data of multiple cytokine receptor units in control amniocytes, the parental analysis of GP130 and pSTAT3 response, and PCR analysis. (A) H&E staining of femur bones from affected patient A-II-1 and an age-matched control. Several anatomic regions are labeled and color-coordinated, for guidance in the other panels. Scale bar indicates 1 mm. (B) Growth plate zones following safranin O/fast green (SOFG) staining show resting (left), proliferative (middle), and hypertrophic (right panel) zones. Scale bar indicates 50 µm. (C) Multinuclear osteoclasts in the primary spongiosa were visualized by immunostaining for Cathepsin K and counterstaining with hematoxylin. Scale bar indicates 20 µm. (D) Quantification of the number of nuclei in cathepsin K–positive cells, with only cells containing two or more nuclei counted. (E) Quantification of the size of cathepsin K–positive cells containing two or more nuclei. (C–E) Six visual fields analyzed with three images from each side of the bone; black bars indicate control; gray bars indicate patient A-II-1. Note that colored boxes surrounding images in B and C correspond to regions indicated in A. (F) Ratio for each probe (deletions would cause a ratio of <0.75 and duplications of >1.3). Exons 4, 8, 13, and 17 in IL6ST and genes upstream and downstream of IL6ST (ANKRD55 and IL31RA) were investigated. (G) RNA-seq expression of multiple cytokine receptor units in control amniocytes. In case of multiple RNA-Seq Probe Set IDs of each receptor, the one with highest expression was shown. Blue lines represent the median of n = 11 individual amniocyte samples. GP130-dependent cytokine receptors are shown in red. Each dot represents one individual sample, data taken from Kang et al. (2015). (H–J) GP130 surface expression in ex vivo CD3+CD4+, CD3+CD8+, and CD14+ cells gated from peripheral blood mononuclear cells of heterozygous parents compared with four healthy donors. Representative histograms of one control and the father (left) and geometric mean florescence intensity (gMFI; right) are shown. (K–M) Response of pSTAT3 in heterozygous parents after stimulation with IL-6 (100 ng/ml for 15 min) compared with four healthy controls (gray, unstimulated; blue and red, stimulated). Representative histograms are shown on the left. (H–M) Blue, controls; red, father (upper triangle) and mother (lower triangle). Dashed line indicates the lowest value from the healthy controls. (O–P) Agarose gels for RT-PCR and nested PCR using four primer pairs (pair 1, exon 11 and boundary of exons 14–15; pair 2, exons 12–16; pair 3, exons 12–14; pair 4 exons 11–16). 1, amplicon from cDNA from EBV-LCLs of patient C-II-3 with c.1699+4A>G variant; 2–3, control EBV-LCLs, 100-bp ladder on the side of each gel. (P) Nested PCR using amplicons from exons 12–14 with primer pair 3. Amplicon of expected 218-bp size in control samples versus amplicon of ∼70-bp in patient sample confirming skipping of exon 13. 1:100 and 1:500 indicate dilution ratio for the RT-PCR products.
Figure 2.
Figure 2.
Homozygosity for IL6ST p.Arg281* variant completely abrogates GP130-dependent IL-6, IL-11, IL-27, OSM, and LIF signaling. (A) Gene expression (2−ΔCt) of IL6ST exons 4–5 from p.Arg281* transfected GP130-deficient HEK293 cells 24 h after transfection, relative to endogenous control gene RPLPO. Data represent nine technical repeats from three independent experiments. (B) GP130 surface expression in p.Arg281* transfected GP130-deficient HEK293 cells. Results are representative of seven independent experiments. (C–H) Response of pSTAT3 in p.Arg281* transfected GP130-deficient HEK293 after stimulations with IL-6, IL-11, IL-27, OSM, LIF, and IFN-α stimulation (all 100 ng/ml for 15 min). For assessment of IL-6 and IL-11 signaling, cells were cotransfected with plasmids encoding IL-6Rα and IL-11Rα, respectively. Successfully transfected cells were gated based on GFP expression. Representative histograms are shown on the left (gray, unstimulated; blue and red, stimulated). Quantification is based on six independent experiments per cytokine, with one to two replicates per experiment. (A–H) EV, empty vector; WT GP130, wild type. Statistical differences were determined by means of Mann–Whitney U test, ****, P ≤ 0.0001; *, P ≤ 0.05. (I) Immunostaining of the growth plate and primary spongiosa with absent GP130 expression and normal osterix at the border of the hypertrophic zone of A-II-1 compared with an age-matched control fetus. Scale bar indicates 50 µm. (J) GP130 expression in amniocytes from patient A-II-1 or A-II-2 compared with healthy controls by flow cytometry. Geometric mean fluorescence intensity (gMFI) values are shown from representative histograms (left), and dot plots summarize data from three experiments (right). US, unstained. (K–M) Response of pSTAT3 in A-II-1 or A-II-2 amniocytes after stimulations with OSM, LIF, or IL-11 (all 100 ng/ml for 15 min) compared with healthy controls (gray, unstimulated; blue and red, stimulated). Representative histograms (left) are shown with percentage increase of pSTAT3 in cytokine-stimulated cells determined by comparison with unstimulated cells (right). Dot plots summarize data from five experiments per cytokine (right), with one to two replicates per experiment. (N) Gene expression (2−ΔCt) of SOCS3 from amniocytes in the presence or absence of OSM (100 ng/ml) for 24 h, relative to endogenous control gene RPLPO. Data represent measurements from two experiments. (O) GP130 surface expression after lentiviral transduction with WT GP130. Representative histograms of control 1 and A-II-2 are shown on the left (gray, untransduced; blue and red, transduced). Response of pSTAT3 after OSM stimulation (100 ng/ml for 15 min) in control and patient amniocytes that were infected with or without GP130-expressing lentivirus (gray, unstimulated; blue and red, OSM). Three experiments were performed on cells from healthy controls and patients. LV, lentivirus.
Figure S2.
Figure S2.
The complete loss of GP130-dependent IL-6, IL-11, IL-27, OSM, and LIF signaling in p.Arg281* and c.1699+4A>G variant is not due to delayed kinetics; and a schematic summary of GP130 deficiency, the relationship between loss of cytokine signaling and clinical symptoms. (A–F) Response of pSTAT3 in c.1699+4A>G transfected GP130-deficient HEK293 after stimulations with IL-6, IL-11, IL-27, OSM, LIF, and IFN-α stimulation (all 100 ng/ml) over a time course covering 15 min, 1 h, 3 h, and 6 h. For assessment of IL-6 and IL-11 signaling, cells were cotransfected with plasmids encoding IL-6Rα and IL-11Rα, respectively. Successfully transfected cells were gated based on GFP expression. Quantification is based on individual independent experiments per cytokine, with duplicates per experiment. (G) A schematic summary of GP130 deficiency and the relationship between loss of cytokine signaling and clinical symptoms. The symptoms described in red were noticed in our patients.
Figure 3.
Figure 3.
The c.1699+4A>G intronic variant of IL6ST results in exon skipping and a complete loss of IL-6 signaling in EBV-LCLs. (A and B) Gene expression (2−ΔCt) of IL6ST exons 4–5 and exons 12–13 from EBV-LCLs of healthy controls and c.1699+4A>G patient, relative to endogenous control gene RPLPO. Data represent six technical repeats from two experiments. (C) Agarose gel with the amplicon from cDNA of patient C-II-3 c.1699+4A>G variant shows a smaller PCR product. Lane 1–3, control EBV-LCLs; lane 4, c.1699+4A>G variant; lane 5, negative control containing no cDNA; lane 6–7, 1-kb and 100-bp ladder, respectively. (D) A schematic figure of the exon-domain organization of the human IL6ST gene and the loss of exon 13 (red) in the c.1699+4A>G variant, as confirmed by Sanger sequencing. Purple, blue, red, green, and brown correspond to the sequence of exon 11, 12, 13, 14, and 15, respectively. The primer pair sequences used for the PCR products are underlined. E, exon; D, domain; UTR, untranslated region; SP, the hydrophobic signal peptide sequence; TM, transmembrane domain; ICD, intracellular cytoplasmic domain. (E) GP130 surface expression in patient-derived EBV-LCLs. Results are representative of two experiments. Gray, US, unstained; blue, healthy EBV-LCLs, control 1–3; red, c.1699+4A>G variant. (F and G) Response of pSTAT3 in c.1699+4A>G EBV-LCLs after stimulations with IL-6 and IL-21 (50 ng/ml for 15 min) compared with healthy controls. Representative histograms are shown on the left (gray, unstimulated; blue and red, stimulation) and quantification is based on two experiments per cytokine, with duplicates per experiment.
Figure 4.
Figure 4.
c.1699+4A>G intronic variant of IL6ST completely abrogates GP130-dependent IL-6, IL-11, IL-27, OSM, and LIF signaling and the structural remodeling. (A) GP130 surface expression in c.1699+4A>G transfected GP130-deficient HEK293 cells 24 h after transfection. Results are representative of four independent experiments. (B–G) Response of pSTAT3 in c.1699+4A>G transfected GP130-deficient HEK293 after stimulations with IL-6, IL-11, IL-27, OSM, LIF, and IFN-α stimulation (all 100 ng/ml for 15 min). For assessment of IL-6 and IL-11 signaling, cells were cotransfected with plasmids encoding IL-6Rα and IL-11Rα, respectively. Successfully transfected cells were gated based on GFP expression. Representative histograms are shown on the left (gray, unstimulated; blue and red, stimulated). Quantification is based on four independent experiments per cytokine, with one to two replicates per experiment. EV, empty vector; WT GP130, wildtype. Statistical differences were determined by means of Mann–Whitney U test, **, P ≤ 0.01, *, P ≤ 0.05. (H) In silico model of the hexameric structure of the extracellular region of GP130 (green ribbon) in complex with IL-6 (purple ribbon) and IL6Rα (blue ribbon). GP130 contains six ectodomains: an N-terminal Ig-like domain (D1), two cytokine binding domains (D2–D3), and three membrane-proximal fibronectin type III domains (D4–D6). Comparison of the D5/D6 interface (light and dark green ribbon) in WT and c.1699+4A>G variant predicts a major structural consequence to the inflexible junction of D5/D6 interface and the overall integrity of D6 in the absence of exon 13. In the deletion mutant, the entire contact region between D5 and D6 is significantly reduced, resulting in a weaker interdomain interface and perhaps preventing the formation of multimeric complexes of GP130. Key interdomain polar contacts identified in the crystal structures made by Asp523 and Asn526 to Ser439 and Gln494 in the WT protein are not present. Hydrophobic interactions between Phe528 and backbone of residues Asn526, Gly527, Phe528, and Tyr491 are also absent. Residues in D5 and D6 are highlighted as green and yellow carbon spheres, respectively. D6 is no longer a well-ordered domain, resulting in a “significantly impaired feet” of the tall GP130 receptor that perhaps does not bring the two cytoplasmic domains into position in close proximity to allow transphosphorylation of receptor-associated JAKs. In addition, “leg-leg” dimer contacts could be further reduced, resulting in more conformational flexibility, less rigidity of the hexamer structure upon IL-6 binding, and reduced interaction between the two legs. D, domain.

References

    1. Akira S. 2000. Roles of STAT3 defined by tissue-specific gene targeting. Oncogene. 19:2607–2611. 10.1038/sj.onc.1203478 - DOI - PubMed
    1. Babon J.J., Varghese L.N., and Nicola N.A.. 2014. Inhibition of IL-6 family cytokines by SOCS3. Semin. Immunol. 26:13–19. 10.1016/j.smim.2013.12.004 - DOI - PMC - PubMed
    1. Boulanger M.J., Bankovich A.J., Kortemme T., Baker D., and Garcia K.C.. 2003. Convergent mechanisms for recognition of divergent cytokines by the shared signaling receptor gp130. Mol. Cell. 12:577–589. 10.1016/S1097-2765(03)00365-4 - DOI - PubMed
    1. Caminsky N., Mucaki E.J., and Rogan P.K.. 2014. Interpretation of mRNA splicing mutations in genetic disease: review of the literature and guidelines for information-theoretical analysis. F1000 Res. 3:282 10.12688/f1000research.5654.1 - DOI - PMC - PubMed
    1. Dagoneau N., Scheffer D., Huber C., Al-Gazali L.I., Di Rocco M., Godard A., Martinovic J., Raas-Rothschild A., Sigaudy S., Unger S., et al. . 2004. Null leukemia inhibitory factor receptor (LIFR) mutations in Stuve-Wiedemann/Schwartz-Jampel type 2 syndrome. Am. J. Hum. Genet. 74:298–305. 10.1086/381715 - DOI - PMC - PubMed

Publication types

MeSH terms

Supplementary concepts