

Temperature and pH affect copper release kinetics from copper metal foil and commercial copperware to food simulants
- PMID: 31914361
- PMCID: PMC9119339
- DOI: 10.1080/19440049.2019.1704447
Temperature and pH affect copper release kinetics from copper metal foil and commercial copperware to food simulants
Abstract
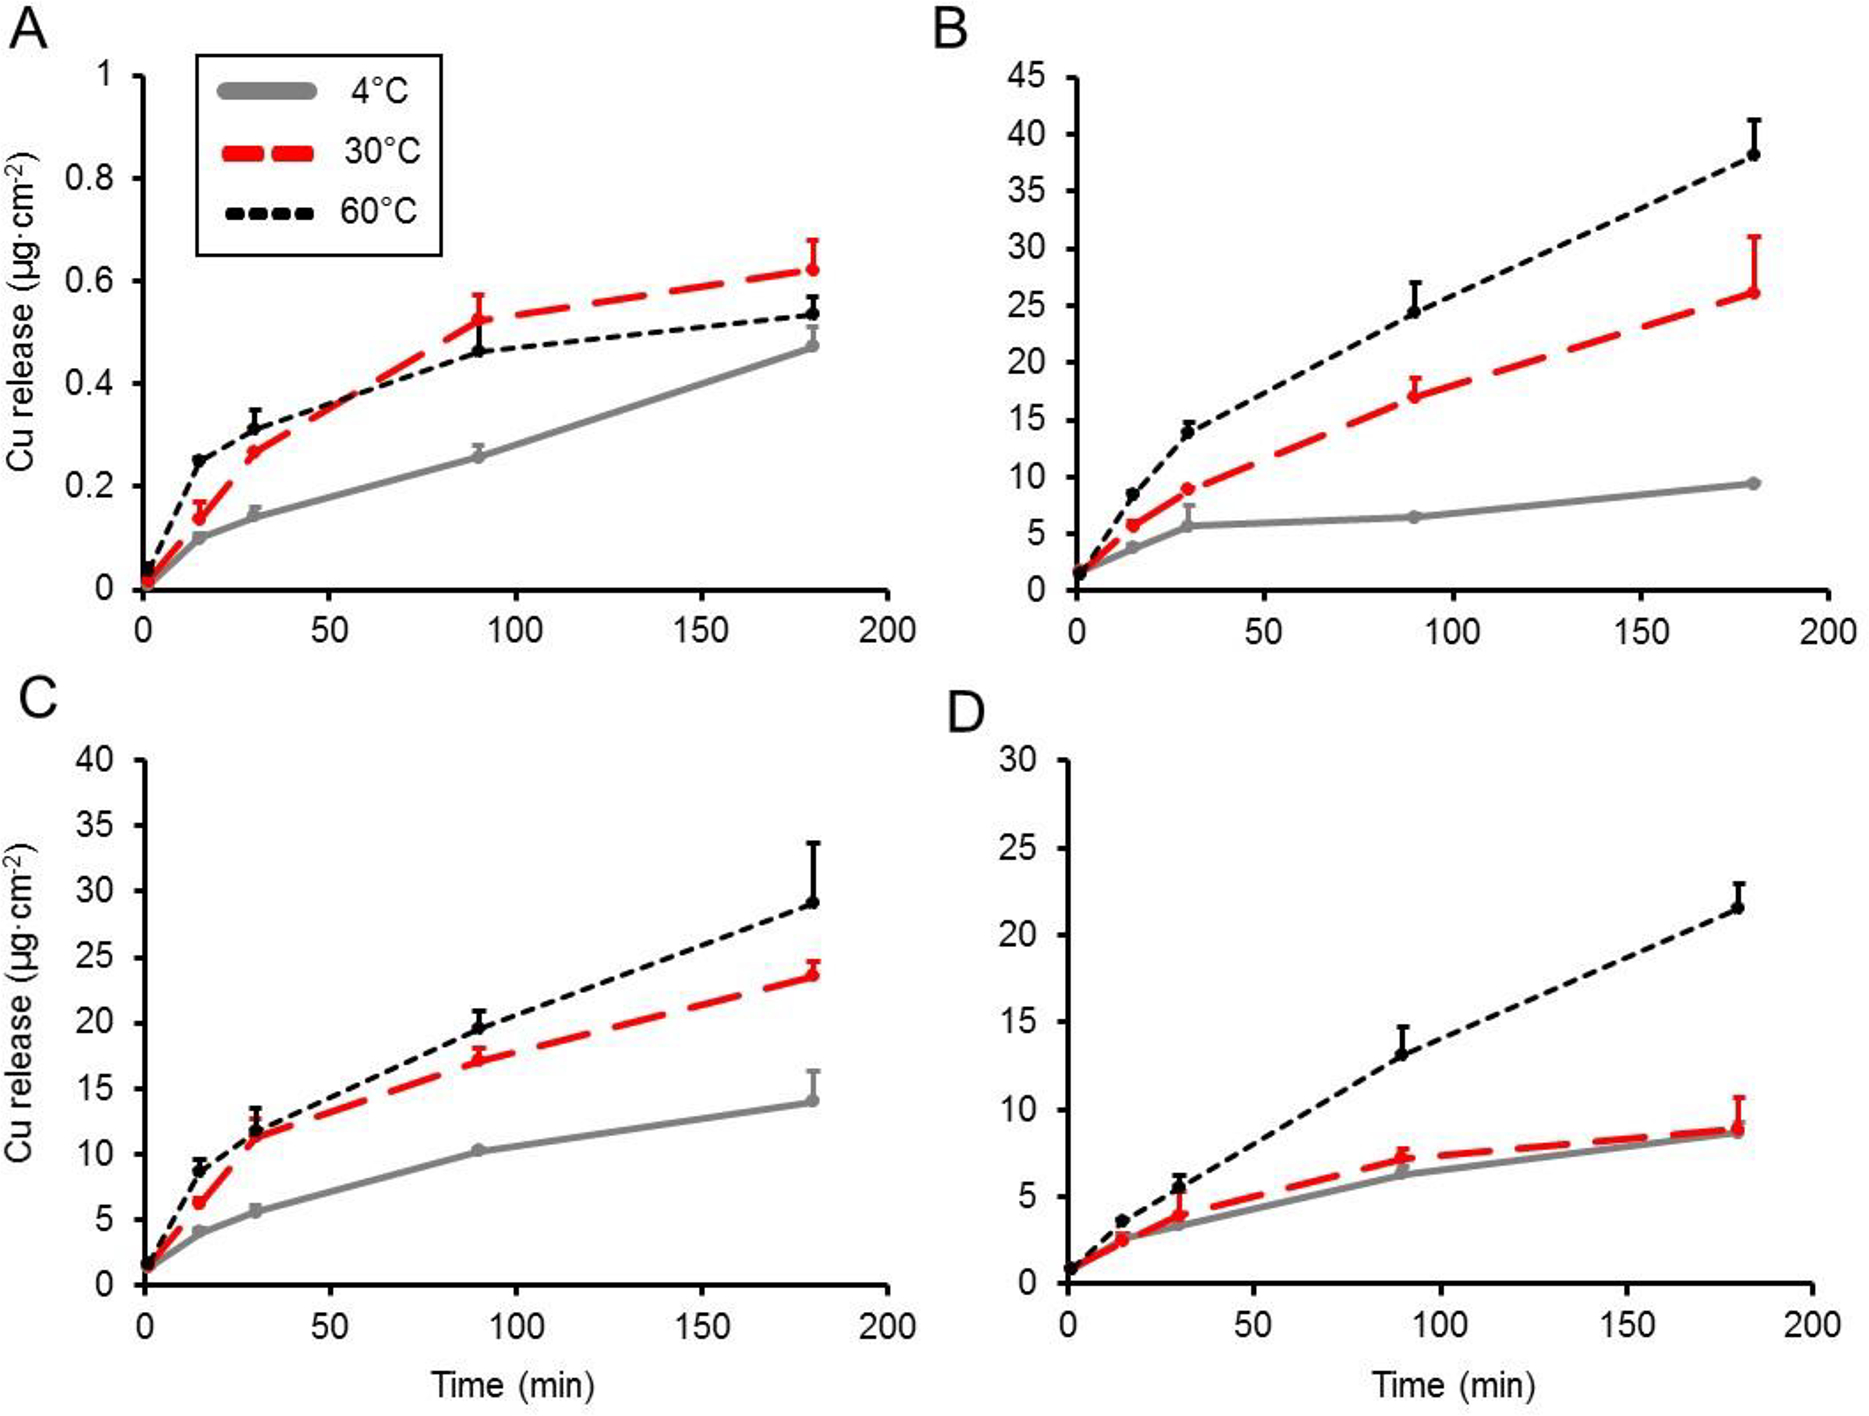
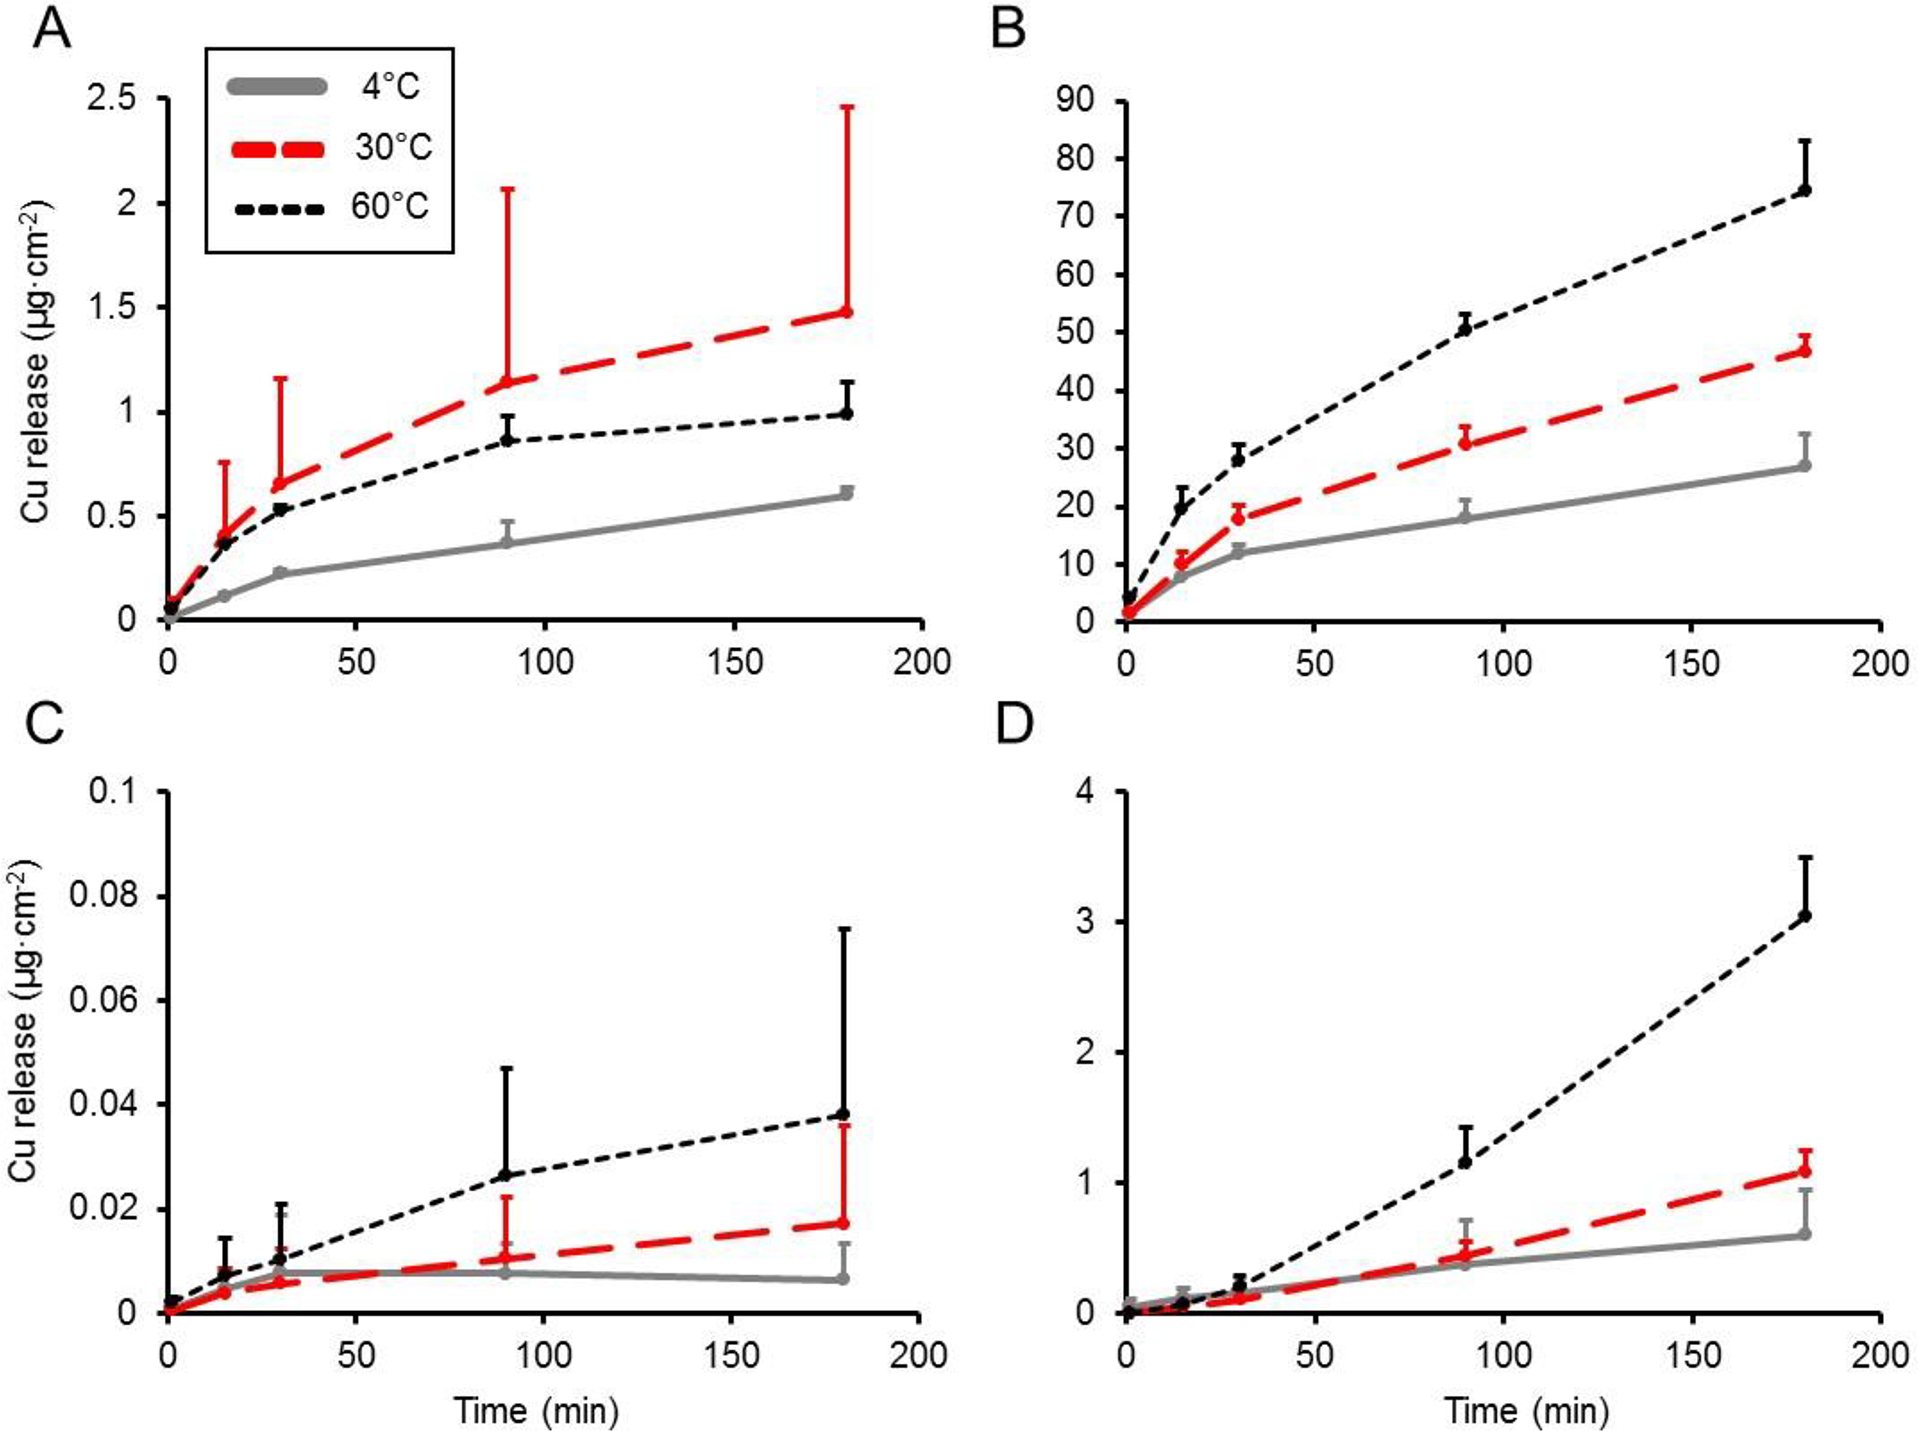
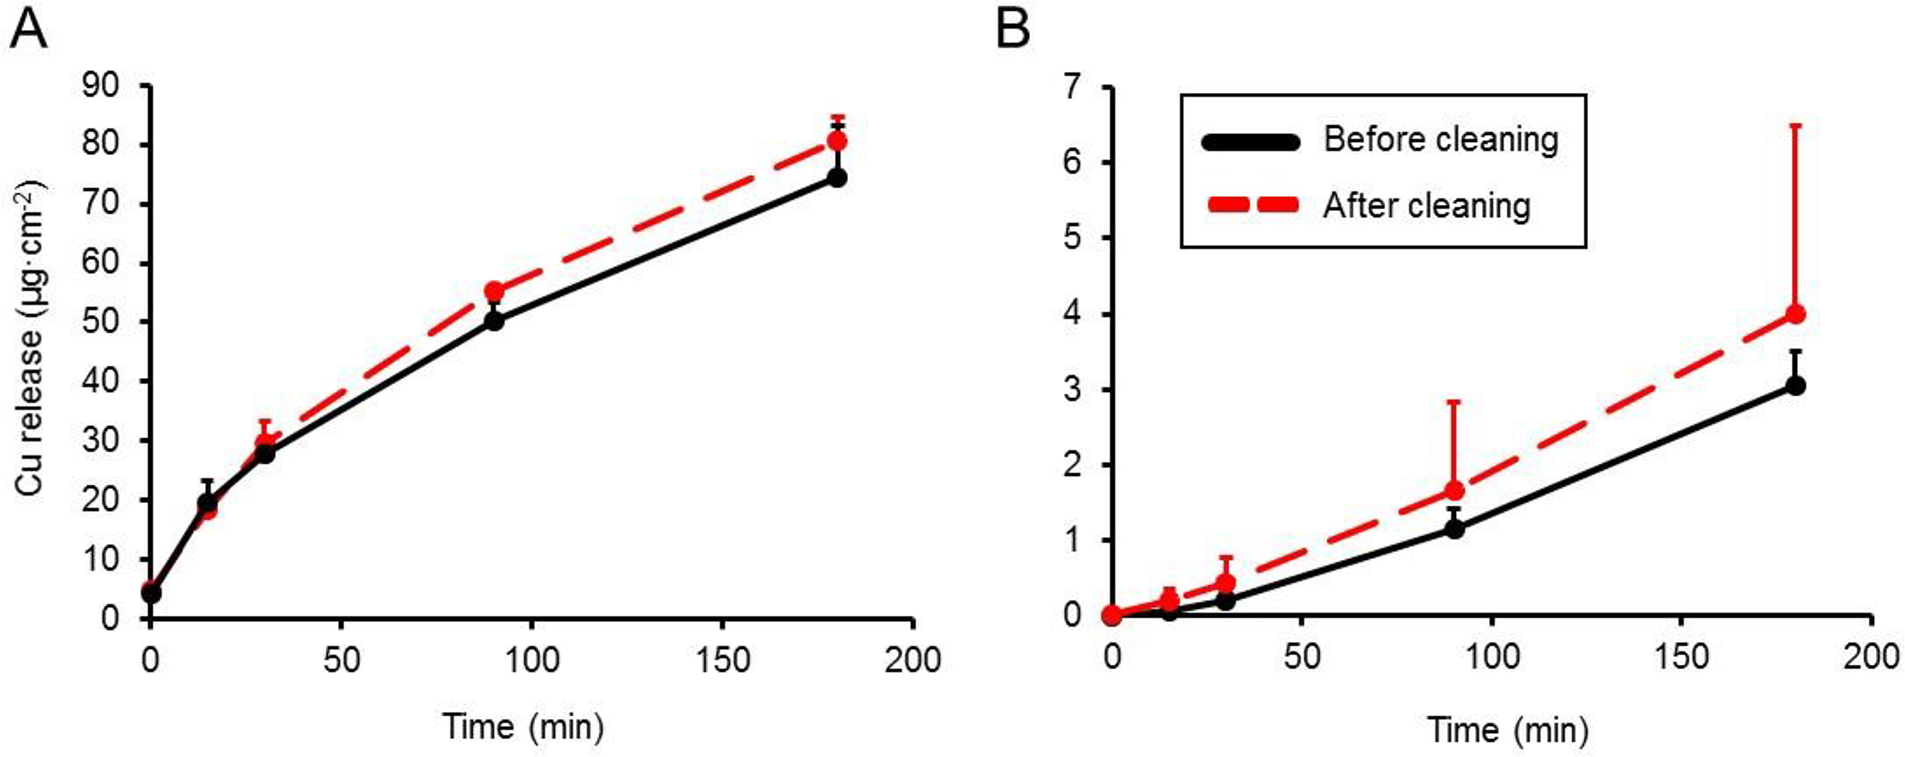
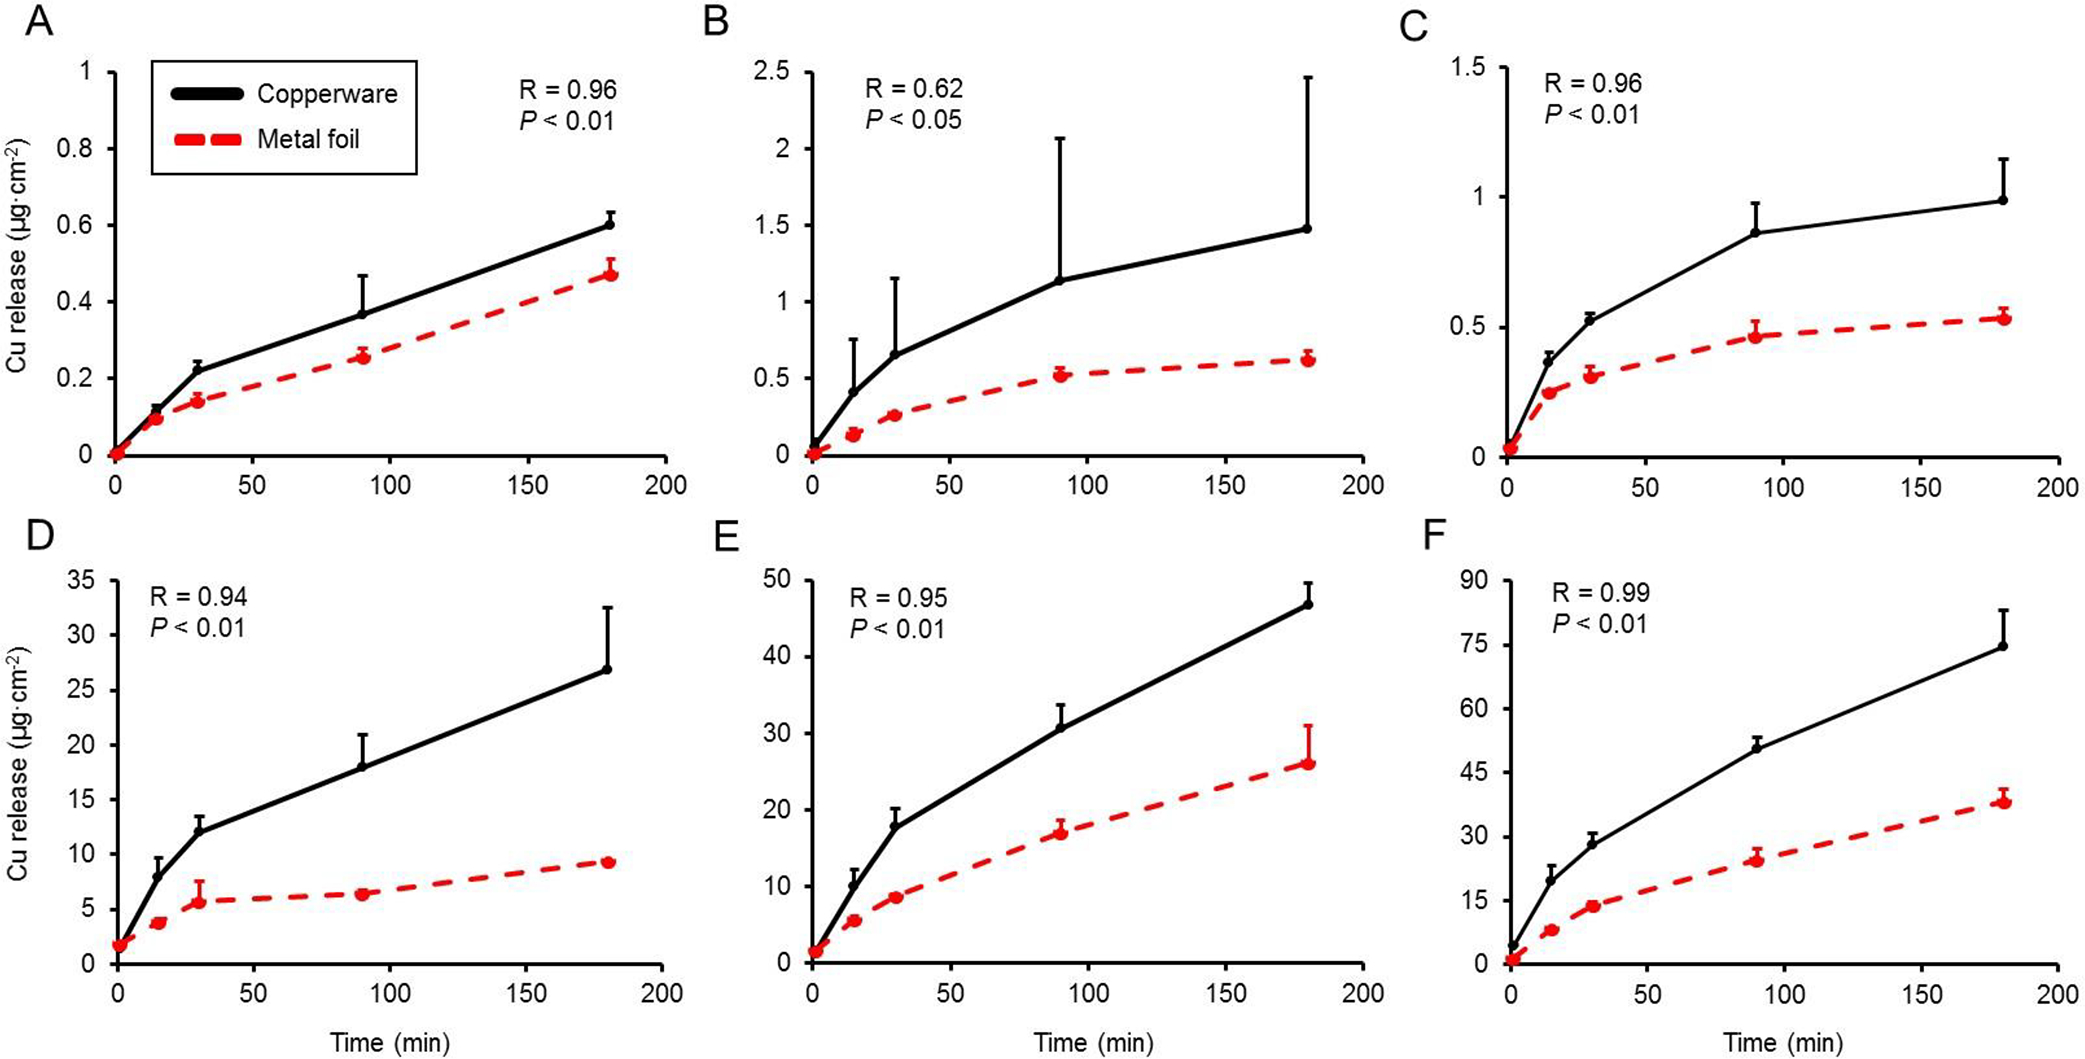
Copper (Cu) metal and alloys are used in cookware and other food contact surfaces due to their desirable properties for various applications. However, Cu metal can ionise and subsequently transfer to food and beverages under certain conditions. Here, we tested how pH and temperature affected Cu release kinetics using model systems utilising Cu metal foil and commercially available copperware. Cu foil and copperware were exposed to food simulants composed of 3% (w:w) aqueous solutions of citric acid, malic acid, acetic acid, or deionised (DI) water at temperatures ranging from 4°C to 60°C. An additional pilot experiment tested how simulated long-term cleaning affected subsequent Cu release from lined and unlined copperware to 3% citric acid. Food simulants were then analysed by ICP-MS for total Cu. After 180 min, incubation of Cu metal foil with acid-containing food simulants at 4°C resulted in Cu release ranging from 8.7 - 14.0 µg cm-2, while 21.5-38.1 µg cm-2 was released at 60°C. In contrast, Cu transfer from metal foil to DI water was relatively low, with <0.6 µg cm-2 released after 180 min at 60°C. With citric acid food simulant, lined copperware released between 0.6 and 3.0 µg Cu cm-2 over 180 min at the set temperatures, while unlined copperware released approximately 25-45 fold higher amounts of Cu (26.9-74.6 µg cm-2) over this same time period. In contrast, use of DI water food simulant resulted in Cu release of <0.1 µg cm-2 for the lined copperware and <2 µg cm-2 for the unlined type. No significant effect of simulated long-term cleaning on Cu release from copperware was observed. These data indicate that Cu release is affected by temperature and pH, and that specific steps can be taken to limit Cu metal release from food contact surfaces to foods and beverages.
Keywords: Copper; ICP-MS; acrylic coatings; copperware; food simulants; organic acids.
Figures
References
-
- Addo Ntim S, Goodwin DG, Sung L, Thomas TA, Noonan GO. 2019. Long-term wear effects on nanosilver release from commercially available food contact materials. Food Addit Contam Part A. 36(11):1757–1768. - PubMed
-
- Addo Ntim S, Norris S, Goodwin DG Jr, Breffke J, Scott K, Sung L, Thomas TA, Noonan GO. 2018. Effects of consumer use practices on nanosilver release from commercially available food contact materials. Food Addit Contam Part A. 35(11):2279–2290. - PubMed
-
- Araya M, Chen B, Klevay LM, Strain J, Johnson L, Robson P, Shi W, Nielsen F, Zhu H, Olivares M. 2003. Confirmation of an acute no-observed-adverse-effect and low-observed-adverse-effect level for copper in bottled drinking water in a multi-site international study. Regul Toxicol Pharmacol. 38(3):389–399. - PubMed
-
- Armstrong R, Wright J, Handyside T. 1992. Impedance studies into the corrosion protective performance of a commercial epoxy acrylic coating formed upon tin plated steel. J Appl Electrochem. 22(9):795–800.
-
- Barceloux DG, Barceloux D. 1999. Copper. J Toxicol Clin Toxicol. 37(2):217–230. - PubMed
MeSH terms
Substances
Grants and funding
LinkOut - more resources
Full Text Sources
Medical