. 2020 Jan 7;30(1):112-123.e4.
doi: 10.1016/j.celrep.2019.12.014.

The CD38/NAD/SIRTUIN1/EZH2 Axis Mitigates Cytotoxic CD8 T Cell Function and Identifies Patients with SLE Prone to Infections

Affiliations

The CD38/NAD/SIRTUIN1/EZH2 Axis Mitigates Cytotoxic CD8 T Cell Function and Identifies Patients with SLE Prone to Infections

Eri Katsuyama et al. Cell Rep. .

Abstract

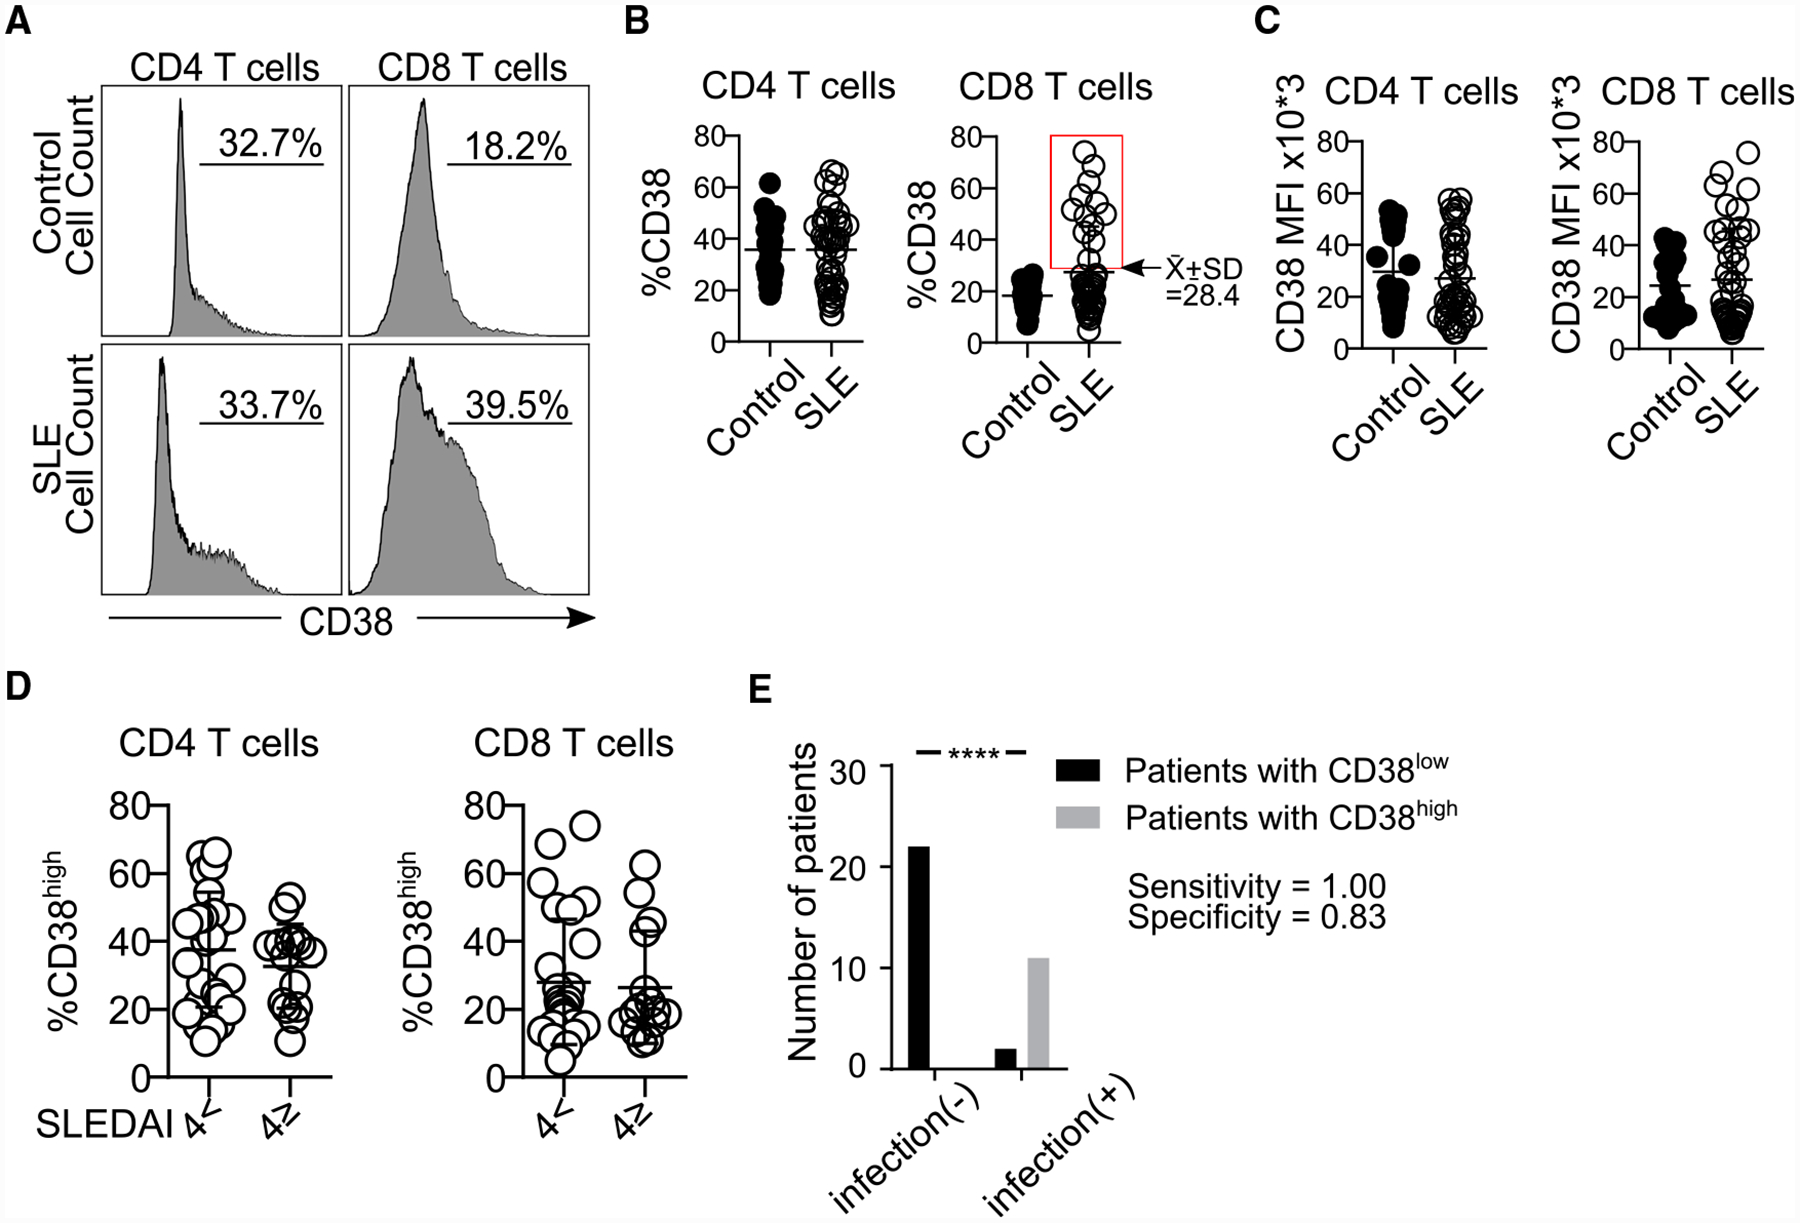
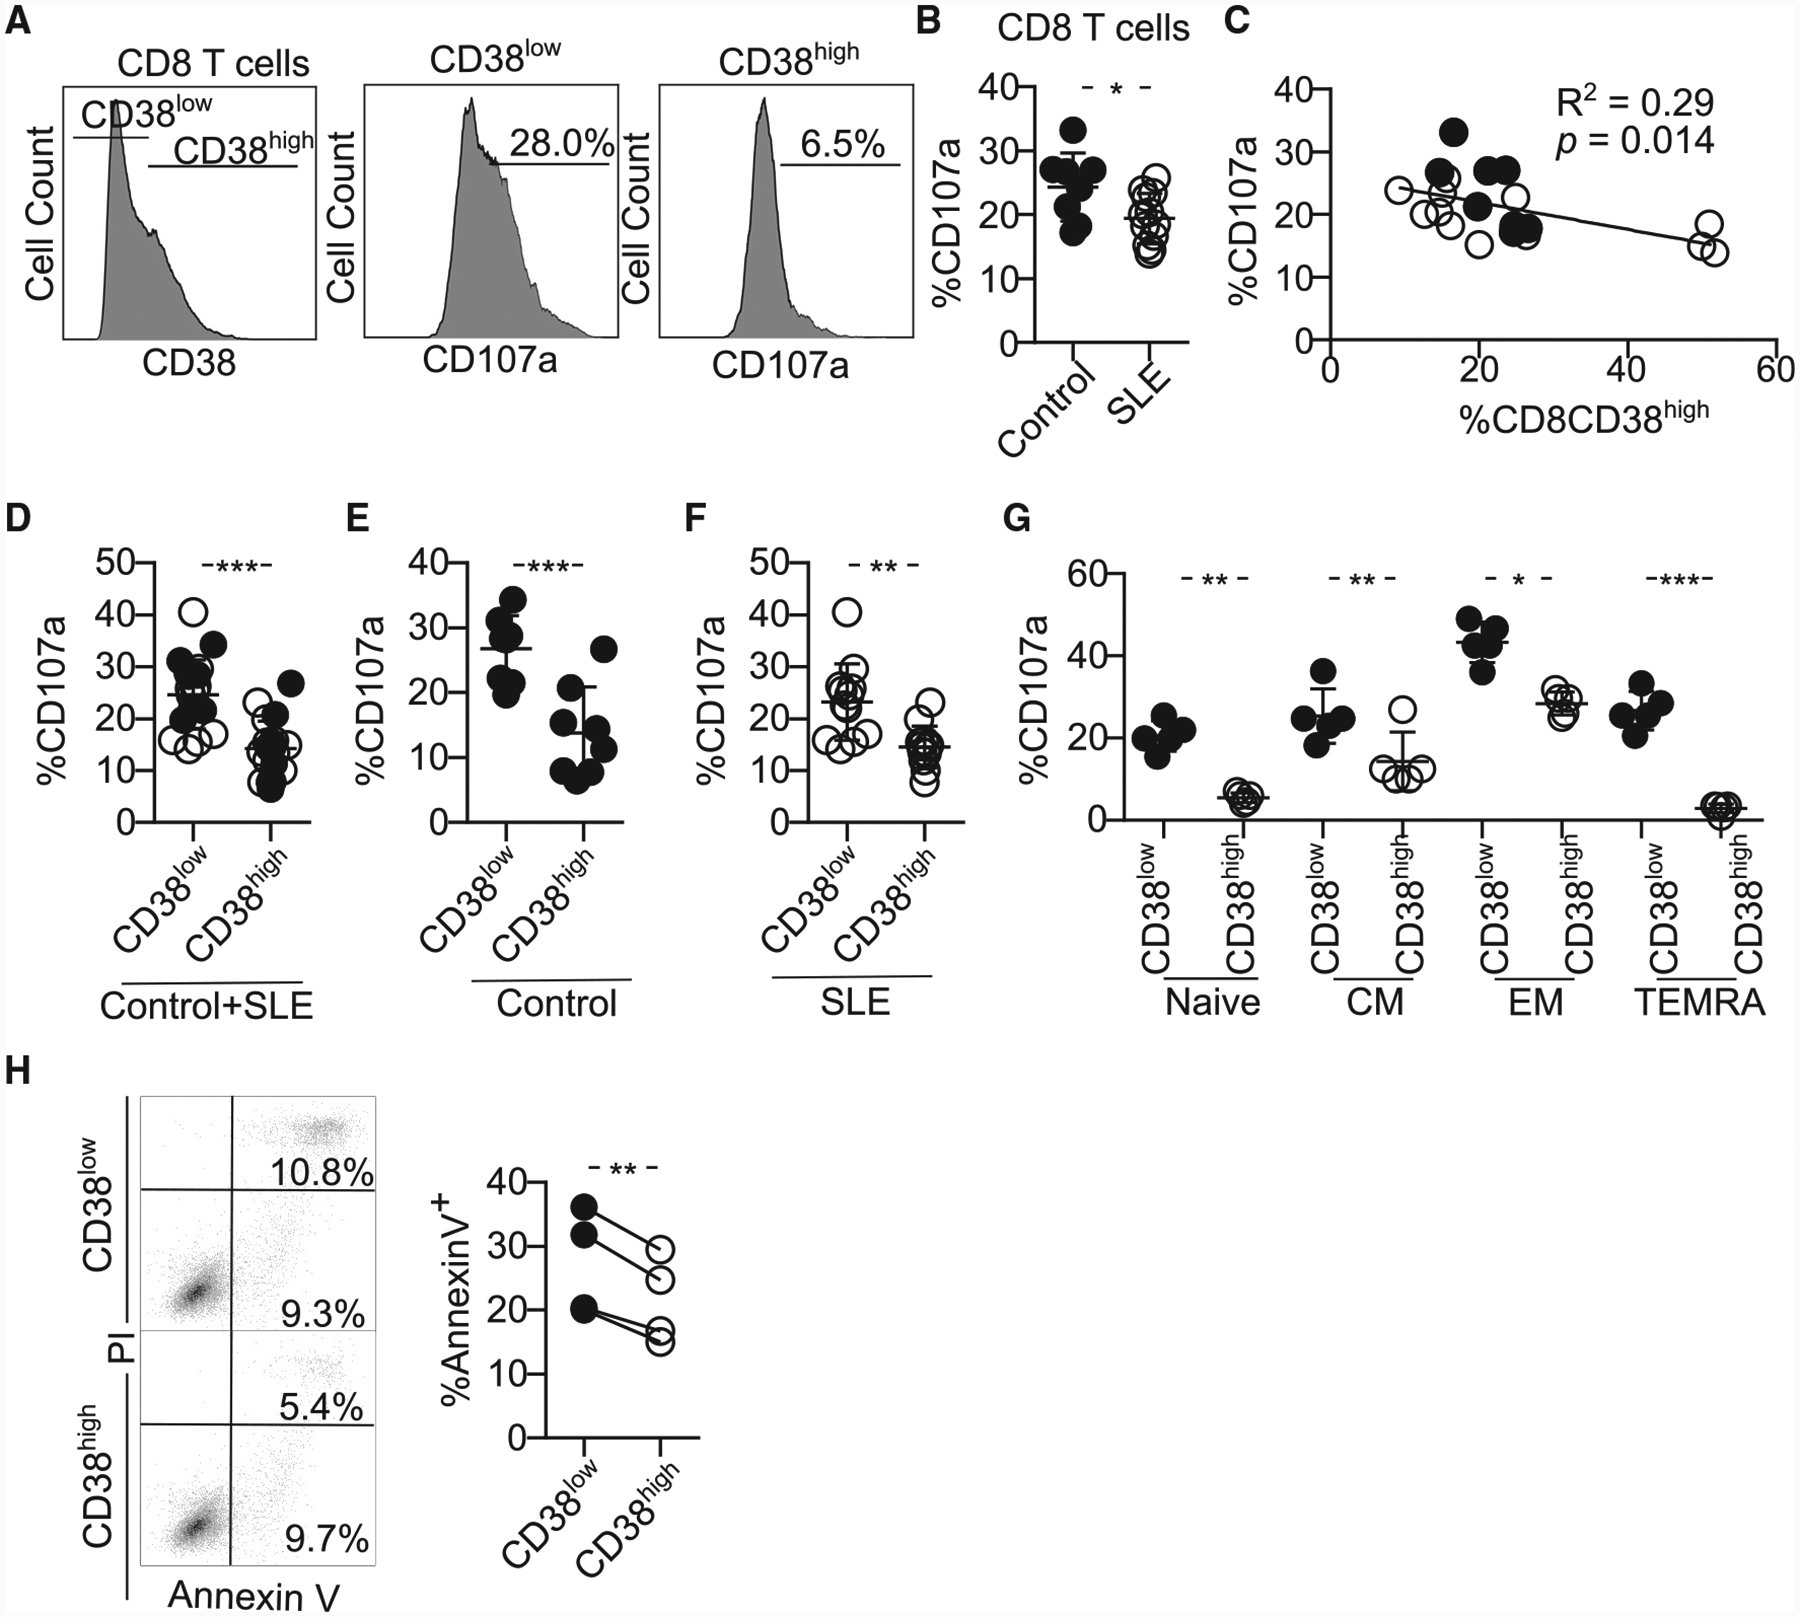
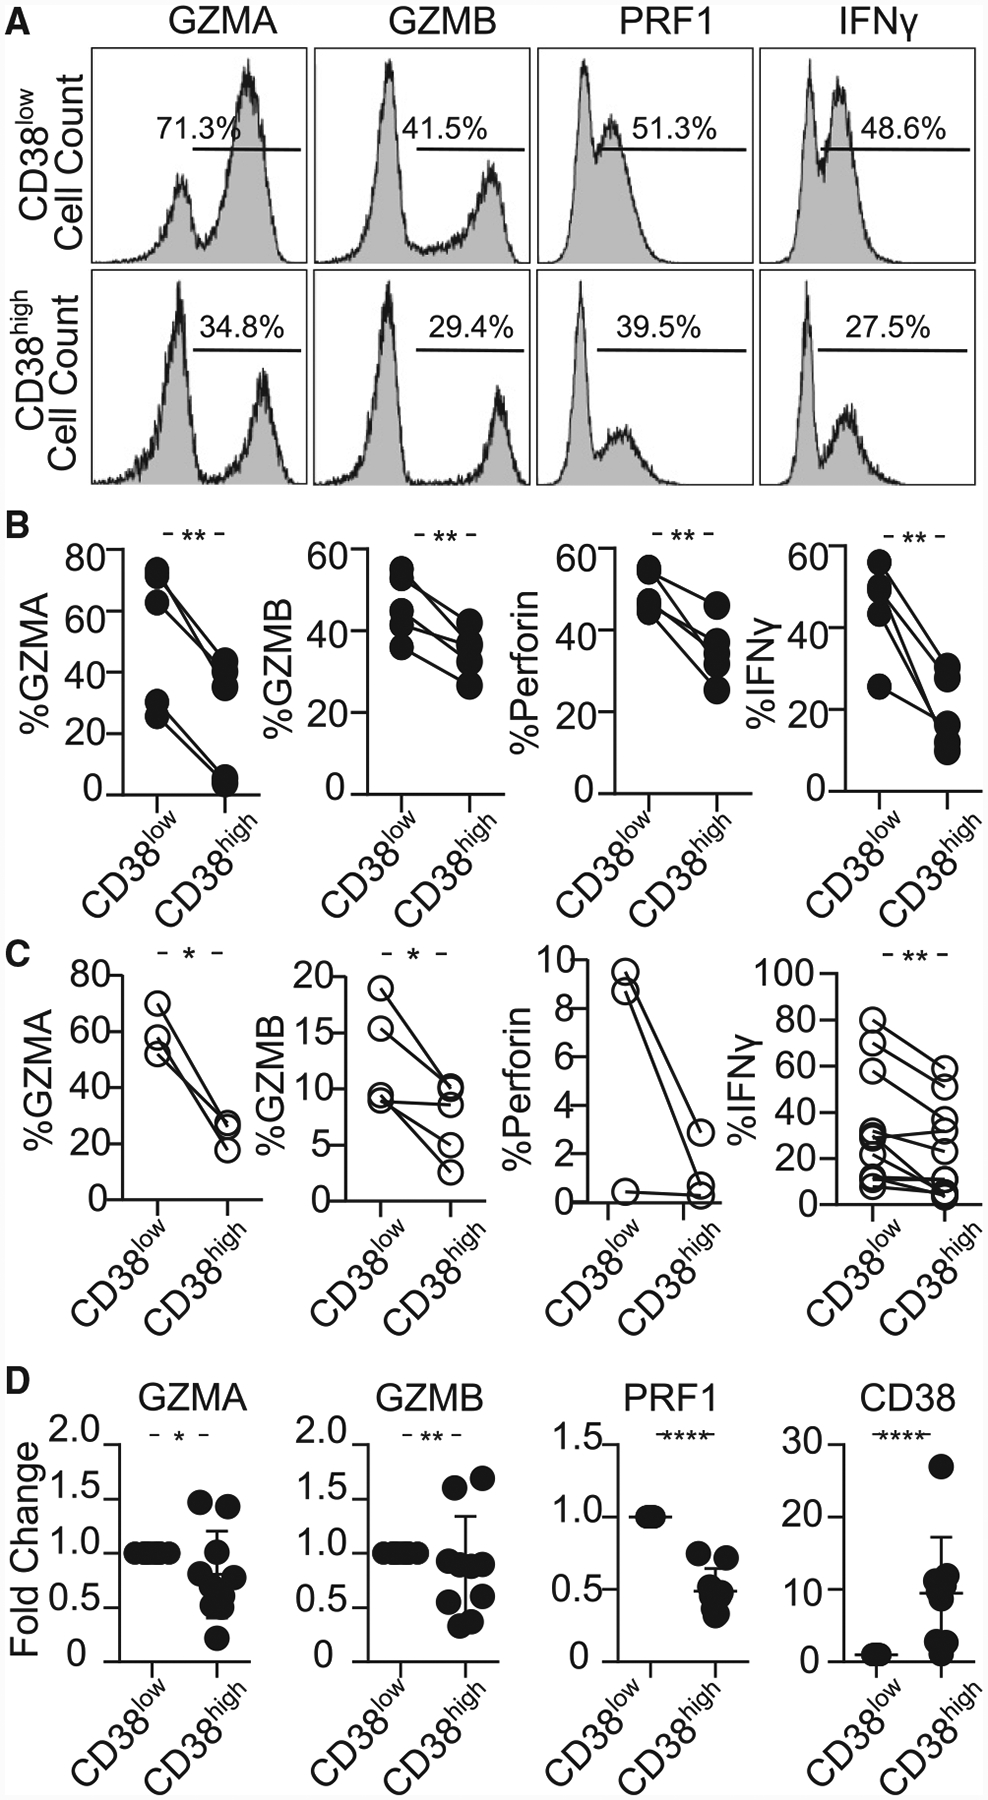
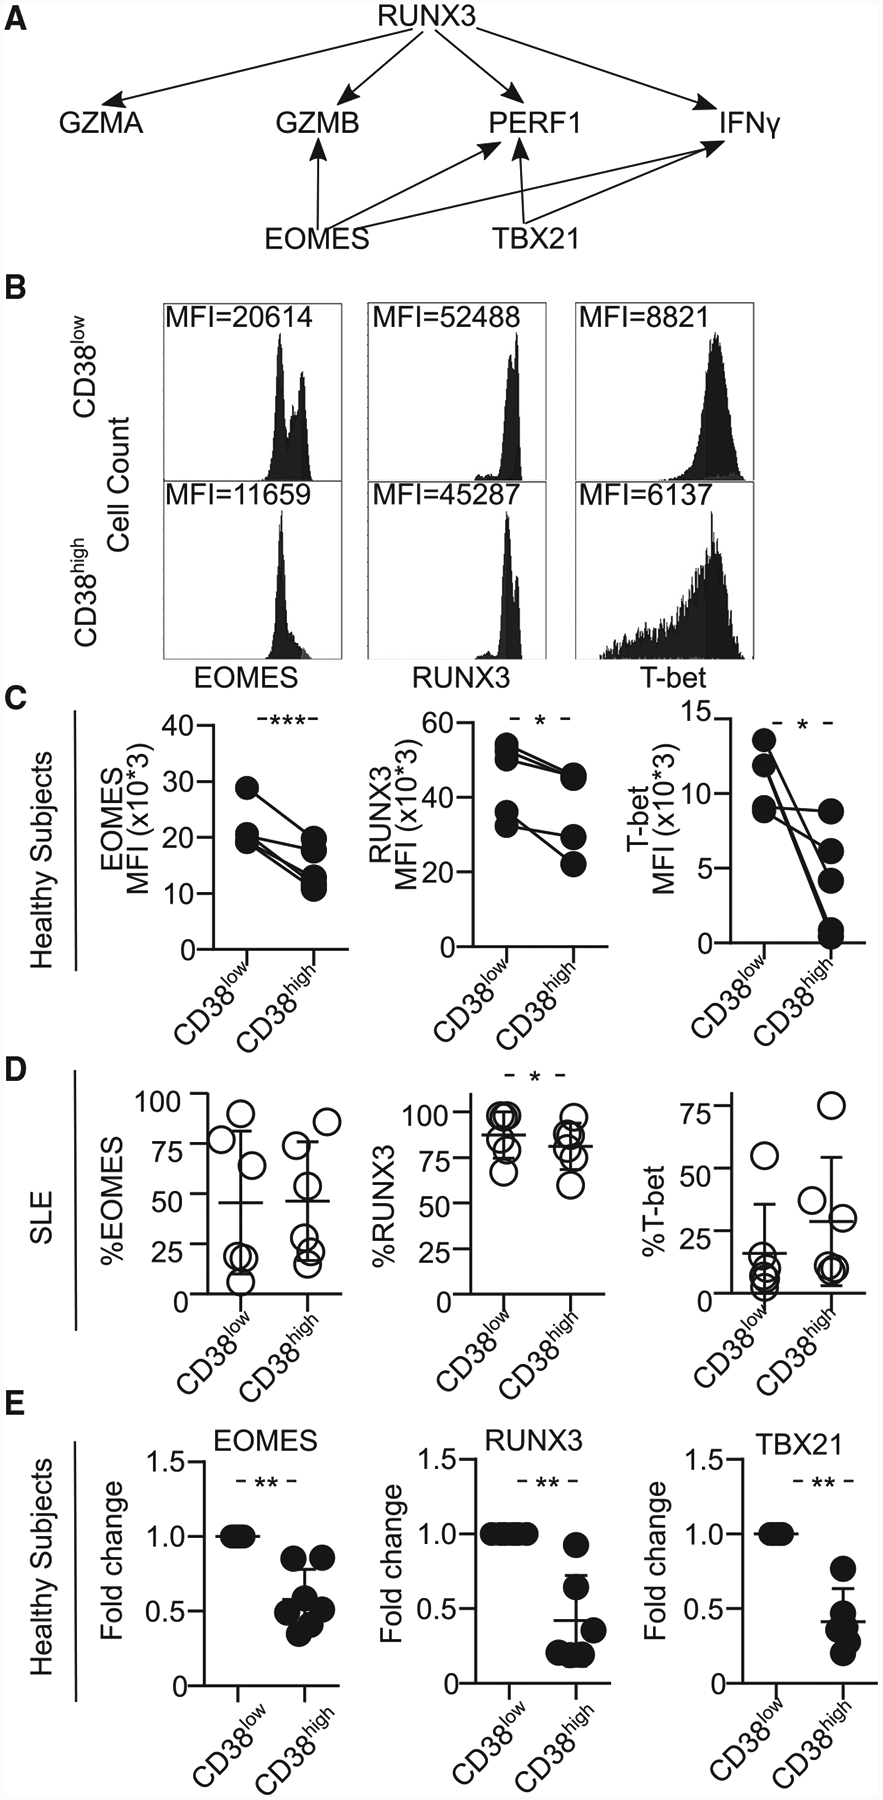
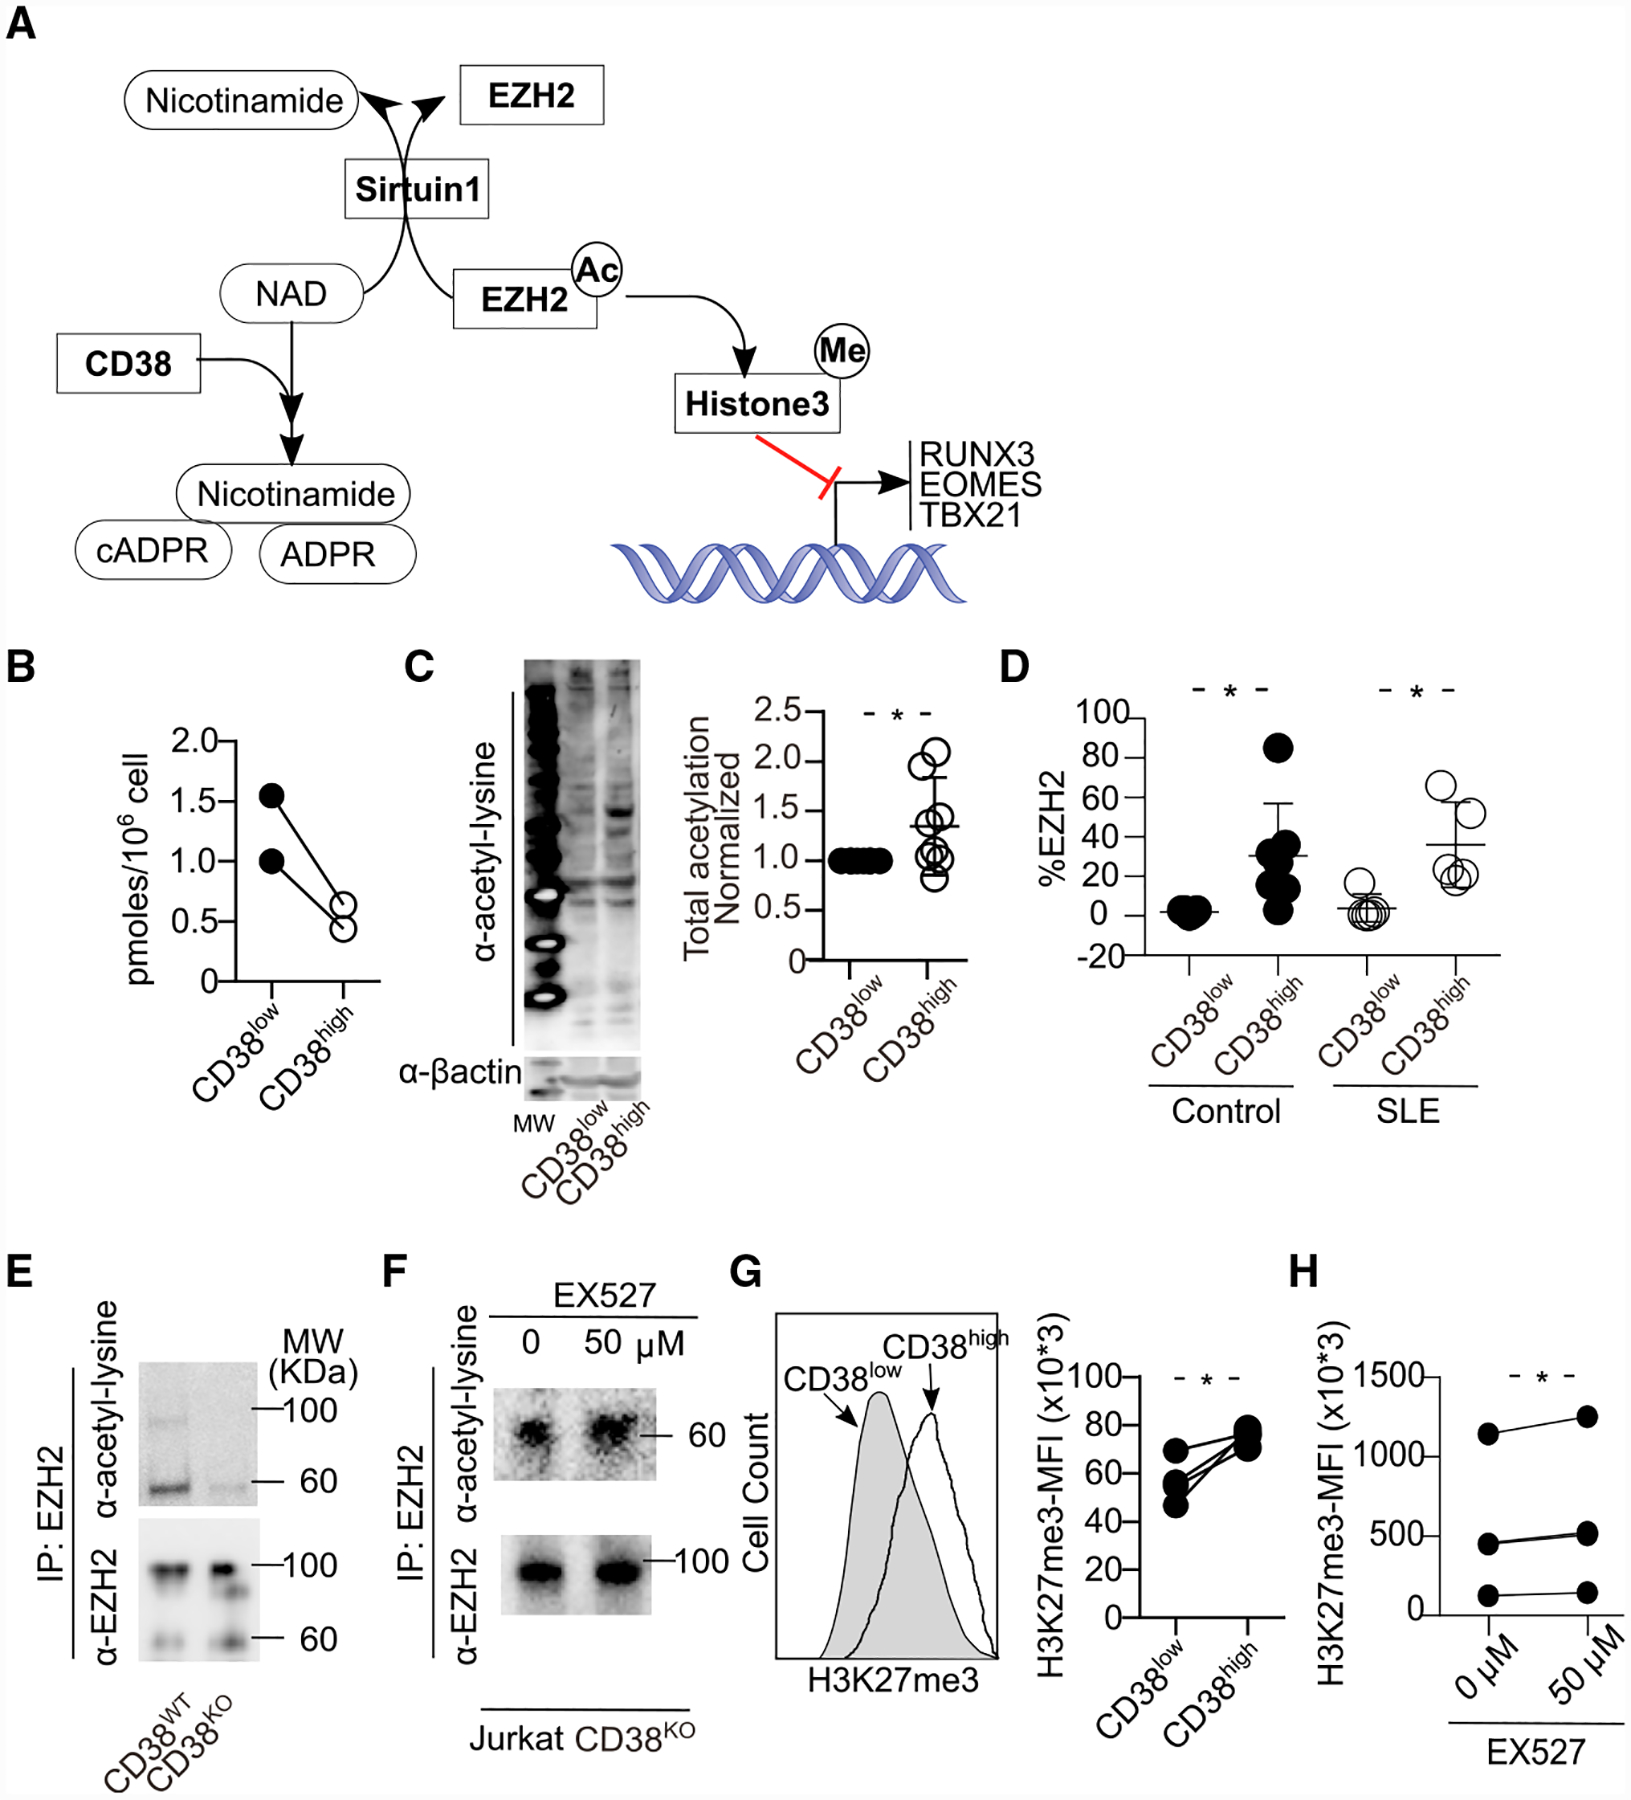
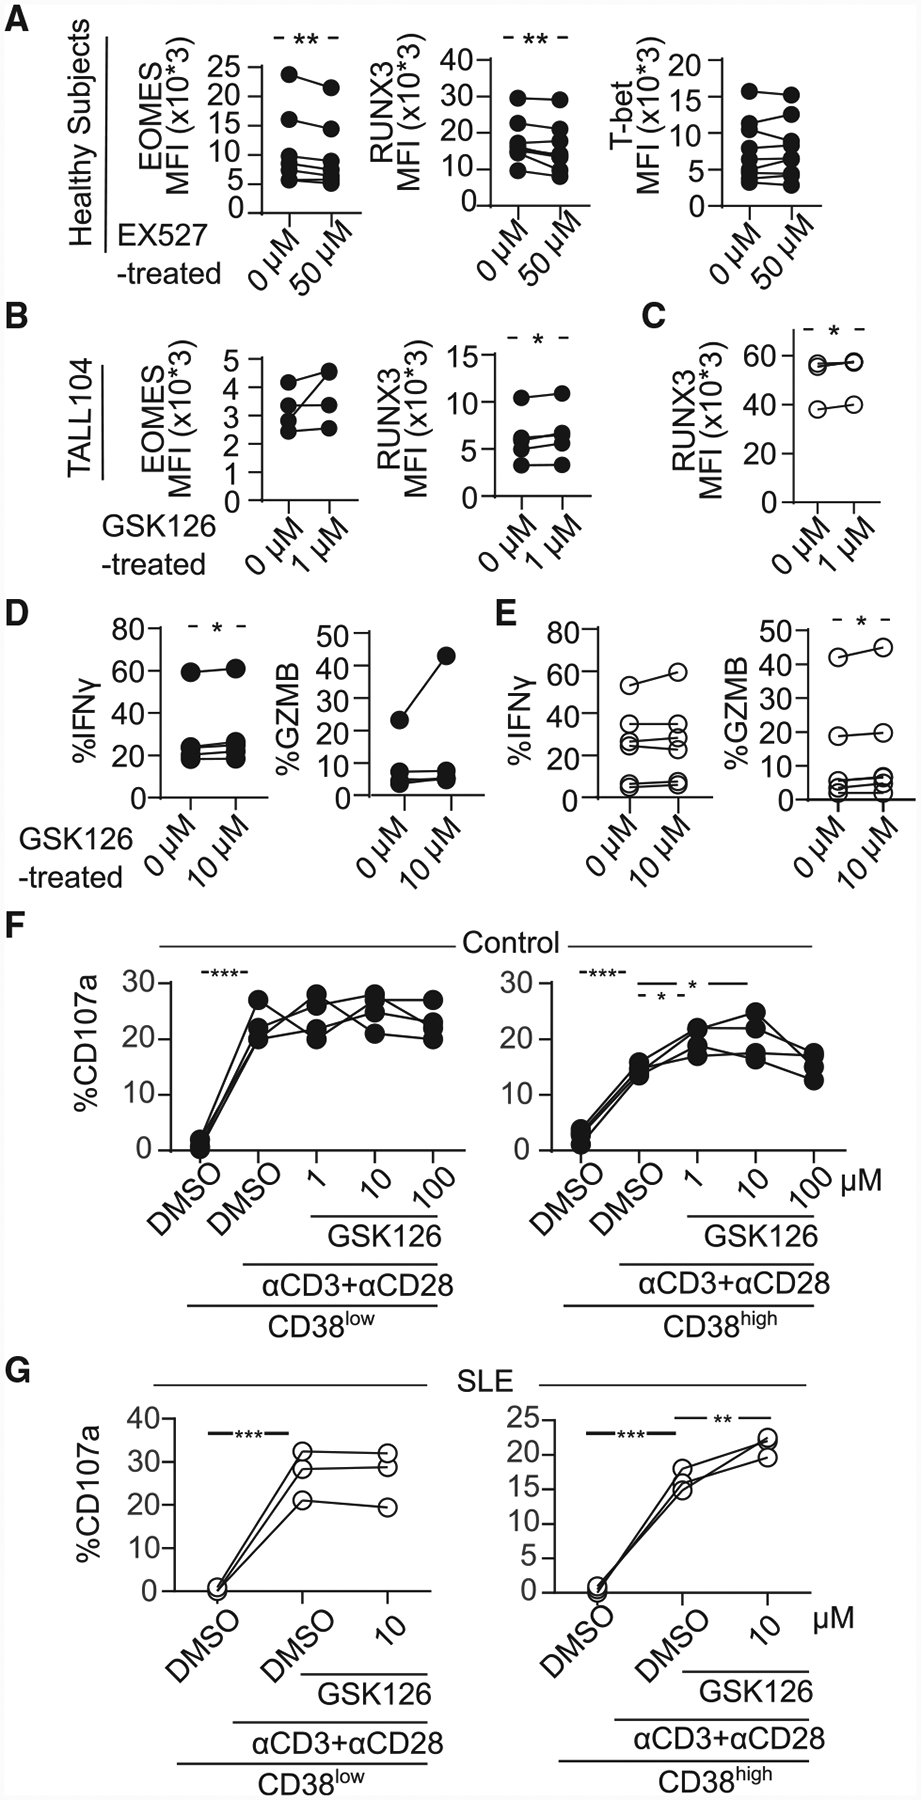
Patients with systemic lupus erythematosus (SLE) suffer frequent infections that account for significant morbidity and mortality. T cell cytotoxic responses are decreased in patients with SLE, yet the responsible molecular events are largely unknown. We find an expanded CD8CD38high T cell subset in a subgroup of patients with increased rates of infections. CD8CD38high T cells from healthy subjects and patients with SLE display decreased cytotoxic capacity, degranulation, and expression of granzymes A and B and perforin. The key cytotoxicity-related transcription factors T-bet, RUNX3, and EOMES are decreased in CD8CD38high T cells. CD38 leads to increased acetylated EZH2 through inhibition of the deacetylase Sirtuin1. Acetylated EZH2 represses RUNX3 expression, whereas inhibition of EZH2 restores CD8 T cell cytotoxic responses. We propose that high levels of CD38 lead to decreased CD8 T cell-mediated cytotoxicity and increased propensity to infections in patients with SLE, a process that can be reversed pharmacologically.

Keywords: CD38; CD8 T cell; EZH2; Sirtuin1; cytotoxicity; infection; nicotinamide adenine dinucleotide; patients; systemic lupus erythematosus.


Conflict of interest statement

DECLARATION OF INTERESTS

G.C.T. is on the Scientific Advisory Board (SAB) of A2 Therapeutics, ABPRO, and CUGENE and has received research grants from Janssen and Pfizer.

Figures

Figure 1.
Figure 1.. Patients with SLE Prone to Infections Display an Increased Percentage of CD8CD38high
(A) Representative histograms showing CD38 expression in CD4 and CD8 T cells from both a healthy subject and a patient with SLE. (B) Percentage of CD38 in CD4 and CD8 T cells by flow cytometry. The rectangle identifies the cutoff point separating patients with SLE in 2 subpopulations: those with high or normal percentages of CD8CD38high (healthy subjects = 24, SLE = 42; Welch’s test). (C) MFI of CD38 in CD4 and CD8CD38high T cells (healthy subjects = 24, SLE = 35: Kolmogorov-Smirnov) from healthy subjects and patients with SLE by flow cytometry. (D) Percentage of CD4CD38high and CD8CD38high T cells from patients with SLE sorted based on disease activity: inactive (SLEDAI < 4, n = 26) or active (SLEDAI ≥4, n = 15) by flow cytometry (Kolmogorov-Smirnov test). (E) Sensitivity and specificity of the percentage of CD8CD38high T cells in defining patients with any infection (SLE = 35, chi-square test). In all figures, average data are represented as mean ± SD.
Figure 2.
Figure 2.. CD8CD38high T Cells Display Poor Cytotoxic Capacity
(A) Representative histograms showing the expression of CD107a on CD8CD38low and CD8CD38high T cells from healthy subjects by flow cytometry. To measure CD107a expression, cells were stimulated with plate-coated CD3 and CD28 antibodies with Golgiplug and anti-CD107a for 5 h and stained with proper surface markers. (B) Degranulation (%CD107a) of CD8 T cells from healthy subjects and patients with SLE evaluated by flow cytometry (healthy subjects = 8, SLE = 12; Welch’s test). (C) Correlation between percentage of CD38high and degranulation in CD8 T cells (healthy subjects = 8, SLE = 12; closed circles, healthy subjects; opened circles, SLE; Pearson’s correlation). (D–F) Degranulation (%CD107a) of CD8 T cells sorted on CD38low and CD38high of both healthy subjects and patients with SLE in both groups (D) and separately in healthy subjects (E) and SLE (F) by flow cytometry (healthy subjects = 8, SLE = 12; closed circles, control; opened circles, SLE; healthy subjects = 8, SLE = 12; Welch’s test). (G) Degranulation (%CD107a) of the different subpopulations of CD8 T cells sorted on CD38low and CD38high by flow cytometry (n = 5 healthy donors; one-way ANOVA with multiple comparison). (H) Representative dot blots (left) and cumulative data (right) showing percentage of of Annexin V+ P815 cells after coincubation with CD8CD38low or CD8CD38high T cells from healthy subjects analyzed by flow cytometry (normal T cells = 4; Kolmogorov-Smirnov test). In all figures, average data are represented as mean ± SD.
Figure 3.
Figure 3.. CD8CD38high T Cells Express Low Levels of Cytotoxic Molecules
(A) Representative histograms showing granzyme A (GZMA), granzyme B (GZMB), perforin (PRF1), and interferon gamma (IFN-γ) in CD8CD38low and CD38high T cells from a healthy subjects by flow cytometry. (B) Percentage of GZMA, GZMB, perforin and IFN-γ in CD8CD38low and CD8CD38high T cells evaluated by flow cytometry (healthy subjects ≥3; paired t test). (C) Percentage of GZMA, GZMB, perforin, and IFN-γ in CD8CD38low and CD8CD38high T cells evaluated by flow cytometry (SLE ≥3; paired t test). (D) mRNA levels of GZMA, GZMB, PRF1, and CD38 from CD8CD38low and CD8CD38high T cells by quantitative PCR (normal T cells = 10; Kolmogorov-Smirnov test). Cells were sorted by fluorescence-activated cell sorting (FACS) aria. In all figures, average data are represented as mean ± SD.
Figure 4.
Figure 4.. CD8CD38high T Cells Express Decreased Levels of EOMES, RUNX3, and T-bet
(A) Scheme showing the transcription factors regulating various cytotoxic molecules. (B) Representative histograms showing EOMES, RUNX3, and T-bet in CD8CD38low and CD38high T cells from a healthy donor by flow cytometry. (C) MFI from EOMES, RUNX3, and T-bet in CD8CD38low and CD8CD38high T cells from by flow cytometry (healthy subjects ≥3; paired t test). (D) Percentage of EOMES, RUNX3, and T-bet in CD8CD38low and CD8CD38high T cells by flow cytometry (SLE = 6; paired t test). (E) mRNA levels of EOMES, RUNX3, and T-bet (TBX21) in CD8CD38low and CD8CD38high T cells by flow cytometry (normal T cells = 10; Kolmogorov-Smirnov test). Cells were sorted by FACS aria. In all figures, average data are represented as mean ± SD.
Figure 5.
Figure 5.. CD38 Modulates the Epigenetic Profile of CD8 T Cells by Controlling the Sirtuin1/EZH2 Axis
(A) Schema showing the regulation of transcriptional factors by CD38 through the NAD/Sirtuin1 (SIRT1)/EZH2 axis. ADPR, adenosine ribose; cADPR, cyclic adenosine ribose. (B) NAD+ levels from the same number of CD8CD38low and CD8CD38high T cells, sorted by FACS aria. NAD+ levels were quantified by colorimetric measurements (normal T cells = 2). (C) Representative western blot (left) and cumulative data (right) showing lysine acetylation in total protein from CD8CD38low and CD8CD38high T cells sorted by FACS aria (normal T cells = 8; Kolmogorov-Smirnov test). (D) Percentage of EZH2 in CD8CD38low and CD8CD38high T cells from healthy subjects and patients with SLE by flow cytometry (healthy subjects = 7, SLE = 5, paired t test in each group). (E and F) Cell lysates from Jurkat CD38WT and CD38KO were subjected to immunoprecipitation with an EZH2 antibody followed by western blot analysis with a lysine acetylation or EZH2 antibodies (E). Same experiment as in (E) using cell lysates from Jurkat CD38KO cells, after overnight treatment with 50 μM of EX527 (SIRT1 inhibitor) (F). (G and H) Representative histogram and cumulative data showing H3K27me3 in CD8CD38low and CD8CD38high T cells by flow cytometry (healthy subjects = 4; paired t test) (G). Same experiment using Jurkat CD38KO cells treated with 50 μM of EX527 overnight (n = 4 in 3 independent experiments, paired t test) (H). In all figures, average data are represented as mean ± SD.
Figure 6.
Figure 6.. Inhibition of Sirtuin1/EZH2 Axis Restores CD8 Cytotoxicity
(A) MFI from EOMES, RUNX3, and T-bet in CD8 T cells pretreated with 50 μM of EX527 (SIRT1 inhibitor) overnight by flow cytometry (healthy subjects = 7; paired t test). (B) MFI from EOMES and RUNX3 in TALL104 CD8 T cells pretreated with 1 μM of GSK126 (EZH2 inhibitor) overnight by flow cytometry (n = 4, 3 independent experiments; paired t test). (C) MFI from RUNX3 in CD8 T cells in patients with SLE pretreated with 1 μM of GSK126 overnight by flow cytometry (SLE = 4; paired t test). (D and E) Percentage of IFN-γ and GZMB in CD8CD38low or CD8CD38high T cells from healthy controls (D) and from patients with SLE (E) treated with 1 μM of GSK126 overnight by flow cytometry (healthy subjects = 5, shown in closed circle, SLE = 6, shown in opened circle; paired t test). (F and G) Degranulation (%CD107a) of CD8CD38low or CD8CD38high T cells from healthy subjects (F) and from patients with SLE (G) treated with GSK126 overnight and stimulated with plate-coated CD3/CD28 antibodies for 5 h with GSK126 at the indicated concentration (n = 4, one-way ANOVA with multiple comparisons).

Comment in

References

    1. Aarhus R, Graeff RM, Dickey DM, Walseth TF, and Lee HC (1995). ADP-ribosyl cyclase and CD38 catalyze the synthesis of a calcium-mobilizing metabolite from NADP. J. Biol. Chem 270, 30327–30333. - PubMed
    1. Aksoy P, White TA, Thompson M, and Chini EN (2006). Regulation of intracellular levels of NAD: a novel role for CD38. Biochem. Biophys. Res. Commun 345, 1386–1392. - PubMed
    1. Alcocer-Varela J, Alarcón-Riquelme M, Laffón A, Sánchez-Madrid F, and Alarcón-Segovia D (1991). Activation markers on peripheral blood T cells from patients with active or inactive systemic lupus erythematosus. Correlation with proliferative responses and production of IL-2. J. Autoimmun 4, 935–945. - PubMed
    1. Andrews S (2010). FastQC: a quality control tool for high throughput sequence data. Available online. http://www.bioinformatics.babraham.ac.uk/projects/fastqc.
    1. Arbuckle JH, Gardina PJ, Gordon DN, Hickman HD, Yewdell JW, Pierson TC, Myers TG, and Kristie TM (2017). Inhibitors of the Histone Methyltransferases EZH2/1 Induce a Potent Antiviral State and Suppress Infection by Diverse Viral Pathogens. MBio 8, Published online August 15, 2017. 10.1128/mBio.01141-17. - DOI - PMC - PubMed

Publication types