. 2020 Jan 7;30(1):137-152.e5.
doi: 10.1016/j.celrep.2019.12.016.

CD4+ T Follicular Helper Cells in Human Tonsils and Blood Are Clonally Convergent but Divergent from Non-Tfh CD4+ Cells

Affiliations

CD4+ T Follicular Helper Cells in Human Tonsils and Blood Are Clonally Convergent but Divergent from Non-Tfh CD4+ Cells

Elena Brenna et al. Cell Rep. .

Abstract

T follicular helper (Tfh) cells are fundamental for B cell selection and antibody maturation in germinal centers. Circulating Tfh (cTfh) cells constitute a minor proportion of the CD4+ T cells in peripheral blood, but their clonotypic relationship to Tfh populations resident in lymph nodes and the extent to which they differ from non-Tfh CD4+ cells have been unclear. Using donor-matched blood and tonsil samples, we investigate T cell receptor (TCR) sharing between tonsillar Tfh cells and peripheral Tfh and non-Tfh cell populations. TCR transcript sequencing reveals considerable clonal overlap between peripheral and tonsillar Tfh cell subsets as well as a clear distinction between Tfh and non-Tfh cells. Furthermore, influenza-specific cTfh cell clones derived from blood can be found in the repertoire of tonsillar Tfh cells. Therefore, human blood samples can be used to gain insight into the specificity of Tfh responses occurring in lymphoid tissues, provided that cTfh subsets are studied.

Keywords: T follicular helper cells; TCR repertoire; blood; influenza; tonsil.


Conflict of interest statement

DECLARATION OF INTERESTS

The authors declare no competing interests.

Figures
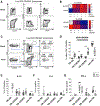
Figure 1.
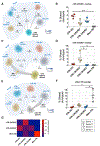
Figure 1.. Identification of Tonsillar and Circulating Tfh Populations in Donor-Matched Samples
Matched PBMC and MNC-T from adult donors were stained ex vivo. (A) Dot plot illustrating the expression of CXCR5, PD-1, CXCR3, and ICOS within the total CD4+CD45RA cells in a representative matched blood and tonsil sample pair. (B) Heatmaps showing the mean percentage of CXCR3+ and ICOS+ cells within populations expressing different combinations of CXCR5 and PD-1 in 12 donors. The white crossed boxes indicate the near-absence of the PD-1hiCXCR5hi population in peripheral blood. (C) Dot plot illustrating the gating strategy used to define populations of circulating CXCR5+PD-1+Tfh (cTfh CXCR3+, cTfh CXCR3) and CXCR5 non-Tfh memory cells (cNon-Tfh) and tonsillar CXCR5hiPD-1hi GC Tfh (tTfh GC), CXCR5intPD-1int (tTfh CXCR3+, tTfh CXCR3) Tfh and CXCR5PD-1 non-Tfh memory cells (tNon-Tfh) within the total CD4+CD45RA T cell pool in one representative donor. (D) The percentage of each Tfh/non-Tfh subset within the CD4+CD45RA memory T cell population in blood and tonsils from the 12 donors. (E–G) Production of IL-21 (E), IL-4 (F), and IFN-γ (G) after PMA and ionomycin stimulation by Tfh and non-Tfh populations in 10 donors. Non-analogous subsets were compared within tonsil and peripheral blood using the Kruskal-Wallis test. *p < 0.05, **p < 0.01, ***p < 0.001, ****p < 0.0001. Boxes show means and quartiles, and whiskers show minima and maxima. See also Figure S1.
Figure 2.
Figure 2.. Clonotypic Overlap between Peripheral and Tonsillar Tfh Cell Populations
The top2000 TCR CDR3β nucleotide sequences in each population were analyzed using Cytoscape networking. (A, C, and E) As an example, illustrated is clonotype sharing between peripheral blood cTfh CXCR3 (A), cTfh CXCR3+ (C), and cNon-Tfh (E) and 4 tonsillar populations: tTfh CXCR3+ in yellow, tTfh CXCR3 in blue, tTfh GC in red, and tNon-Tfh in gray in one representative donor (donor 1). Each square represents a different clonotype; the size of the square is proportional to the clonotype’s normalized frequency within the parent population (for shared clonotypes, the highest normalized frequency is shown). The number of clonotypes shared between different populations is shown in bold, and the respective percentage is indicated below. (B, D, and F) To compare the overlap between blood cTfh CXCR3 (B), cTfh CXCR3+ (D), and cNon-Tfh (F) subsets and tonsillar populations, the percentage of the top2000 most frequent clonotypes shared between populations was calculated in each of the 4 donors (mean ± SEM). Non-parametric Kruskal-Wallis and Dunn’s multiple comparison tests: *p < 0.05, **p < 0.01, ***p < 0.001, ****p < 0.0001. (G) A heatmap depicting the average number of clonotypes shared.
Figure 3.
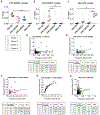
Figure 3.. Size Similarities in Clonotypes Shared between cTfh and tTfh
(A–C) Overlap between TCR CDR3β nucleotide sequences of the top2000 most frequent clonotypes of blood cTfh CXCR3 (A), cTfh CXCR3+ (B), and cNon-Tfh (C) populations with each tonsil population, as represented by the normalized F2 metric (mean ± SEM). Non-parametric Kruskal-Wallis and Dunn’s multiple comparison test: *p < 0.05, **p < 0.01, ***p < 0.001, ****p < 0.0001. (D–H) Linear regression analysis of the correlation between the within-population frequency of the shared clonotypes in the two parent populations where clonotype sharing between populations was observed: cTfh CXCR3 with tTfh GC (D), tTfh CXCR3 with cTfh CXCR3 (E), cTfh CXCR3 with tTfh CXCR3+ (F), cTfh CXCR3+ with tTfh CXCR3+ (G), and cNon-Tfh with tNon-Tfh (H). Each graph illustrates a representative donor, and the tables show the number of shared clonotypes, the square of the Pearson correlation coefficient (R2), the slope value for each donor, and the p value of the significance of the difference in the slope from zero (ns, not significant).
Figure 4.
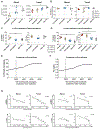
Figure 4.. Repertoire Diversity Correlates with the Degree of Clonotypic Overlap from the In Silico Resampling Analysis
(A and B) Chao1 index (A) and normalized Shannon-Wiener index (B) of the top2000 frequencies for each population of cells analyzed in blood and tonsils from the 4 donors (mean ± SEM). Clonotypes of each subset were resampled using the bootstrap method. (C and D) The percentage of the top2000 shared clonotypes and the normalized F2 metric (mean ± SEM) of the overlap between the two replicates of blood (C) cTfh CXCR3+, cTfh CXCR3, and cNon-Tfh as well as tonsil (D) tTfh GC, tTfh CXCR3+, tTfh CXCR3, and tNon-Tfh populations is shown for all 4 donors (mean ± SEM). Non-parametric Kruskal-Wallis and Dunn’s multiple comparison test: *p < 0.05, **p < 0.01, ***p < 0.001, ****p < 0.0001. (E and F) Unweighted (E) and weighted (F) analysis of the replicate overlap at increasing numbers of clonotypes considered from a representative population (cTfh CXCR3+ from donor 1). (G) The graphs show the linear regression correlation between the repertoire overlap, expressed either as percentage of shared clonotypes or normalized F2 metric, with both diversity indexes (Chao1 and normalized Shannon-Wiener) in all blood and tonsil populations from the 4 donors analyzed. See also Figure S2.
Figure 5.
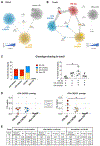
Figure 5.. Tfh Cell Subsets Are Clonotypically Distinct from Non-Tfh Cells
The top2000 TCR Vβ CDR3 nucleotide sequences of each population were analyzed by Cytoscape networking. (A and B) Examples of (A) clonotype sharing between peripheral blood cTfh CXCR3+ (yellow), cTfh CXCR3 (blue), and cNon-Tfh (gray) populations and (B) clonotype sharing between tonsillar populations tTfh CXCR3+ (yellow), tTfh CXCR3 (blue), tTfh GC (red), and tNon-Tfh (gray) populations in one representative donor (donor 1). Results are expressed as in Figure 2. (C) The percentage of the top2000 total shared clonotypes in addition to the uniquely shared clonotypes between tonsil populations was calculated in each of the 4 donors (mean ± SEM). (D) The normalized F2 metric of the top2000 frequencies was also calculated for the overlap between tTfh CXCR3+ and tTfh CXCR3 subsets and each of the other populations analyzed in the 4 donors (mean ± SEM). Non-parametric Kruskal-Wallis and Dunn’s multiple comparison test: *p < 0.05, **p < 0.01, ***p < 0.001, ****p < 0.0001. (E) The table shows the number of shared clonotypes, the square of R2 in their size within populations, the slope value, and the p value of the difference in the slope from zero. See also Figure S3.
Figure 6.
Figure 6.. Influenza Virus HA-Specific Clones Are Predominantly Found in cTfh CXCR3+ and cNon-Tfh Populations
(A) T cell libraries generated from Tfh and non-Tfh subsets sorted from three healthy blood donors from the National Health Service (NHS) Blood Transfusion Service were tested against the influenza H3/Wisconsin HA protein. The proliferation of each individual cell line (increase in counts above background, delta cpm) is shown (mean ± SEM). The red dotted line represents the cutoff used for identification of a positive response (defined as >3000 cpm, with a stimulation index >5). (B) Calculated precursor frequency of HA-specific cells per 106 cells in each subset (mean ± SEM). (C) Bar graph showing the number of influenza H1/California HA-specific T cell clones generated from each cell subset in the 4 further donors from whommatched tonsil samples were available. Non-parametric Kruskal-Wallis and Dunn’s multiple comparison test: *p < 0.05, **p < 0.01, ***p < 0.001, ****p < 0.0001. (D) Epitopes recognized by HA-specific cTfh CXCR3+, cTfh CXCR3, and cNon-Tfh clones were mapped, and the frequency of clones recognizing each peptide, normalized to the total frequency of HA-specific clones in all donors (D1, D2, D3, and D4), is plotted in the heatmap. The solid arrows highlight the peptides recognized by 3 subsets and the dashed arrows the peptides recognized by 3 donors. See also Figure S4.
Figure 7.
Figure 7.. HA-Specific cTfh and cNon-Tfh Clones Do Not Overlap, and HA-Specific cTfh CXCR3+ T Cell Clonotypes Can Be Detected in the tTfh CXCR3+ Subset
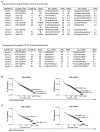
(A) TCR CDR3α and CDR3β sequencing was performed on clones specific for the same HA H1/California peptide that had been generated from either the cTfh CXCR3+, cTfh CXCR3, or cNon-Tfh subset in 3 donors. For each clone, the peptide specificity, the CDR3α and CDR3β amino acid (AA) sequences, and TRAV/TRAJ and TRBV/TRBJ gene usage are shown. Clones are grouped based on the peptide recognized. (B and C) The TCR CDR3α and CDR3β region sequences of 75 HA-specific clones generated from the blood populations were determined, and the ex vivo Vα and Vβ repertoires of tonsil and blood Tfh and non-Tfh populations from the same subject were searched for matching sequences. Matches were detected only in donor 2. The frequency distributions of each of the individual clonotypes detected in the tonsil tTfh CXCR3+ (B) and peripheral blood cTfh CXCR3+ (C) repertoires are shown, with yellow circles indicating the sequences that matched those of the HA-specific cTfh CXCR3+ clones generated from the peripheral blood of the same donor. See also Figure S5.

References

    1. Alam S, and Sant AJ (2011). Infection with seasonal influenza virus elicits CD4 T cells specific for genetically conserved epitopes that can be rapidly mobilized for protective immunity to pandemic H1N1 influenza virus. J. Virol 85, 13310–13321. - PMC - PubMed
    1. Ansel KM, Ngo VN, Hyman PL, Luther SA, Förster R, Sedgwick JD, Browning JL, Lipp M, and Cyster JG (2000). A chemokine-driven positive feedback loop organizes lymphoid follicles. Nature 406, 309–314. - PubMed
    1. Aschenbrenner D, Foglierini M, Jarrossay D, Hu D, Weiner HL, Kuchroo VK, Lanzavecchia A, Notarbartolo S, and Sallusto F (2018). An immuno-regulatory and tissue-residency program modulated by c-MAF in human TH17 cells. Nat. Immunol 19, 1126–1136. - PMC - PubMed
    1. Avery DT, Bryant VL, Ma CS, de Waal Malefyt R, and Tangye SG (2008). IL-21-induced isotype switching to IgG and IgA by human naive B cells is differentially regulated by IL-4. J. Immunol 181, 1767–1779. - PubMed
    1. Baumjohann D, Preite S, Reboldi A, Ronchi F, Ansel KM, Lanzavecchia A, and Sallusto F (2013). Persistent antigen and germinal center B cells sustain T follicular helper cell responses and phenotype. Immunity 38, 596–605. - PubMed

Publication types

Substances