. 2020 Jan 31;295(5):1350-1365.
doi: 10.1074/jbc.RA119.011471. Epub 2019 Dec 30.

A synthetic lethal drug combination mimics glucose deprivation-induced cancer cell death in the presence of glucose

Affiliations

A synthetic lethal drug combination mimics glucose deprivation-induced cancer cell death in the presence of glucose

James H Joly et al. J Biol Chem. .

Abstract

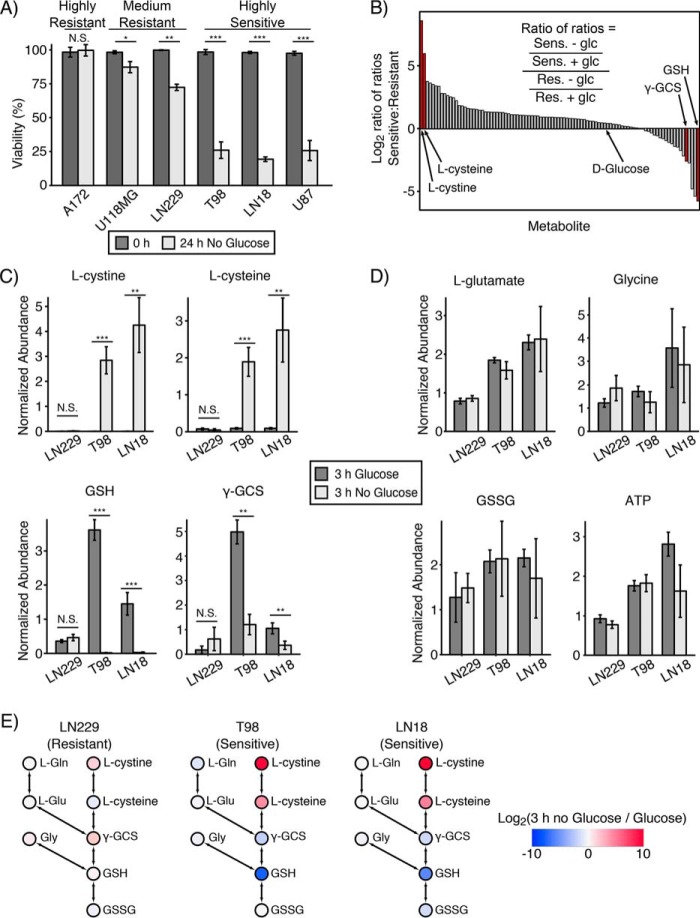
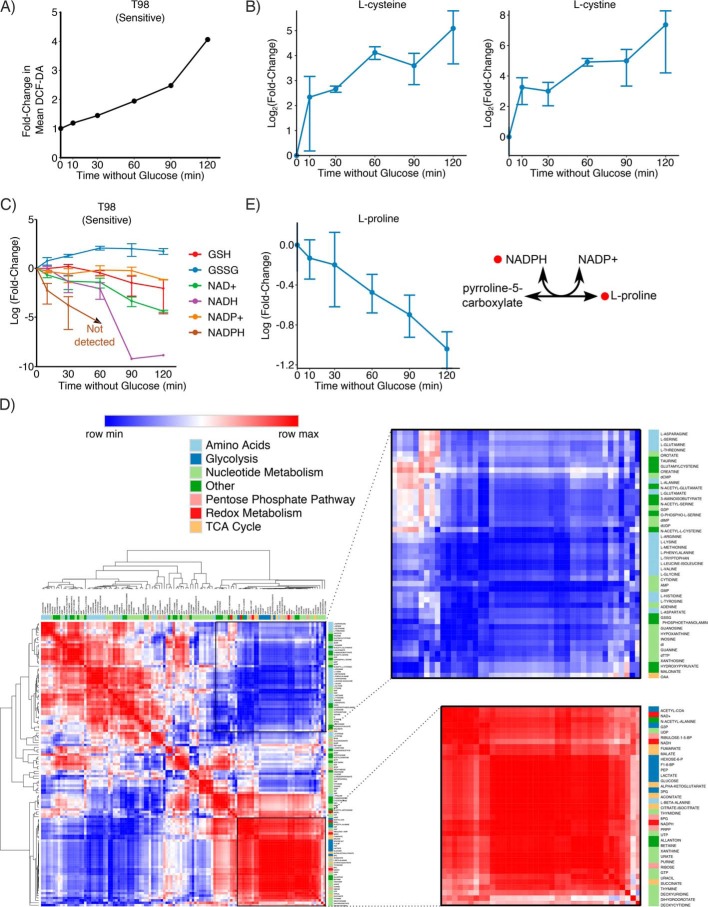
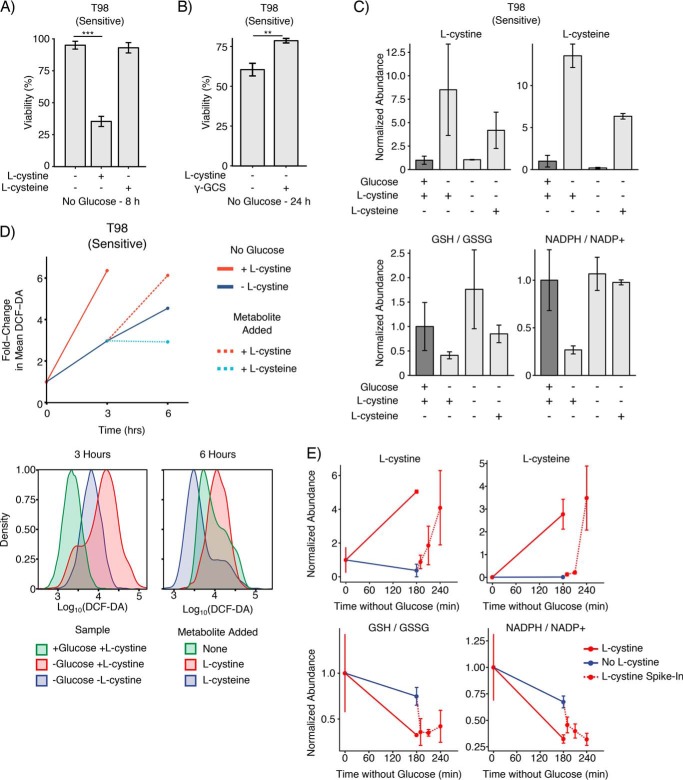
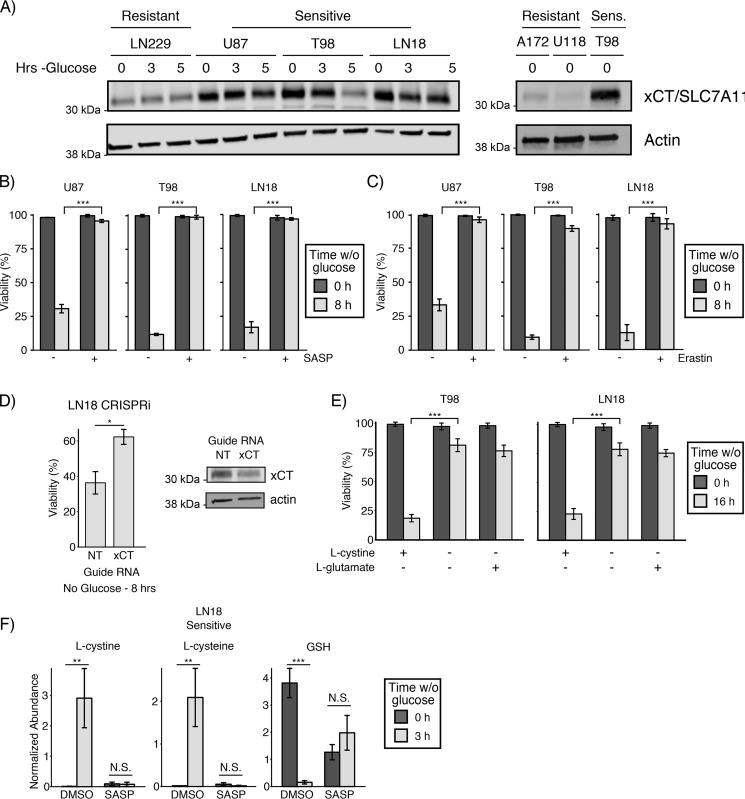
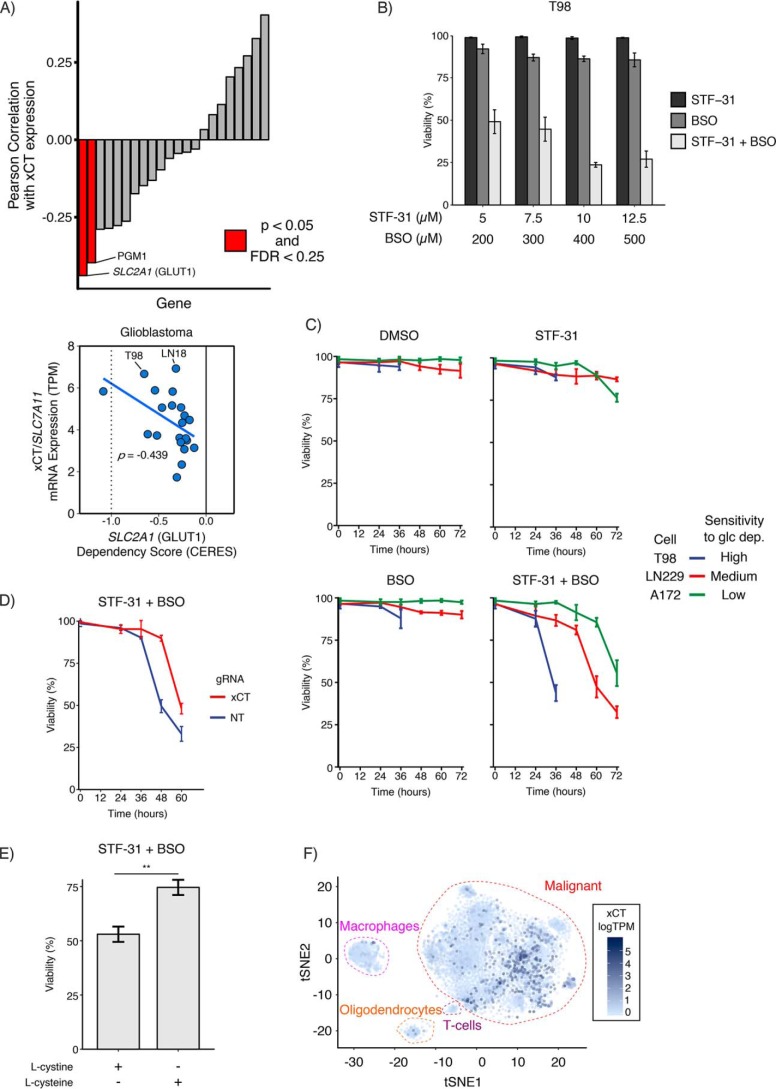
Metabolic reprogramming in cancer cells can increase their dependence on metabolic substrates such as glucose. As such, the vulnerability of cancer cells to glucose deprivation creates an attractive opportunity for therapeutic intervention. Because it is not possible to starve tumors of glucose in vivo, here we sought to identify the mechanisms in glucose deprivation-induced cancer cell death and then designed inhibitor combinations to mimic glucose deprivation-induced cell death. Using metabolomic profiling, we found that cells undergoing glucose deprivation-induced cell death exhibited dramatic accumulation of intracellular l-cysteine and its oxidized dimer, l-cystine, and depletion of the antioxidant GSH. Building on this observation, we show that glucose deprivation-induced cell death is driven not by the lack of glucose, but rather by l-cystine import. Following glucose deprivation, the import of l-cystine and its subsequent reduction to l-cysteine depleted both NADPH and GSH pools, thereby allowing toxic accumulation of reactive oxygen species. Consistent with this model, we found that the glutamate/cystine antiporter (xCT) is required for increased sensitivity to glucose deprivation. We searched for glycolytic enzymes whose expression is essential for the survival of cancer cells with high xCT expression and identified glucose transporter type 1 (GLUT1). Testing a drug combination that co-targeted GLUT1 and GSH synthesis, we found that this combination induces synthetic lethal cell death in high xCT-expressing cell lines susceptible to glucose deprivation. These results indicate that co-targeting GLUT1 and GSH synthesis may offer a potential therapeutic approach for targeting tumors dependent on glucose for survival.

Keywords: L-cystine; NADPH; SLC7A11; Warburg effect; cancer biology; glucose metabolism; metabolomics; redox regulation.


Conflict of interest statement

The authors declare that they have no conflicts of interest with the contents of this article

Figures

Figure 1.
Figure 1.
Accumulation of l-cystine and l-cysteine and depletion of reduced GSH are metabolic markers of sensitivity to glucose deprivation. A, panel of GBM cell lines was subjected to glucose deprivation for 24 h, and viability was measured by trypan blue exclusion. A172 exhibited strong resistance; LN229 and U118MG cells exhibited medium resistance; and T98, LN18, and U87 cells exhibited high sensitivity to glucose deprivation. N.S. denotes p > 0.05; * denotes p < 0.05; ** denotes p < 0.01; *** denotes p < 0.001 by Student's t test (n = 3). B, two glucose deprivation–sensitive (Sens) cell lines (T98 and LN18) and one medium-resistant (Res) cell line (LN229) were deprived of glucose for 3 h in the presence of l-[U-13C]glutamine and then profiled by LC-MS metabolomics. A total of 97 metabolites were identified and quantified. Metabolite pool sizes were ranked using a log2 ratio–of–ratios metric ((average of T98 ± glucose and LN18 ± glucose)/(LN229 ± glucose)). l-Cystine and l-cysteine and reduced glutathione (GSH) were the most differentially regulated metabolites (red bars). γ-GCS was also differentially regulated in glucose deprivation–sensitive cells (rank 93 of 97). C, bar plots from LC-MS metabolomics in B, showing that l-cystine and l-cysteine were accumulated, and GSH and γ-GCS were depleted in glucose deprivation–sensitive GBM cells following 3 h of glucose deprivation. * denotes p < 0.05, ** denotes p < 0.01, and *** denotes p < 0.001 by Student's t test (n = 3). D, individual bar plots from LC-MS metabolomics showing that the GSH synthesis precursors glycine and l-glutamate, as well as oxidized GSH (GSSG) and ATP, were not significantly regulated by 3 h of glucose deprivation in either resistant (LN229) or sensitive cells (T98 and LN18). E, log2 fold change in metabolite pool sizes upon 3 h of glucose deprivation overlaid on the GSH synthesis pathway. Red and blue represent accumulation and depletion, respectively, as shown on the indicated color scale. l-Gln, l-glutamine; l-Glu, l-glutamate; Gly, glycine. Error bars are standard deviation of the mean.
Figure 2.
Figure 2.
GCL activity moderately regulates resistance to glucose deprivation. A, treatment with the GCL inhibitor BSO (500 μm) sensitized glucose deprivation–resistant LN229 GBM cells to glucose deprivation. Cells were treated with either solvent (water) or BSO in the presence or absence of glucose for 16 h, and viability was measured by trypan blue exclusion. * denotes p < 0.05 by Student's t test (n = 2). B, overexpression of GCLM, but not GCLC, confers resistance to glucose deprivation. Lentiviral vectors (pLX302 and pLX304) were used to overexpress either subunit of GCL. Glucose deprivation–sensitive T98 cells were starved of glucose for 8 h, and viability was measured by trypan blue exclusion. Overexpression of GCLM, but not GCLC, increased survival. Combined overexpression of GCLC and GCLM did not confer additional resistance compared with GCLM alone. N.S. denotes p > 0.05; ** denotes p < 0.01 by Student's t test (n = 3). C, GCL holoenzyme is formed rapidly after glucose deprivation in both sensitive and resistant cells. The glucose deprivation–sensitive T98 and -resistant LN229 cell lines were starved of glucose for the indicated time and then lysed in a nonreducing lysis buffer. Treatment with 10 mm H2O2 for 10 min was included as a positive control. Cell lysates were run in native PAGE conditions, and formation of the GCL holoenzyme was monitored by formation of the GCLC–GCLM complex (101 kDa) using a GCLC antibody. D, GCL activity increases in response to glucose deprivation in sensitive T98 but not resistant LN229 cells. T98 and LN229 cells were starved of glucose for 3 h; lysates were collected, and GCL activity was measured using a fluorescence-based microtiter plate assay (31). ** denotes p < 0.01 by Student's t test (n = 2). Error bars are standard deviation of the mean.
Figure 3.
Figure 3.
NADPH is the limiting reducing agent upon glucose deprivation. A, ROS accumulate upon glucose deprivation. ROS was measured by flow cytometry using CM-H2DCFDA at the indicated time points. ROS accumulation steadily increased with time after glucose deprivation. B, glucose deprivation–sensitive T98 cells were deprived of glucose, and metabolites were extracted at the indicated time points. Accumulation of l-cystine and l-cysteine occurred within 10 min after glucose deprivation and steadily increased over the course of 2 h. C, NADPH is rapidly consumed following glucose deprivation. An LC-MS metabolomics method designed to detect NAD(P)H (35) was used at the same time points as in B. Depletion of NADPH preceded depletion of NADH and GSH, with NADPH dropping below the lower limit of detection within 60 min. D, Pearson correlation coefficient was calculated between each metabolite, and hierarchical clustering was performed on the Pearson correlation coefficients. Clustering revealed that l-cystine, l-cysteine, and l-proline behave differently from all other proteinogenic amino acids. Glycolysis metabolites and reducing agents clustered together, reflecting that they both deplete upon glucose deprivation. 18 of 20 proteinogenic amino acids also clustered together, reflecting that amino acid metabolism and glycolysis are uncoupled upon glucose deprivation. E, l-proline is steadily depleted after glucose deprivation in sensitive T98 cells. The de novo synthesis of l-proline requires NADPH to convert pyrroline-5-carboxylate to l-proline. Error bars are standard deviation of the mean.
Figure 4.
Figure 4.
l-Cystine import induces oxidative stress and ROS-mediated cell death in glucose-deprived cancer cells. A, l-cystine, but not l-cysteine, import results in glucose deprivation–induced cell death. Glucose deprivation–sensitive T98 cells were cultured in l-cystine–free medium and subjected to glucose deprivation for 8 h. l-Cystine starvation rescued T98 cells from glucose deprivation–induced cell death. Addition of l-cystine (200 μm), but not l-cysteine (200 μm), sensitized T98 cells to glucose deprivation. B, γ-GCS contributes resistance to glucose and l-cystine deprivation. Glucose deprivation–sensitive T98 cells were starved of glucose and l-cystine for 24 h. Addition of 200 μm γ-GCS conferred a modest resistance compared with DMSO control. ** denotes p value <0.01 by Student's t test (n = 3). C, l-cystine induces oxidative stress upon glucose deprivation. T98 cells were deprived of glucose in l-cystine–free medium for 3 h, and metabolites were quantified using LC-MS metabolomics. Addition of l-cystine (200 μm), but not l-cysteine (200 μm), induced GSH depletion and oxidative stress as measured by the ratio of GSH/GSSG and NADPH/NADP+. D, ROS accumulation following glucose deprivation is driven by l-cystine import. T98-sensitive cells were deprived of glucose in the presence or absence of l-cystine for 3 h, and ROS levels were measured by flow cytometry by CM-H2DCFDA staining. Cells that had been starved of glucose and l-cystine for 3 h were then re-supplemented with l-cystine (200 μm), l-cysteine (200 μm), or neither for an additional 3 h. Left, mean fluorescent intensity of CM-H2DCFDA signal. Center, histograms of CM-H2DCFDA for T98 cells cultured with glucose, without glucose but with l-cystine, or without glucose or l-cystine for 3 h. Right, histograms of CM-H2DCFDA intensity for T98 cells starved of glucose and l-cystine for 3 h and then re-supplemented with l-cystine, l-cysteine, or neither for an additional 3 h. E, l-cystine import induces redox imbalance upon glucose deprivation. Glucose deprivation–sensitive T98 cells were starved of glucose for 3 h in the presence and absence of l-cystine, at which point l-cystine (200 μm) was added for 10, 30, and 60 min. Addition of l-cystine induced a redox imbalance as indicated by dramatic decreases in the ratios GSH/GSSG and NADPH/NADP+. Error bars are standard deviation of the mean.
Figure 5.
Figure 5.
l-Cystine import from system xc is required for glucose deprivation–induced cell death. A, expression of the specific light chain of system xc, xCT/SLC7A11, correlates with sensitivity to glucose deprivation in GBM cell lines. The resistant and sensitive (Sens.) GBM cell lines were starved of glucose for the indicated times and then lysed. Expression of xCT/SLC7A11 was assessed by Western blotting. Actin was used as an equal loading control. B and C, pharmacological inhibition of xCT-rescued sensitive cells from glucose deprivation–induced cell death. The indicated sensitive GBM cells were treated with either SASP (500 μm) or erastin (10 μm) in the presence or absence of glucose for 8 h, and viability was assessed by trypan blue exclusion. *** denotes p < 0.001 by Student's t test (n = 3). D, genetic knockdown of xCT promoted resistance to glucose deprivation in sensitive LN18 cells. Cells were first infected with CRISPRi machinery (dCas9-KRAB (66)) and then infected with a second vector carrying the indicated guide RNA. Cells were then cultured for 8 h in the presence or absence of glucose, and viability was measured by trypan blue exclusion. * denotes p < 0.05 by Student's t test (n = 3). Western blotting with antibodies against xCT and the equal loading control actin confirmed knockdown. NT, nontargeting control. E, l-cystine starvation rescues sensitive cells from glucose deprivation–induced death. The sensitive GBM cell lines were cultured in l-cystine-free DMEM in the presence and absence of glucose for 16 h. The media were supplemented with either l-cystine (200 μm) or l-glutamate (100 μm), and viability was measured by trypan blue exclusion. *** denotes p < 0.001 by Student's t test (n = 3). F, inhibition of the xCT cystine/glutamate antiporter prevents GSH depletion following glucose deprivation. The sensitive GBM cell line LN18 was cultured with and without glucose in the presence or absence of the xCT inhibitor SASP (500 μm) for 3 h, and then intracellular metabolite concentrations were measured using LC-MS metabolomics. xCT inhibition prevented the accumulation of l-cystine and l-cysteine and depletion of GSH following glucose deprivation. N.S. denotes p > 0.05; ** denotes p < 0.01, *** denotes p < 0.001 by Student's t test (n = 3). Error bars are standard deviation of the mean.
Figure 6.
Figure 6.
Inhibition of GSH synthesis is synthetically lethal with GLUT1 inhibition. A, glioblastoma cells rely on SLC2A1 (GLUT1) as xCT expression increases. Using data from the DepMap (40), glycolytic genes were filtered for expression in GBM and then ranked by their Pearson correlation coefficient between dependence (CERES score) and xCT expression. A negative CERES score indicates increased dependence. SLC2A1 (GLUT1) and PGM1 were the top hits for GBM. FDR, false discovery rate. B, co-inhibition of GLUT1 and GCL synergistically induces cell death in glucose deprivation–sensitive cells. T98 cells were cultured in 5 mm glucose and treated with STF-31 and/or BSO at the indicated doses. After 36 h of treatment, the combination of drugs synergistically induced cell death. C, sensitivity to glucose deprivation correlates with response to combined STF-31 and BSO treatment. High glucose deprivation–sensitive T98, medium-resistant LN229, and highly-resistant A172 GBM cells were cultured in 5 mm glucose and treated with STF-31 (12.5 μm), BSO (500 μm), or both. T98 cells died after 36 h of treatment, whereas LN229 cells died after 60 h of treatment, and A172 cells died after 72 h of combined STF-31 and BSO treatment. D, genetic knockdown of xCT confers resistance to STF-31 and BSO treatment in xCT-high LN18 cells. Cells were first infected with CRISPRi machinery (dCas9-KRAB (66)) and then infected with a second vector carrying the indicated guide RNA. Cells were cultured in 5 mm glucose and treated with STF-31 (12.5 μm), BSO (500 μm), or both. After 48 h, combined STF-31 and BSO treatment induced cell death in nontargeting control cells but not in xCT-knockdown cells. E, l-cystine import contributes to combined STF-31 and BSO-induced cell death in T98 cells. Cells were cultured in 5 mm glucose supplemented with either l-cystine (200 μm) or l-cysteine (200 μm). l-Cysteine treatment conferred resistance to combined STF-31 (12.5 μm) and BSO (500 μm) treatment. ** denotes p < 0.01 by Student's t test (n = 3). F, xCT expression is increased in a subset of GBM. Single-cell RNA-Seq data from 28 adult and pediatric patients (42) was analyzed for xCT expression (logTPM). xCT expression was overlaid onto a tSNE plot to compare malignant GBM cells to macrophages, T cells, and oligodendrocytes. Error bars are standard deviation of the mean.

References

    1. Vander Heiden M. G. (2011) Targeting cancer metabolism: a therapeutic window opens. Nat. Rev. Drug Discov. 10, 671–684 10.1038/nrd3504 - DOI - PubMed
    1. Hamanaka R. B., and Chandel N. S. (2012) Targeting glucose metabolism for cancer therapy. J. Exp. Med. 209, 211–215 10.1084/jem.20120162 - DOI - PMC - PubMed
    1. Galluzzi L., Kepp O., Vander Heiden M. G., and Kroemer G. (2013) Metabolic targets for cancer therapy. Nat. Rev. Drug Discov. 12, 829–846 10.1038/nrd4145 - DOI - PubMed
    1. Cairns R. A., and Mak T. W. (2016) The current state of cancer metabolism. Nat. Rev. Cancer 16, 613–614 10.1038/nrc.2016.100 - DOI
    1. Martinez-Outschoorn U. E., Peiris-Pagés M., Pestell R. G., Sotgia F., and Lisanti M. P. (2017) Cancer metabolism: a therapeutic perspective. Nat. Rev. Clin. Oncol. 14, 11–31 10.1038/nrclinonc.2016.60 - DOI - PubMed

Publication types

MeSH terms