. 2022 Jan;25(1):33-45.
doi: 10.1080/1028415X.2019.1707421. Epub 2020 Jan 9.

Reduced phasic dopamine release and slowed dopamine uptake occur in the nucleus accumbens after a diet high in saturated but not unsaturated fat

Affiliations

Reduced phasic dopamine release and slowed dopamine uptake occur in the nucleus accumbens after a diet high in saturated but not unsaturated fat

Cherie N Barnes et al. Nutr Neurosci. 2022 Jan.

Abstract

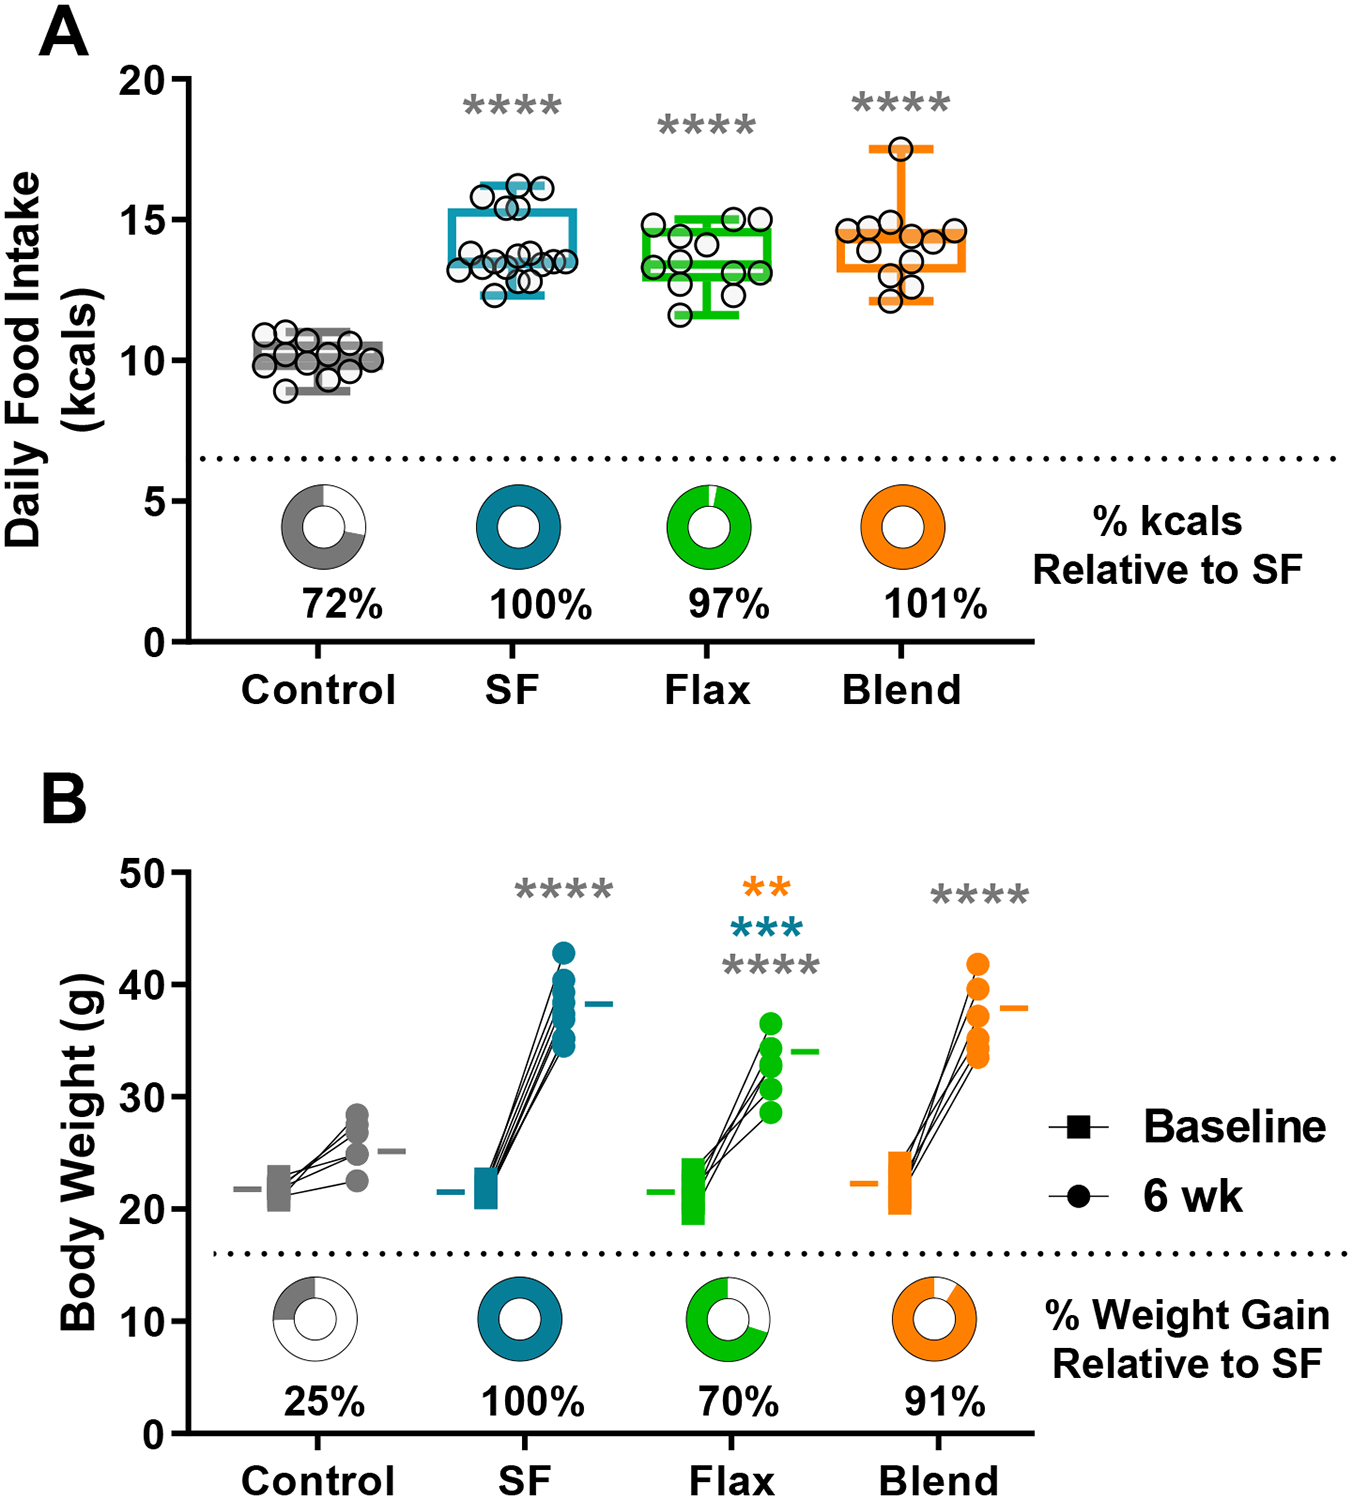
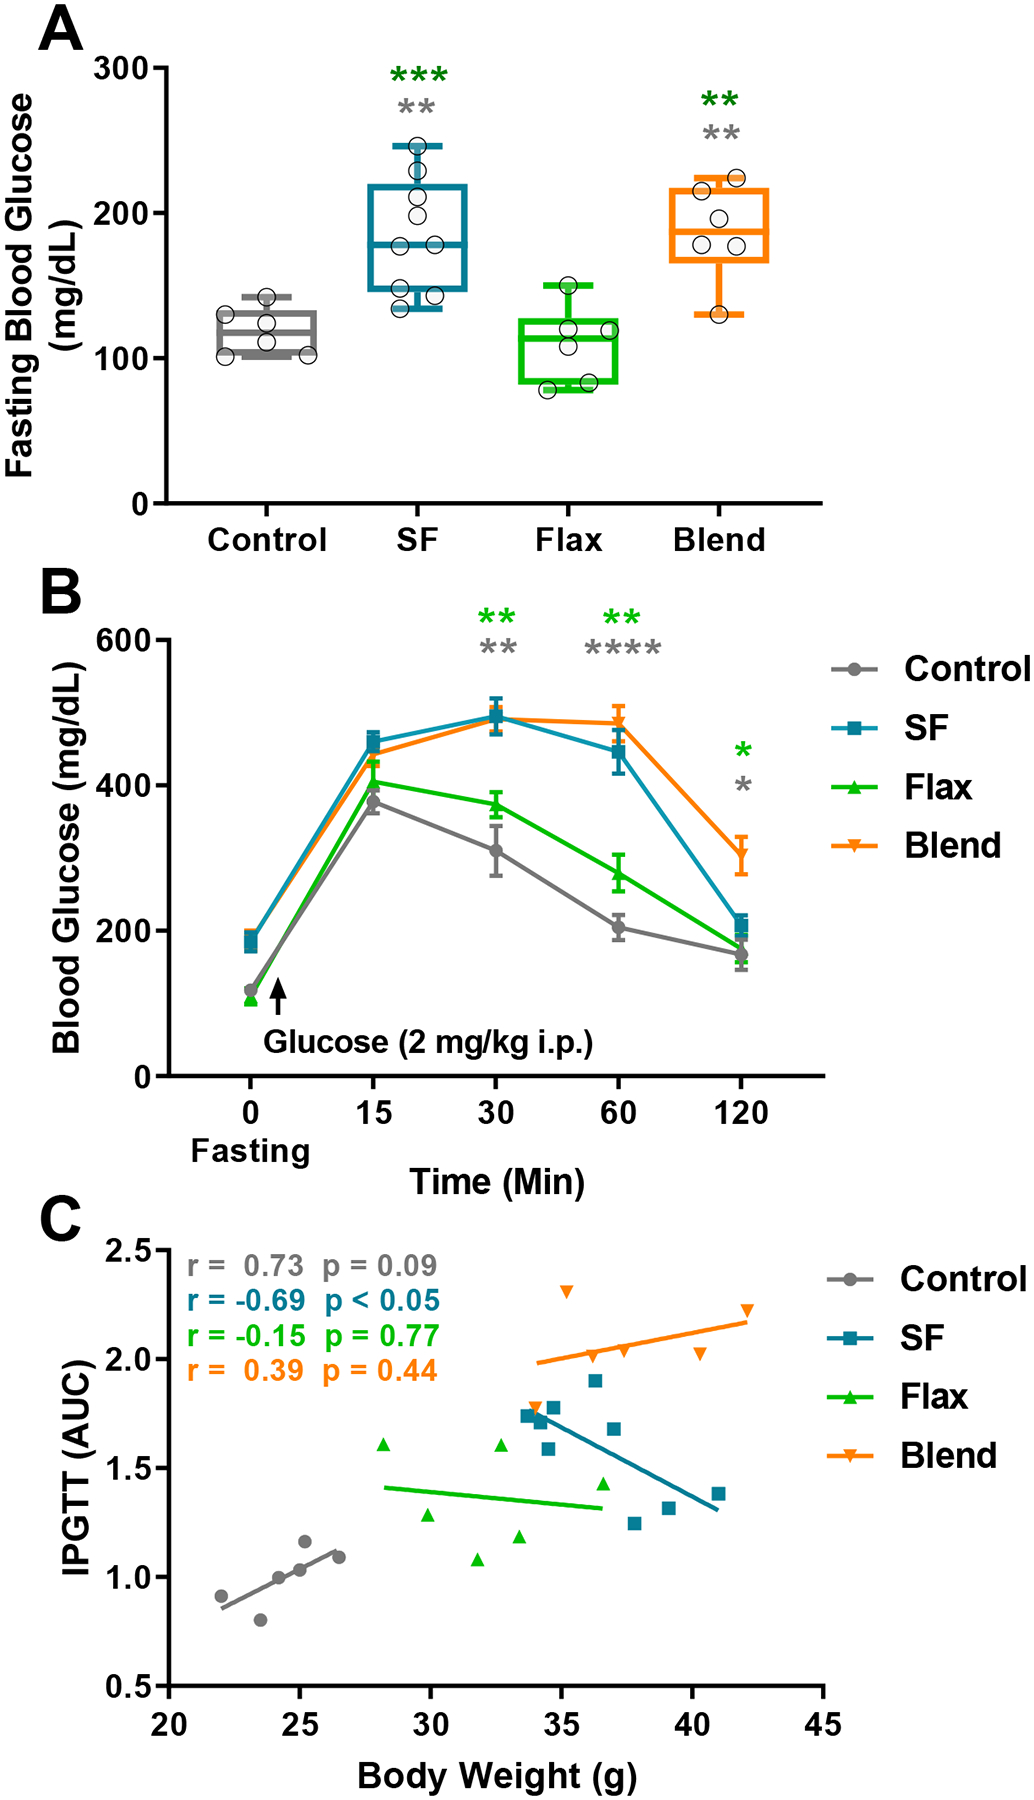
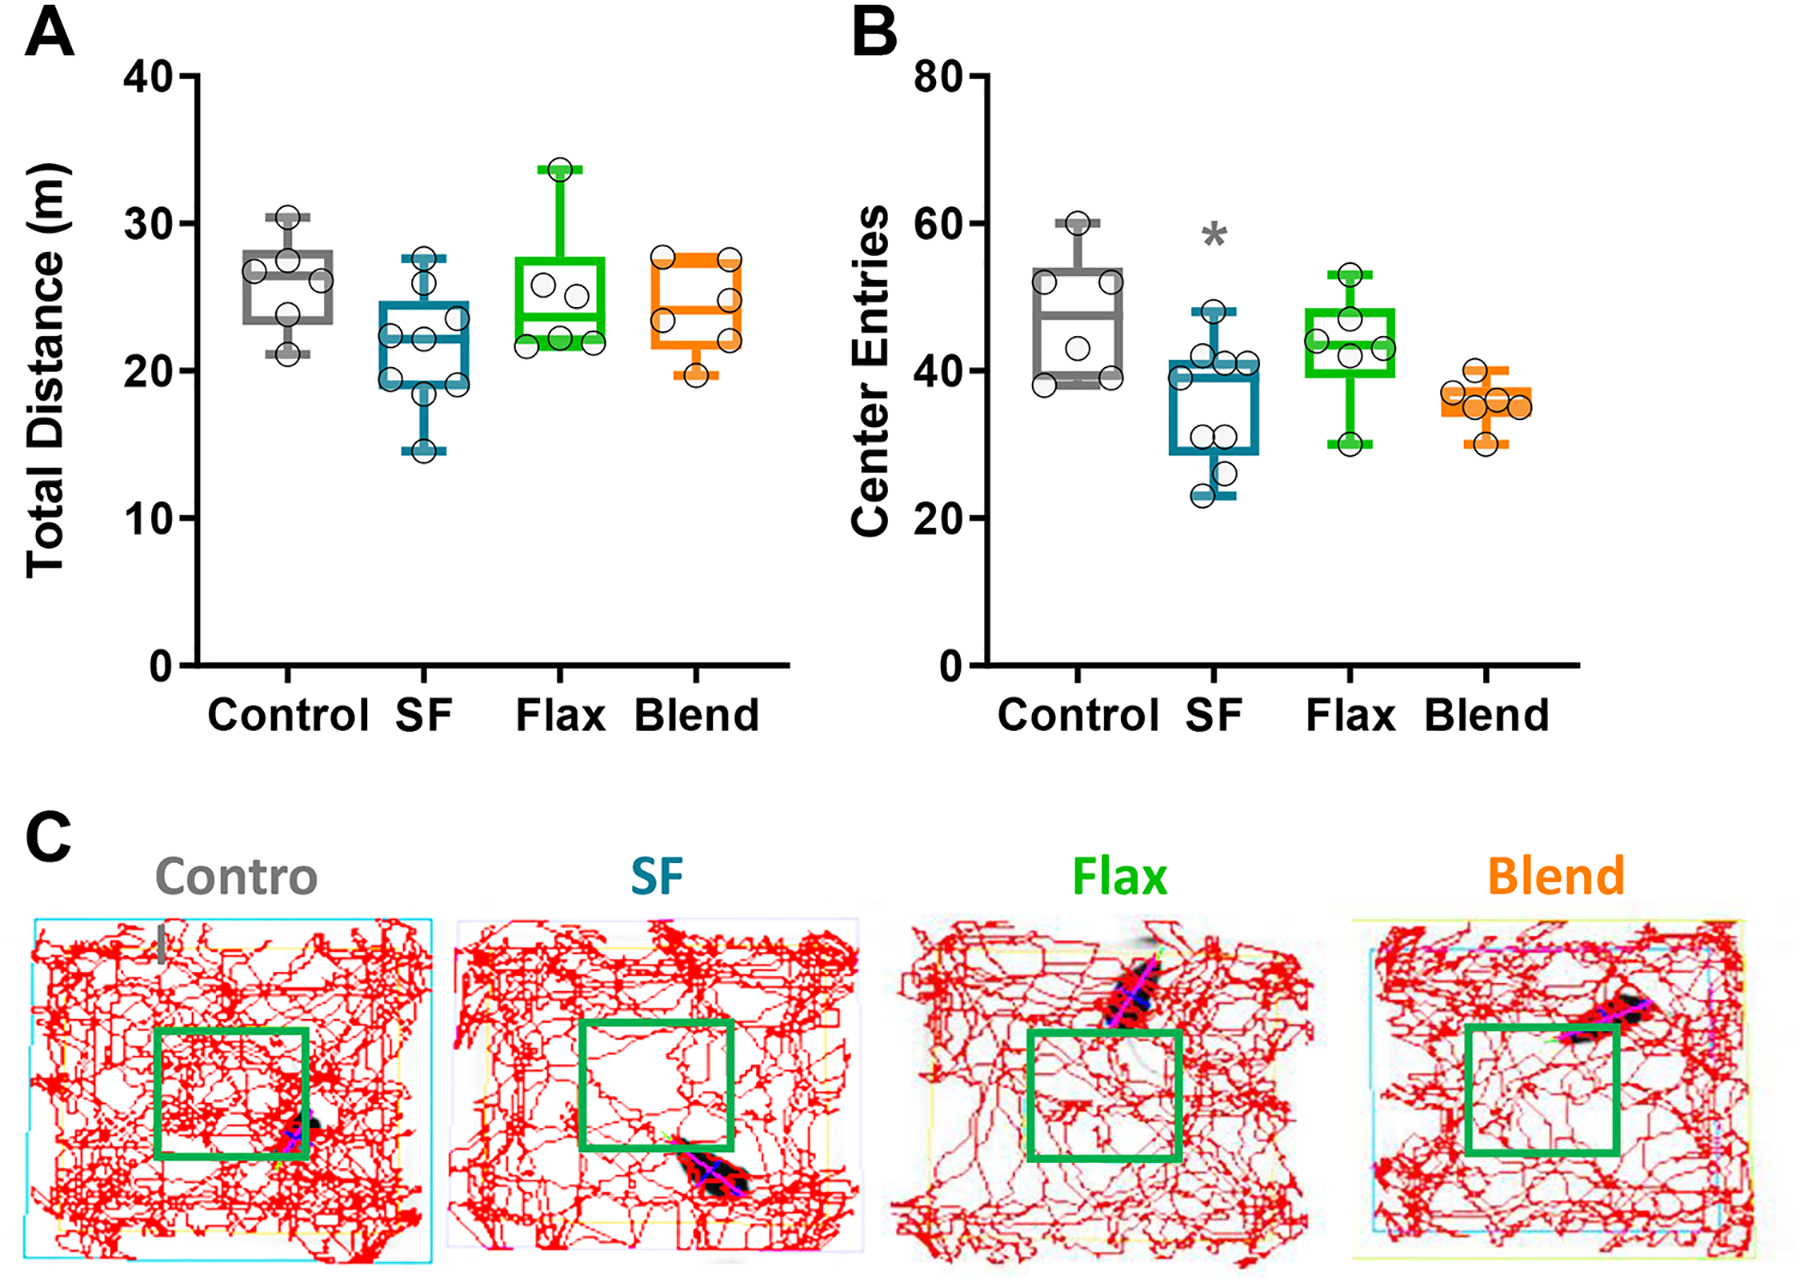
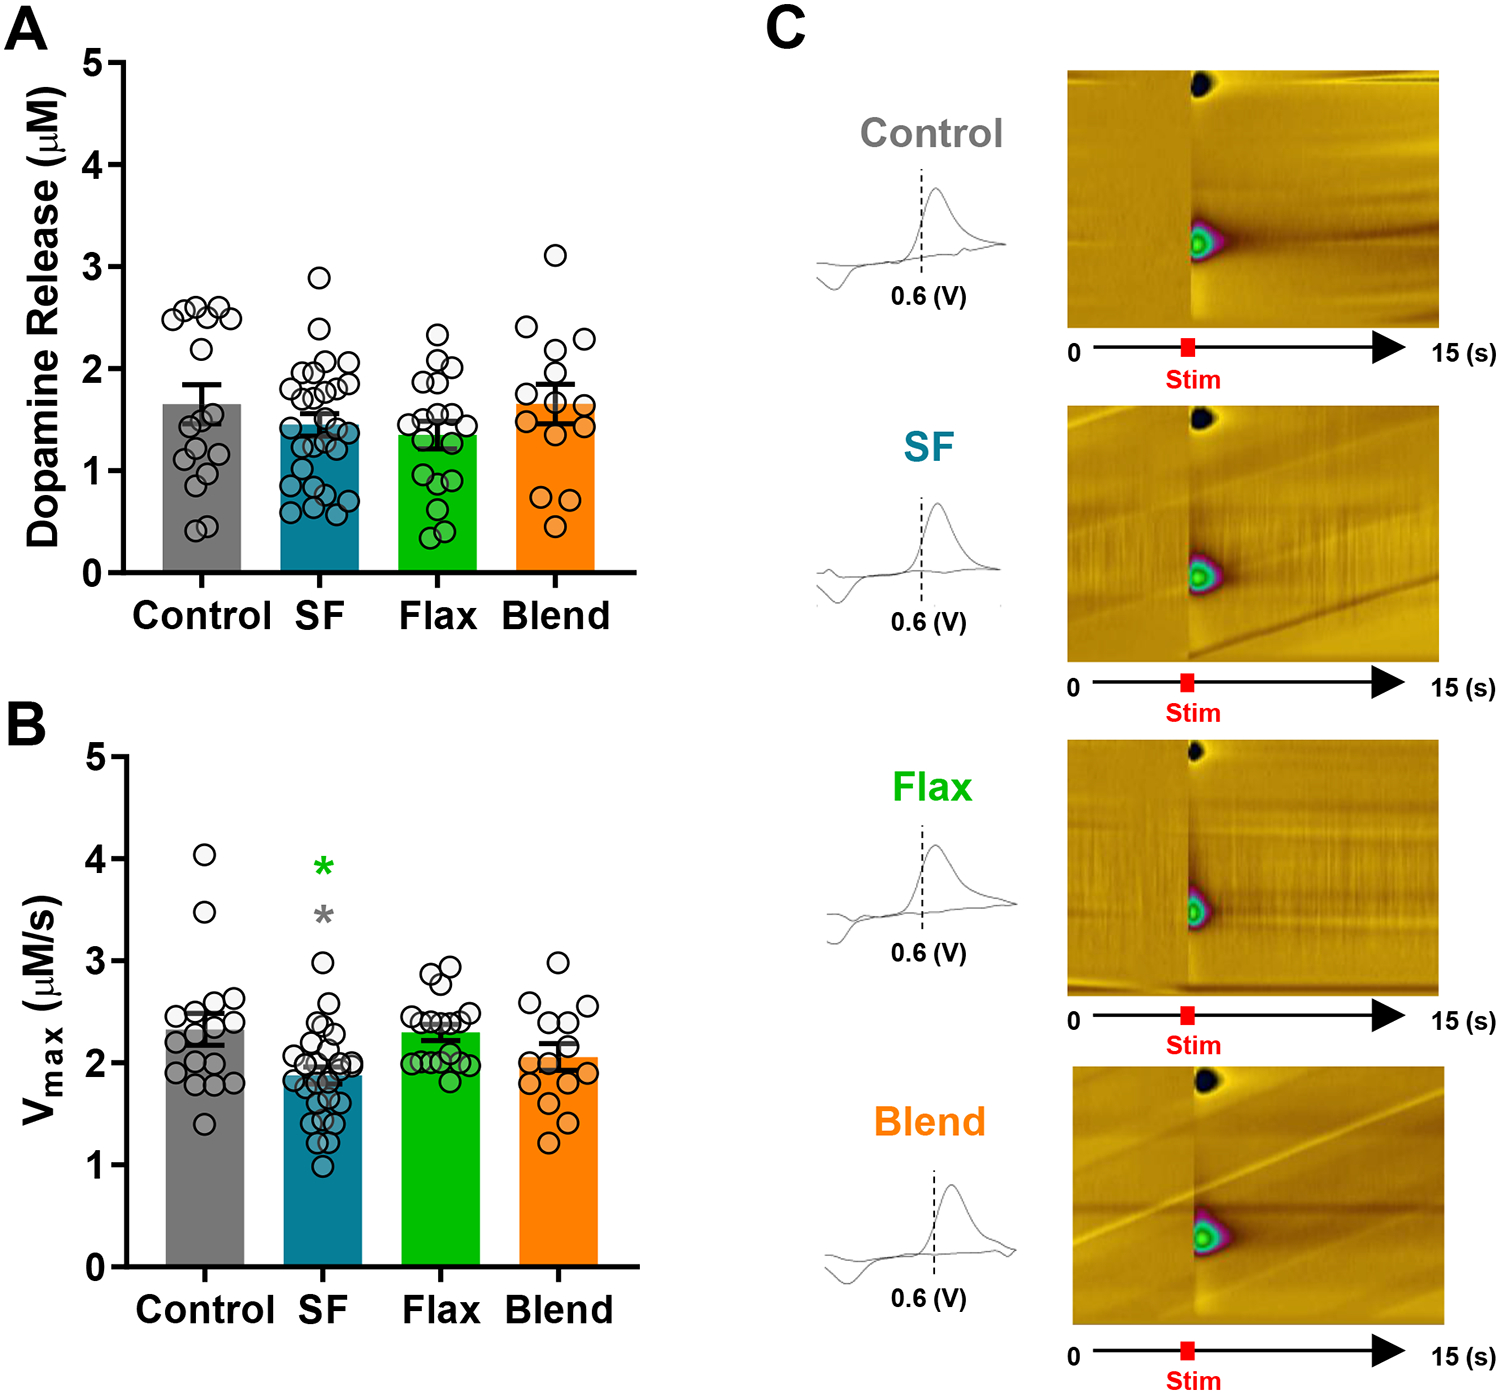
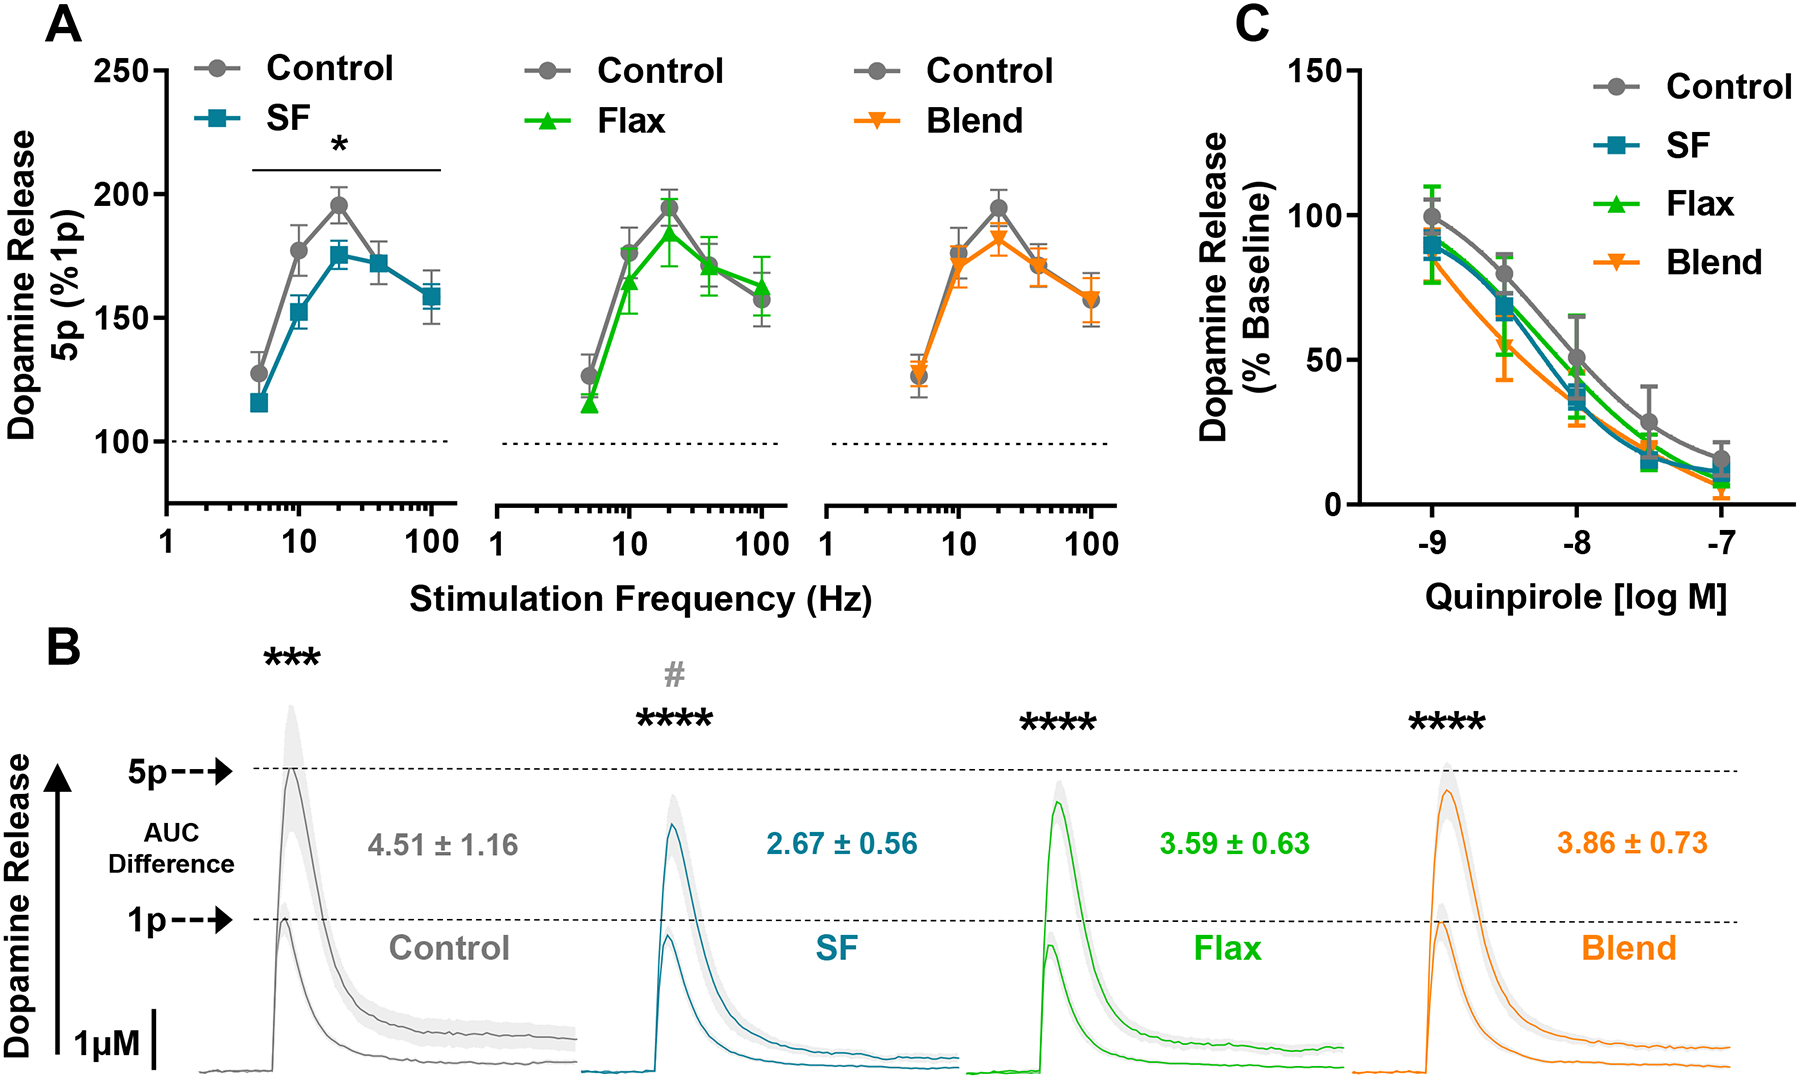
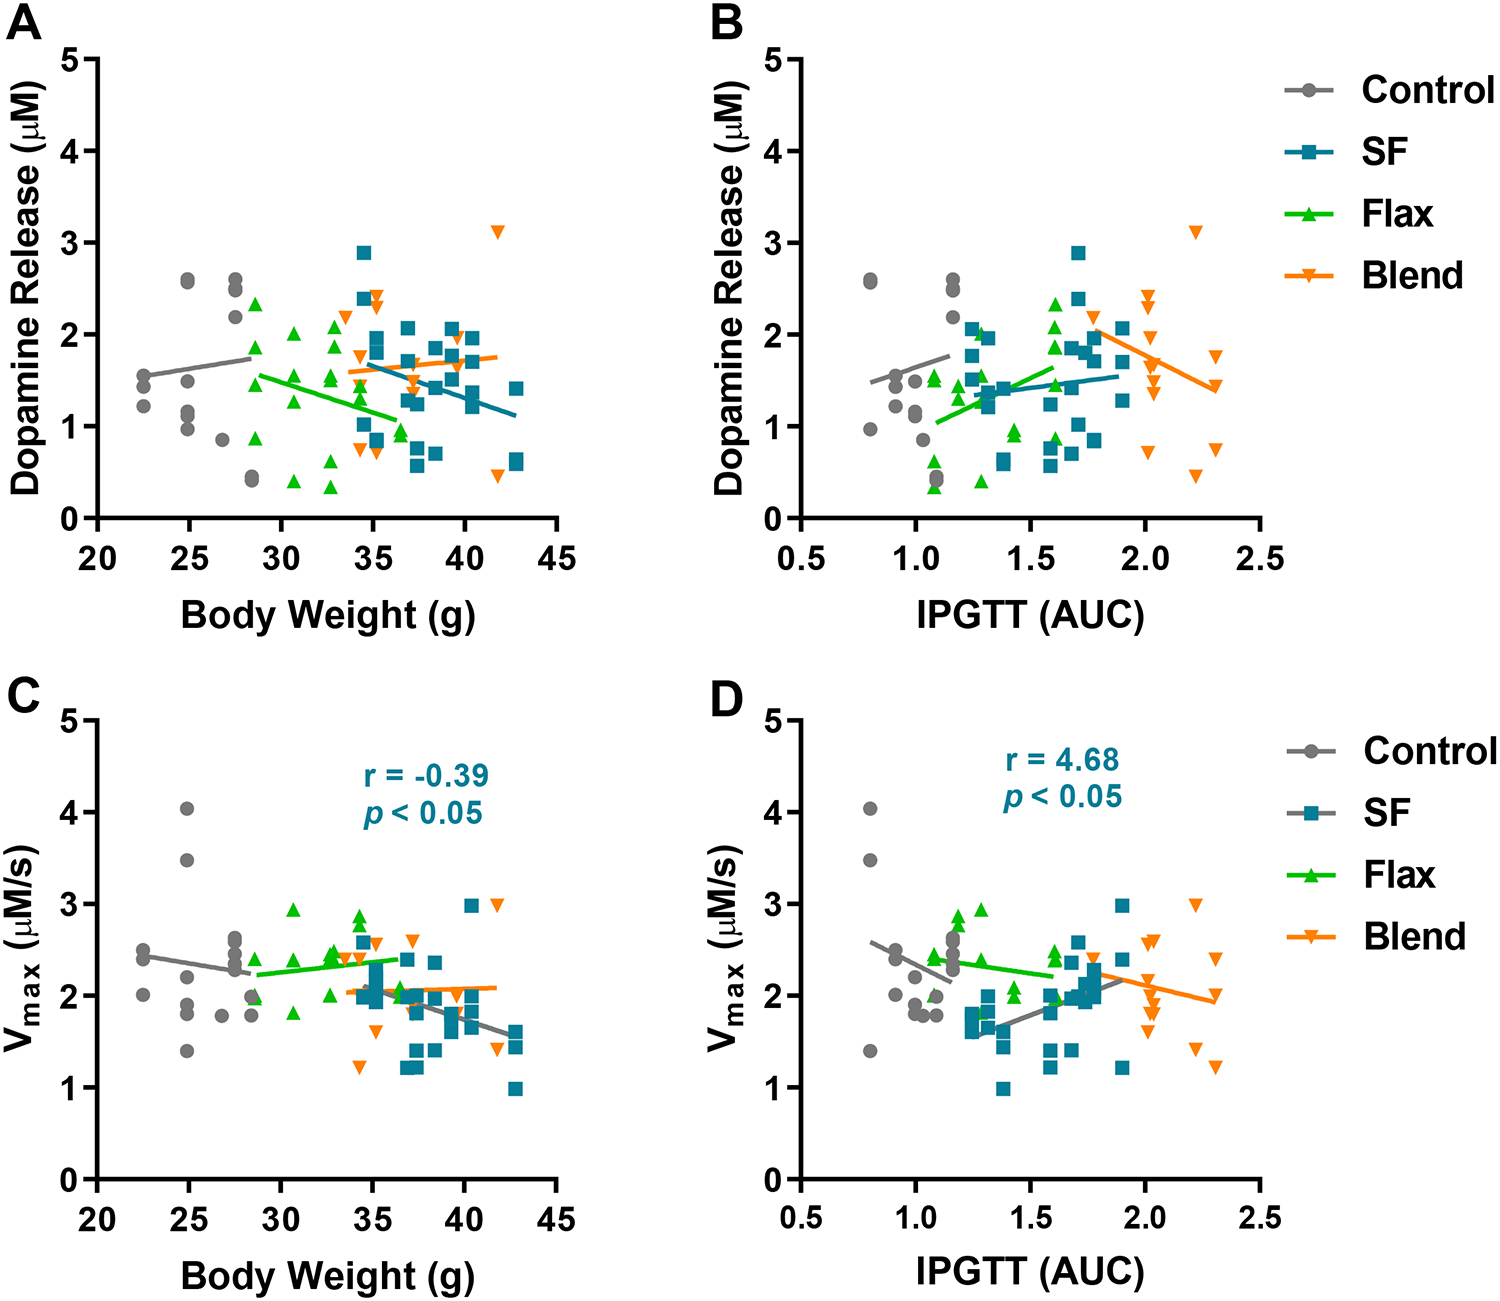
High-fat diets are linked with obesity and changes in dopamine neurotransmission. Mounting evidence shows that saturated fat impacts dopamine neurons and their terminal fields, but little is known about the effect a diet high in unsaturated fat has on the dopamine system. This study sought to determine whether fat type, saturated vs. unsaturated, differentially affected body weight, blood glucose regulation, locomotor behavior, and control of dopamine release and uptake at dopamine neuron terminals in the nucleus accumbens (NAc). C57BL/6 mice were fed a control diet or a nutrient-matched diet high in saturated fat (SF), unsaturated flaxseed oil (Flax) or a blend of the two fats. After 6-weeks, mice from each high-fat diet group gained significantly more weight than Controls, but the group fed Flax gained less weight than the SF group and had fasting blood glucose levels similar to Controls. Ex-vivo fast scan cyclic voltammetry revealed the SF group also had significantly slower synaptic dopamine clearance and a reduced capacity for phasic dopamine release in the nucleus accumbens (NAc), but the Flax and Blend groups resembled Controls. These data show that different types of dietary fat have substantially different effects on metabolic phenotype and influence how dopamine terminals in the NAc regulate dopamine neurotransmission. Our data also suggests that a diet high in unsaturated fat may preserve normal metabolic and behavioral parameters as well as dopamine signaling in the NAc.

Keywords: Saturated fat; dopamine; flax; neurochemistry; nucleus accumbens; obesity; unsaturated fat; voltammetry.


Conflict of interest statement

Disclosure: The authors declared no conflicts of interest.

Figures

Figure 1:
Figure 1:. Food Intake and Body Weight -
(A) Average daily food intake in kilocalories (kcals) over 6-weeks, with circle graphs indicating the amount of daily kcals consumed relative to the saturated fat (SF) group. Box plot represents the median, 25th and 75th percentiles, with the whiskers indicating the minimum and maximum values. (B) Initial and final body weights in grams (g) connected by a line for each individual mouse grouped by diet. The (−) marks indicate group means, and the circle graphs below show the percent weight gain compared to the SF group. (**, p < 0.01; ***, p < 0.001, ****, p < 0.0001)
Figure 2:
Figure 2:. Blood Glucose Regulation -
(A) Blood glucose measurements following a 9 hr fast. Box plot represents the median, 25th and 75th percentiles, with the whiskers indicating the minimum and maximum values. (B) Blood glucose values expressed as group mean ± SEM before and after delivery of glucose (2mg/kg i.p.). (C) Correlational analysis of glucose clearance plotted as a function of body weight, with lines representing linear regression analysis within group. Pearson’s r values and corresponding p value are inset in vertical order of treatment group legend. (**, p < 0.01; ***, p < 0.001, ****, p < 0.0001)
Figure 3:
Figure 3:. Locomotor Behaviors -
(A) Total distance traveled during 10 minutes in an open field. (B) Number of times each animal entered the center area of the open field during 10-minute exploration. (C) Representative line traces showing spatial location of exploratory behaviors of the open field. Box plot represents the median, 25th and 75th percentiles, with the whiskers indicating the minimum and maximum values. (*, p < 0.05)
Figure 4:
Figure 4:. Dopamine Release and Uptake in the NAc -
Dopamine release (A) and maximal rate of dopamine uptake (Vmax) (B) evoked by a single pulse stimulation. To account for heterogeneous differences in dopamine release and uptake between micro-domains within dopamine terminal regions of the NAc, at least two baseline recordings were obtained from two to three separate coronal slices containing the NAc, per mouse. The following are the (n) values for mice, slices, and total recordings for each group, respectively: Control n=6 mice, 11 slices, 17 recordings; SF n=9 mice, 18 slices, 28 recordings; Flax n=6 mice, 12 slices, 18 recordings; Blend n=6 mice, 10 slices, 14 recordings. (C) Representative cyclic voltammograms showing the oxidation peak of dopamine at 0.6 volts (V) accompanied by the corresponding pseudo color plot showing the change in current magnitude over time after evoking dopamine release by a single pulse at 4.9 seconds.
Figure 5:
Figure 5:. Phasic Dopamine Release and D2 Auto-receptor Function -
(A) Frequency response curve showing dopamine release evoked by 5-pulse trains (5p) at 5, 10, 20, 40, and 100 Hz. Phasic 5-pulse dopamine release is expressed as a percent of single pulse (1p) dopamine release, and values are mean ± SEM. (B) Aggregated line curves showing dopamine release from 1 and 5 pulses, along with the difference in AUC from 5p to 1p. The shaded area between dotted lines represents SEM, asterisks denote significant difference between 1p and 5p within group, and the pound sign represents a significant reduction in 5p dopamine release in the SF group compared to Control. (C) Dopamine release following a cumulative half-log dose-response curve of the D2 agonist, quinpirole. Changes in dopamine release are expressed as percent stable baseline prior to quinpirole application. (* and #, p < 0.05; ***, p < 0.001, ****, p < 0.0001)
Figure 6:
Figure 6:. Relationship Between Dopamine Release and Uptake with Body Weight and Glucose Clearance -
Correlational analysis revealed no association between dopamine release and final body weight (A) or AUC for glucose clearance during the IPGTT (B). In the SF group only, a significant negative correlation was observed between the maximal rate of dopamine uptake (Vmax) and body weight (C), and a significant positive correlation was observed between Vmax and reduced ability to clear blood glucose (D). Significant Pearson’s r values for the SF group are inset.

References

    1. Overweight & Obesity Statistics | NIDDK [Internet]. Natl. Inst. Diabetes Dig. Kidney Dis 2017. [cited 2019 Aug 20]. Available from: https://www.niddk.nih.gov/health-information/health-statistics/overweigh....
    1. Raatz SK, Conrad Z, Johnson LK, et al. Relationship of the Reported Intakes of Fat and Fatty Acids to Body Weight in US Adults. Nutrients [Internet]. 2017. [cited 2019 Jul 15];9. Available from: https://www.ncbi.nlm.nih.gov/pmc/articles/PMC5452168/. - PMC - PubMed
    1. Volkow ND, Wang G-J, Tomasi D, et al. The Addictive Dimensionality of Obesity. Biol. Psychiatry 2013;73:811–818. - PMC - PubMed
    1. Hryhorczuk C, Florea M, Rodaros D, et al. Dampened Mesolimbic Dopamine Function and Signaling by Saturated but not Monounsaturated Dietary Lipids. Neuropsychopharmacology 2016;41:811–821. - PMC - PubMed
    1. Stice E, Burger KS, Yokum S. Reward Region Responsivity Predicts Future Weight Gain and Moderating Effects of the TaqIA Allele. J. Neurosci 2015;35:10316–10324. - PMC - PubMed

MeSH terms