. 2020 Mar 1;80(5):1088-1101.
doi: 10.1158/0008-5472.CAN-19-2080. Epub 2020 Jan 8.

Tumor Cell-Derived IL1β Promotes Desmoplasia and Immune Suppression in Pancreatic Cancer

Affiliations

Tumor Cell-Derived IL1β Promotes Desmoplasia and Immune Suppression in Pancreatic Cancer

Shipra Das et al. Cancer Res. .

Abstract

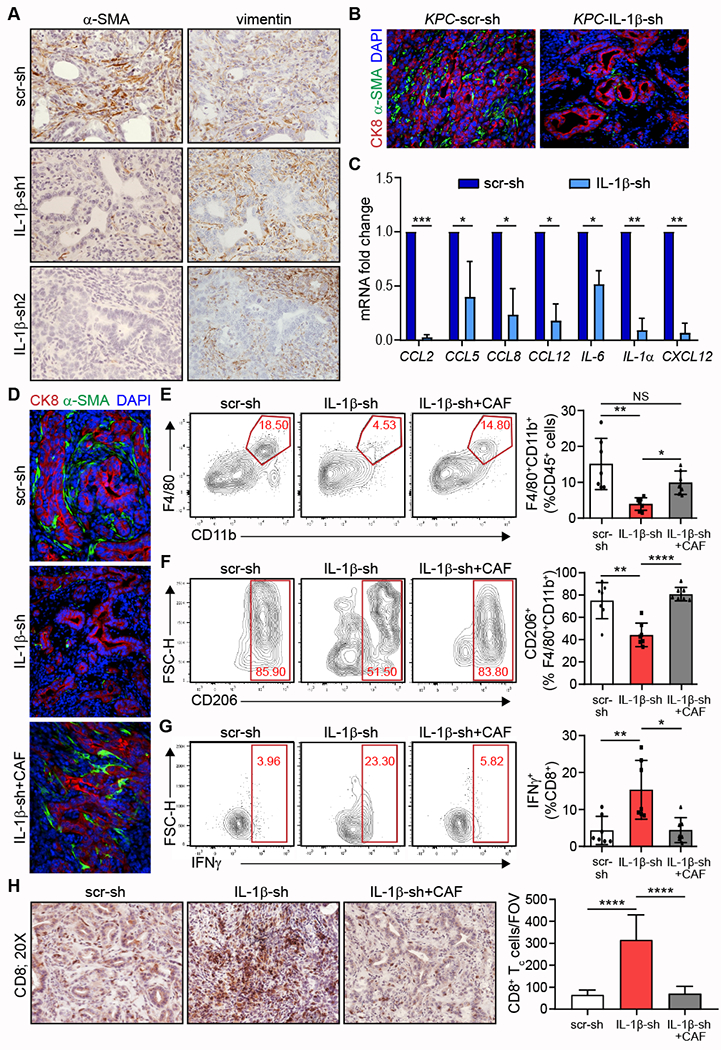
Pancreatic ductal adenocarcinoma (PDA) is an aggressive malignancy typified by a highly stromal and weakly immunogenic tumor microenvironment that promotes tumor evolution and contributes to therapeutic resistance. Here, we demonstrate that PDA tumor cell-derived proinflammatory cytokine IL1β is essential for the establishment of the protumorigenic PDA microenvironment. Tumor cell-derived IL1β promoted the activation and secretory phenotype of quiescent pancreatic stellate cells and established an immunosuppressive milieu mediated by M2 macrophages, myeloid-derived suppressor cells, CD1dhiCD5+ regulatory B cells, and Th17 cells. Loss of tumor cell-derived IL1 signaling in tumor stroma enabled intratumoral infiltration and activation of CD8+ cytotoxic T cells, attenuated growth of pancreatic neoplasia, and conferred survival advantage to PDA-bearing mice. Accordingly, antibody-mediated neutralization of IL1β significantly enhanced the antitumor activity of α-PD-1 and was accompanied by increased tumor infiltration of CD8+ T cells. Tumor cell expression of IL1β in vivo was driven by microbial-dependent activation of toll-like receptor 4 (TLR4) signaling and subsequent engagement of the NLRP3 inflammasome. Collectively, these findings identify a hitherto unappreciated role for tumor cell-derived IL1β in orchestrating an immune-modulatory program that supports pancreatic tumorigenesis. SIGNIFICANCE: These findings identify a new modality for immune evasion in PDA that depends on IL1β production by tumor cells through TLR4-NLRP3 inflammasome activation. Targeting this axis might provide an effective PDA therapeutic strategy.


Conflict of interest statement

Competing Interests Statement: The authors declare no potential conflicts of interest.

Figures

Figure 1.
Figure 1.. Tumor cell-derived IL-1β is required for pancreatic oncogenesis.
A. mRNA transcript levels of IL-1β in PDA compared to normal adjacent tissue from publicly available human transcriptomic data (74 patients: n=50 PDA and n=24 adjacent normal). Each data point indicates an individual tissue sample. Error bars indicate SD; P-values determined by the Student t test (two-tailed, unpaired). B. Representative immunohistochemical detection of IL-1β expression in sections from human PDA and adjacent normal tissues (n=10 patient samples). C. Representative immunofluorescence detection of IL-1β expression on a section from a 4 month-old KC mouse pancreas (N=12; CK8 red; IL-1β green; and DAPI blue). D. Representative immunofluorescence detection of IL-1β expression on a section from a 2-month-old KPC mouse pancreas (N=8 at 2-4 mo; CK8, red; IL-1β, green; DAPI, blue). E. Quantification of flow cytometric analysis of distribution of IL-1β expression in epithelial (EpCAM+), fibroblast (CD140a+) and immune (CD45+) cells sorted from pancreata of 1-2 month-old KC mice (N=7). Error bars indicate SD. F. Graph indicates quantification of percentage of CK8+ signal per lesion from immunohistochemical staining with CK8 antibody on sections of orthotopic pancreatic grafts 2 weeks after implantation of KRasG12D-PDEC expressing scrambled shRNA (scr-sh) control or IL-1β shRNAs (IL-1β-sh1, IL-1β-sh2) in wild type (WT) mice. (N=8-9). Error bars indicate SD; P-values determined by the Student t test (two-tailed, unpaired). Data representative of 3 independent experiments. G. Representative tumors 4 weeks after orthotopic implantation of KPC cells expressing scrambled shRNA (scr-sh) or IL-1β shRNA (IL-1β-sh) in pancreata of WT mice. H. Graph represents quantification of G, indicating tumor volume (N=15). Error bars indicate SD; P-values determined by the Student t test (two-tailed, unpaired). Data representative of 3 independent experiments. I. Kaplan Meier curve for survival analysis of mice bearing pancreatic tumors derived from orthotopically implanted scr-sh or IL-1β-sh KPC cells (N=8). P-values determined by the Student t test (two-tailed, unpaired). Data representative of 2 independent experiments. ***p < 0.001; ****p < 0.0001.
Figure 2.
Figure 2.. Tumor cell-derived IL-1β promotes immune suppression in the pancreatic tumor microenvironment.
A-C. Representative flow cytometry plots and quantification (graph, bottom) from orthotopic pancreatic grafts of scr-sh or IL-1β-sh KRasG12D-PDEC in WT mice 2 weeks post-implantation analyzing A, CD11b+F4/80+ tumor-associated macrophages, B, CD11b+Gr1+ myeloid-derived suppressor cells (MDSC), and C, CD11b+Ly6G+ tumor-associated neutrophil populations. For A-C, graphs indicate immune sub-populations as a percentage of CD45+ cells (N=5-8). Error bars indicate SD; P-values determined by the Student t test (two-tailed, unpaired). Data representative of 2 independent experiments. D-F. Representative flow cytometry plots and quantification (graph, bottom) from orthotopic pancreatic grafts of scr-sh or IL-1β-sh KRasG12D-PDEC in WT mice 2 weeks post-implantation analyzing D, CD5+ regulatory B (Breg) cells measured as a percentage of total CD19+CD1dhi B cells (N=6), E, RORγt+ TH17 cells measured as a percentage of total CD4+ TH cells (N=8-9), F, CD206+ M2 polarized macrophages measured as a percentage of total stromal macrophages (N=5-6). Data representative of 2 (D, E) or 3 (F) independent experiments. For D-F, error bars indicate SD; P-values determined by the Student t test (two-tailed, unpaired). G. Immunohistochemical (IHC) detection of CD8+ Tc cells on sections of scr-sh and IL-1β-sh KRasG12D-PDEC grafts in WT mice, 2 weeks post-orthotopic implantation. Representative images are shown. Graph depicts quantification of IHC, indicating the average percentage of CD8+ cells per field of view (FOV) of the implant (4-6 10X FOV per animal, N=5). Error bars indicate SD; P-values determined by the Student t test (two-tailed, unpaired). Data representative of 2 independent experiments. H-I. Representative flow cytometry plots and quantification (graph, right) from orthotopic pancreatic grafts of scr-sh or IL-1β-sh KRasG12D-PDEC in WT mice 2 weeks post-implantation analyzing activated cytotoxic CD8+ T cells (Tc) as measured by H, IFNγ and I, Granzyme B (GzmB) expression. Quantification of IFNγ+ and GzmB+ cells is represented as a percentage of total CD8+ Tc cells (N=5-7). Error bars indicate SD; P-values determined by the Student t test (two-tailed, unpaired). Data representative of 2 independent experiments. *p < 0.05; **p < 0.01; ***p < 0.001; ****p < 0.0001.
Figure 3.
Figure 3.. Tumor cell-derived IL-1β regulates pancreatic stellate cell activation and inflammatory functions.
A. Immunohistochemical detection of α-SMA and vimentin expression on sections of scr-sh and IL-1β-sh KRasG12D-PDEC grafts in WT mice, 2 weeks post-orthotopic implantation (N=7). Representative images are shown. B. Immunofluorescence detection of α-SMA expression on sections of scr-sh and IL-1β-sh KPC tumors in WT mice, 4 weeks post-orthotopic implantation (N=10; CK8, red; α-SMA, green; DAPI blue). Representative images are shown. C. Levels of cytokine mRNA in CD140a+ CAFs sorted from scr-sh or IL-1β-sh KRasG12D-PDEC grafts in WT mice, 2 weeks post-orthotopic implantation (N=9) analyzed by quantitative PCR. Results show mean ± SD of three biological replicates, each with 3 technical replicates. P-values determined by Student t test (two-tailed, unpaired). D. Immunofluorescence detection of α-SMA expression on sections of orthotopic pancreatic grafts of scr-sh, IL-1β-sh KRasG12D-PDEC and IL-1β-sh KRasG12D-PDEC co-implanted with CAFs in WT mice, 2 weeks post-implantation (N=7; CK8, red; α-SMA, green; DAPI, blue). Representative images are shown. E-G. Representative flow cytometry plots (left) and quantification (graph, right) from orthotopic pancreatic grafts 2 weeks after implantation of scr-sh, IL-1β-sh KRasG12D-PDEC and IL-1β-sh KRasG12D-PDEC co-implanted with CAFs of E, CD11b+F4/80+ macrophages measured as a percentage of total CD45+ cells (N=7), F, CD206+ M2 polarized macrophages measured as a percentage of total stromal macrophages (N=7), G, activated cytotoxic CD8+ T cells measured by IFNγ+ cells as a percentage of total CD8+ Tc cells (N=7). For E-G, error bars indicate SD; P-values determined by the Student t test (two-tailed, unpaired). Data representative of 2 independent experiments. H. Immunohistochemical (IHC) detection of CD8+ T cells on sections of pancreatic grafts of scr-sh, IL-1β-sh KRasG12D-PDEC and IL-1β-sh KRasG12D-PDEC co-implanted CAFs, 2 weeks post-orthotopic implantation (N=7). Representative images are shown. Graph depicts quantification of IHC, indicating the average percentage of CD8+ cells per FOV of the implant (4-6 10X FOV per animal, N=7). Error bars indicate SD; P-values determined by the Student t test (two-tailed, unpaired). Data representative of 2 independent experiments. *p < 0.05; **p < 0.01; ***p < 0.001; ****p < 0.0001; NS, not significant.
Figure 4.
Figure 4.. IL-1β neutralization sensitizes PDA tumors to PD-1 checkpoint blockade.
A. Schematic of anti-CD8 antibody treatment regimen. Anti-CD8 or control IgG antibody (red arrow) was administered every day for three days prior to orthotopic implantation of KrasG12D-PDECs, and then every five days hence. B. Graph depicts quantification of immunohistochemical analysis of CK8 staining on sections of orthotopic pancreatic grafts 2 weeks post-implantation of scr-sh or IL-1β-sh KRasG12D-PDEC and indicates percentage of CK8+ signal per lesion (N=8). Error bars indicate SD; P-values determined by the Student t test (two-tailed, unpaired). Data representative of 2 independent experiments. C. Schematic of anti-IL-1β and anti-PD-1 antibody treatment regimen. Treatment was initiated one week post orthotopic implantation of KPC cells. Green and red arrows indicate anti-PD-1 and anti-IL-1β antibody administration, respectively. D. Graph represents quantification of analysis in C, indicating tumor weight (N=8). Error bars indicate SD; P-values determined by the Student t test (two-tailed, unpaired). Data representative of 2 independent experiments. E. Representative flow cytometry plots (left) of KPC tumors treated with vehicle control, anti-PD-1 antibody alone, anti-IL-1β antibody alone or both anti-PD-1 and anti-IL-1β antibody, indicating tumor infiltrating CD8+ T cells. Graphs depict quantitation of FACS analysis, represented as either percentage of CD45+ immune cells (top right, N=8) or absolute number of CD8+ T cells relative to tumor weight (bottom right, N=7). Error bars indicate SD; P-values determined by the Student t test (two-tailed, unpaired). Data representative of 2 independent experiments. *p < 0.05; **p < 0.01; ***p < 0.001; ****p < 0.0001.
Figure 5.
Figure 5.. pro-IL-1β processing in pancreatic tumor cells is regulated by the NLRP3 inflammasome.
A-B. Immunohistochemical detection on sections of 2-4-month-old KC mouse pancreata of A, NLRP3 expression (N=8) and B, cleaved caspase-1 expression (N=8). Insets show respective isotype controls. Representative images are shown. C. Immunofluorescence detection of NLRP3 and phospho-ASC (Y144) co-localization in a 2-month-old KPC mouse pancreas (N=8; NLRP3 red, p-Asc green, DAPI blue). Representative image is shown. D. Immunofluorescence detection of NLRP3 and phospho-Asc (Y144) co-localization on a section of human PDA tissue (N=8; NLRP3 red, p-Asc green, DAPI blue). Representative image is shown. 36 ±3.42 % ductal epithelium co-stained positively for NLRP3 and phospho-Asc, as measured using Image J (3-5 FOV/sample, N=8). E. Immunohistochemical detection of NLRP3 and cleaved caspase-1 expression on sections of orthotopic pancreatic grafts 2 weeks post-implantation of KRasG12D-PDEC expressing scramble shRNA (scr-sh) control or NLRP3 shRNA (NLRP3-sh) in WT mice (N=6). Representative images are shown. F. ELISA analysis for assessing IL-1β protein production in scr-sh or NLRP3-sh KRasG12D-PDEC in orthotopic pancreatic grafts 2 weeks post-implantation in WT mice (N=4). P-values determined by the Student t test (two-tailed, unpaired). Data representative of 2 independent experiments. G. Graph depicts quantification of immunofluorescence detection of IL-1β on orthotopic pancreatic graft sections, 2 weeks post-implantation of scr-sh or NLRP3-sh KRasG12D-PDEC in WT mice. Represented as percentage of IL-1β positive epithelium per FOV of the implant (4-6 FOV per animal, N=8). Error bars indicate SD; P-values determined by the Student t test (two-tailed, unpaired). Data representative of 2 independent experiments. H. Graph depicts quantification of immunohistochemical analysis of CK8 staining on sections of orthotopic pancreatic grafts 2 weeks post-implantation of scr-sh or NLRP3-sh KRasG12D-PDEC and indicates percentage of CK8+ signal per lesion (N=8). Error bars indicate SD; P-values determined by the Student t test (two-tailed, unpaired). Data representative of 2 independent experiments. I. Representative tumors 4 weeks after orthotopic implantation of KPC cells expressing scrambled shRNA (scr-sh) or NLRP3 shRNA (NLRP3-sh) in pancreata of WT mice. J. Graph represents quantification of I, indicating tumor volume (N=7). Error bars indicate SD; P-values determined by the Student t test (two-tailed, unpaired). Data representative of 2 independent experiments. K. Kaplan Meier curve for survival analysis of mice bearing orthotopically implanted pancreatic tumors derived from scr-sh or NLRP3-sh KPC cells (N=7). P-values determined by the Student t test (two-tailed, unpaired). Data representative of 2 independent experiments. **p < 0.01; ***p < 0.001; ****p < 0.0001.
Figure 6.
Figure 6.. The pancreatic microbiome drives IL-1β expression in tumor cells through TLR4 signaling.
A. mRNA transcript level of TLR4 in PDA compared to normal adjacent tissue from publicly available human transcriptomic data (74 patients: n=50 PDA and n=24 adjacent normal). Each data point indicates an individual tissue sample. Error bars indicate SD; P-values determined by the Student t test (two-tailed, unpaired). B. Immunohistochemical detection of TLR4 expression on a section from human PDA tissue (n=8 patient samples). Representative image is shown. 67 ± 8.94 % ductal epithelium co-stained positively for TLR4, as measured using Image J (3-5 FOV/sample, N=8). C. Immunohistochemical detection of TLR4 expression on a section from a 4-month-old KC mouse pancreas (N=8). Representative image is shown. D. Immunofluorescence detection of IL-1β expression on sections of orthotopic pancreatic grafts 2 weeks post-implantation of KRasG12D-PDEC expressing scramble shRNA (scr-sh) control or TLR4 shRNA (TLR4-sh) in WT mice (N=7; CK8, red; IL-1β, green; DAPI, blue). Representative images are shown. E. Graph depicts quantification of data in D, represented as a percentage of IL-1β positive epithelium per FOV of the implant (4-6 FOV per animal, N=7). Error bars indicate SD; P-values determined by the Student t test (two-tailed, unpaired). Data representative of 2 independent experiments. F. Graph depicts quantification of immunohistochemical analysis of CK8 staining on sections of orthotopic pancreatic grafts 2 weeks post-implantation of scr-sh or TLR4-sh KRasG12D-PDEC, and indicates percentage of CK8+ signal per lesion (N=7). Error bars indicate SD; P-values determined by the Student t test (two-tailed, unpaired). Data representative of 2 independent experiments. G. Representative tumors 4 weeks after orthotopic implantation of KPC cells expressing scr-sh or TLR4-sh in pancreata of WT mice. H. Graph represents quantification of G indicating tumor volume (N=8). Error bars indicate SD; P-values determined by the Student t test (two-tailed, unpaired). Data representative of 2 independent experiments. I. Kaplan Meier curve for survival analysis of mice bearing pancreatic tumors derived from orthotopically implanted scr-sh or TLR4-sh KPC cells (N=7). P-values determined by the Student t test (two-tailed, unpaired). Data representative of 2 independent experiments. J. Immunofluorescence analysis of IL-1β expression on sections of orthotopic pancreatic grafts 2 weeks post-implantation of KRasG12D-PDEC in WT mice treated with vehicle control or antibiotic cocktail (N=7; CK8 red, IL-1β green, DAPI blue). Representative images are shown. K. Graph depicts quantification of data in J, represented as a percentage of IL-1β-positive epithelium per FOV of the implant (4-6 FOV per animal, N=7). Error bars indicate SD; P-values determined by the Student t test (two-tailed, unpaired). ***p < 0.001; ****p < 0.0001.

References

    1. Simoes PK, Olson SH, Saldia A, Kurtz RC. Epidemiology of pancreatic adenocarcinoma. Chin Clin Oncol 2017;6:24. - PubMed
    1. Von Hoff DD, Ervin T, Arena FP, Chiorean EG, Infante J, Moore M, et al. Increased survival in pancreatic cancer with nab-paclitaxel plus gemcitabine. N Engl J Med 2013;369:1691–703. - PMC - PubMed
    1. Johnson BA 3rd, Yarchoan M, Lee V, Laheru DA, Jaffee EM. Strategies for Increasing Pancreatic Tumor Immunogenicity. Clin Cancer Res 2017;23:1656–69. - PMC - PubMed
    1. Cullis J, Das S, Bar-Sagi D. Kras and Tumor Immunity: Friend or Foe? Cold Spring Harb Perspect Med 2018;8 - PMC - PubMed
    1. Padoan A, Plebani M, Basso D. Inflammation and Pancreatic Cancer: Focus on Metabolism, Cytokines, and Immunity. Int J Mol Sci 2019;20 - PMC - PubMed

Publication types

MeSH terms