. 2020 Mar;10(3):440-459.
doi: 10.1158/2159-8290.CD-19-0116. Epub 2020 Jan 8.

Selective Inhibition of HDAC3 Targets Synthetic Vulnerabilities and Activates Immune Surveillance in Lymphoma

Affiliations

Selective Inhibition of HDAC3 Targets Synthetic Vulnerabilities and Activates Immune Surveillance in Lymphoma

Patrizia Mondello et al. Cancer Discov. 2020 Mar.

Abstract

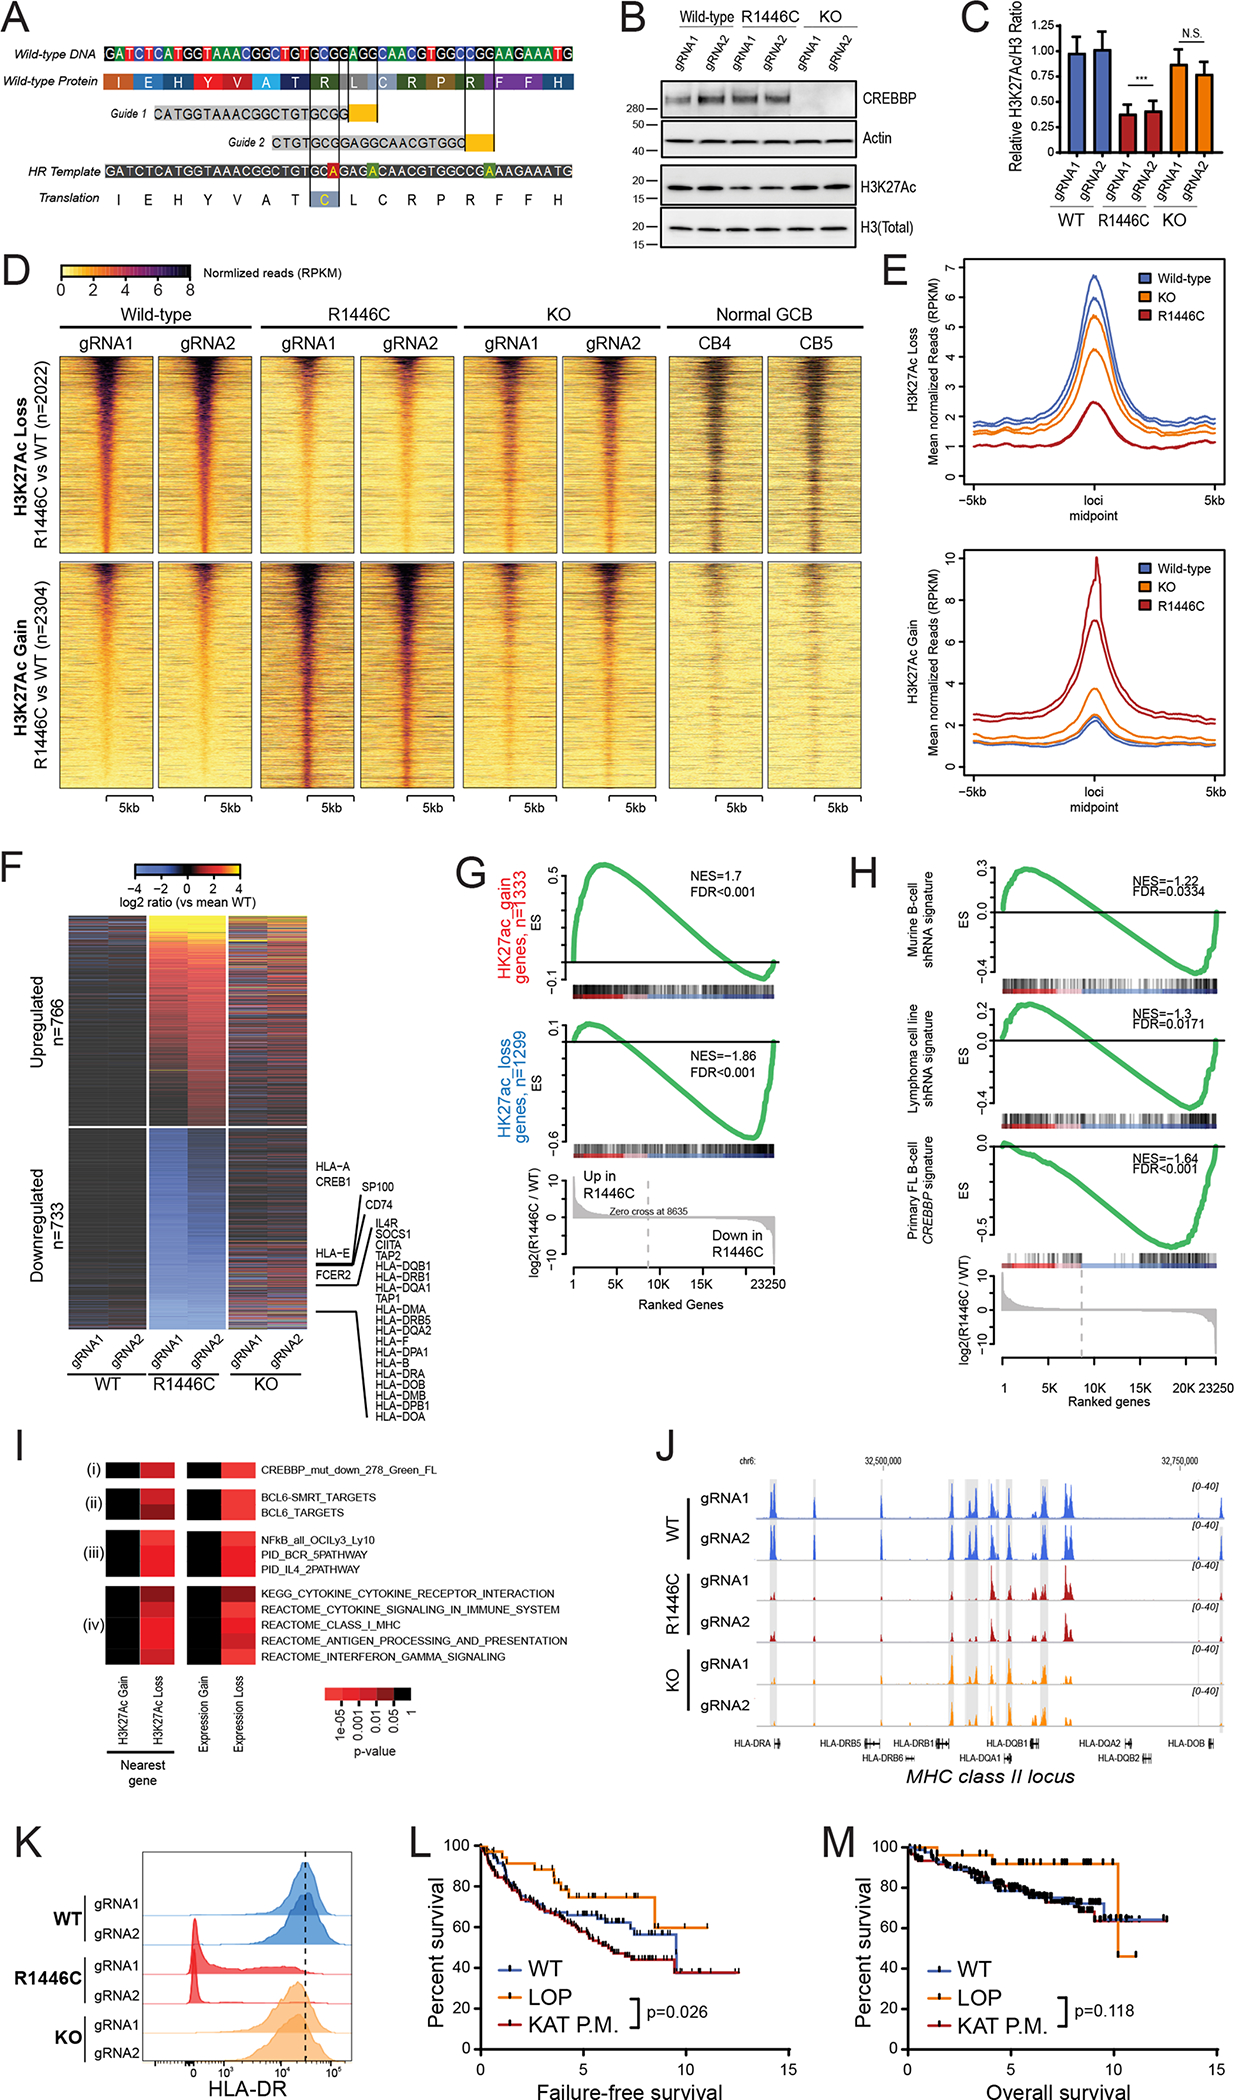
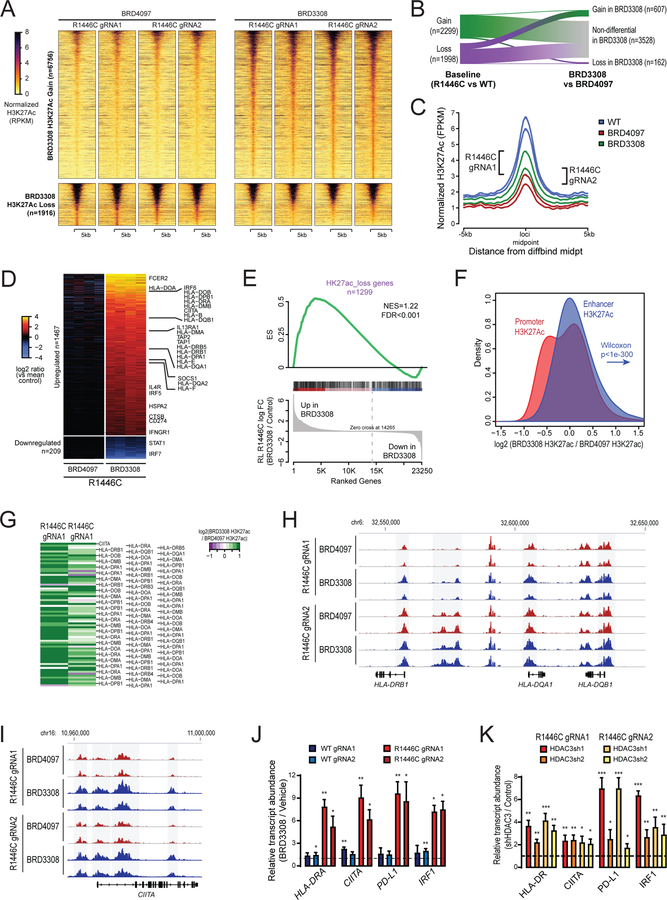
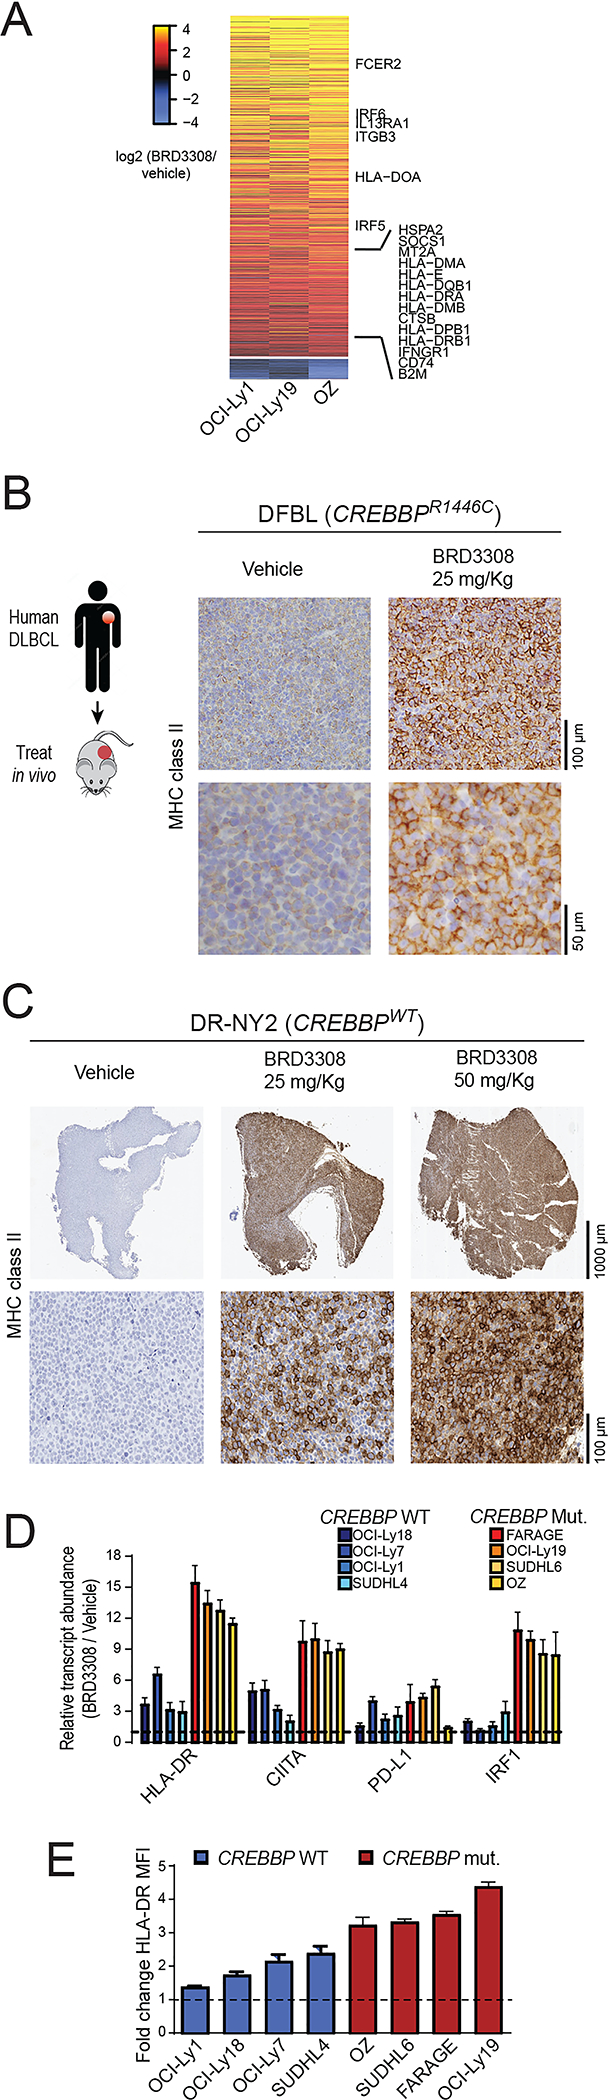
CREBBP mutations are highly recurrent in B-cell lymphomas and either inactivate its histone acetyltransferase (HAT) domain or truncate the protein. Herein, we show that these two classes of mutations yield different degrees of disruption of the epigenome, with HAT mutations being more severe and associated with inferior clinical outcome. Genes perturbed by CREBBP mutation are direct targets of the BCL6-HDAC3 onco-repressor complex. Accordingly, we show that HDAC3-selective inhibitors reverse CREBBP-mutant aberrant epigenetic programming, resulting in: (i) growth inhibition of lymphoma cells through induction of BCL6 target genes such as CDKN1A and (ii) restoration of immune surveillance due to induction of BCL6-repressed IFN pathway and antigen-presenting genes. By reactivating these genes, exposure to HDAC3 inhibitors restored the ability of tumor-infiltrating lymphocytes to kill DLBCL cells in an MHC class I and II-dependent manner, and synergized with PD-L1 blockade in a syngeneic model in vivo. Hence, HDAC3 inhibition represents a novel mechanism-based immune epigenetic therapy for CREBBP-mutant lymphomas. SIGNIFICANCE: We have leveraged the molecular characterization of different types of CREBBP mutations to define a rational approach for targeting these mutations through selective inhibition of HDAC3. This represents an attractive therapeutic avenue for targeting synthetic vulnerabilities in CREBBP-mutant cells in tandem with promoting antitumor immunity.This article is highlighted in the In This Issue feature, p. 327.


Conflict of interest statement

Conflicts of Interest: DAS is a consultant to, and/or has equity in: Eureka, SLS, KLUS, IOVA, PFE, Oncopep. LN receives research support from Celgene, Genentech, Janssen, Karus, Merck, TG Therapeutics and honorarium from Bayer, Celgene, Genentech, Gilead/KITE, Janssen, Juno, Novartis, TG Therapeutics. AY is a consultant to: Bayer, Incyte, Janssen, Merck, Genentech and receives research support from Novartis, J&J, Curis, Roche and BMS. AD receives personal fees from Roche, Corvus Pharmaceuticals, Physicians’ Education Resource, Seattle Genetics, Peerview Institute, Oncology Specialty Group, Pharmacyclics, Celgene, and Novartis and research funding from Roche. SSN reports personal fees and research support from Kite, Merck, and Celgene, research support from Bristol-Myers Squibb, Poseida, Cellectis, Karus, Acerta Pharma, and Unum Therapeutics, and personal fees from Novartis, Pfizer, Unum Therapeutics, Pfizer, Precision Biosciences, Cell Medica, Allogene, Incyte, and Legend Biotech. J.B. is an employee of AstraZeneca, is on the Board of Directors of Foghorn and is a past board member of Varian Medical Systems, Bristol‐Myers Squibb, Grail, Aura Biosciences, and Infinity Pharmaceuticals. J.B. also has performed consulting and/or advisory work for Grail, PMV Pharma, ApoGen, Juno, Lilly, Seragon, Novartis, and Northern Biologics, and he has stock or other ownership interests in PMV Pharma, Grail, Juno, Varian, Foghorn, Aura, Infinity Pharmaceuticals, ApoGen, as well as Tango and Venthera, of which is a co‐founder. He has previously received honoraria or travel expenses from Roche, Novartis, and Eli Lilly. AMM receives research funding from Janssen and Daiichi SAnkyo, is a consultant for Epizyme and Constellation, and is an advisory board member for KDAc Therapeutics. MRG is a consultant to VeraStem Oncology and has stock ownership interest in KDAc Therapeutics.

Figures

Figure 1:
Figure 1:. Detailed molecular characterization of CREBBPR1446C and CREBBPKO mutations using isogenic CRISPR/Cas9-modified lymphoma cells.
A) A diagram shows the CRISPR/Cas9 gene editing strategy. Two guides were designed that were proximal to the R1446 codon, with PAM sites highlighted in yellow. A single stranded Homologous Recombination (HR) template was utilized that encoded silent single nucleotide changes that interfered with the PAM sites but did not change the protein coding sequence, and an additional single nucleotide change that encoded the R1446C mutation. B) A representative western blot shows that the CREBBPR1446C protein is expressed at similar levels to that of wild-type CREBBP, whereas CREBBPKO results in a complete loss of protein expression as expected. The level of H3K27Ac shows a more visible reduction in CREBBPR1446C cells compared to isogenic CREBBPWT cells than that observed in CREBBPKO cells. C) Quantification of triplicate western blot experiments shows that there is a significant reduction of H3K27Ac in CREBBPR1446C cells compared to CREBBPWT cells (T-test p-value <0.001). A reduction is also observed in CREBBPKO cells, but this was not statistically significant (T-test p-value = 0.106). D) Heat maps show the regions of significant H3K27Ac loss (n=2022, above) and gain (n=2304, below) in CREBBPR1446C cells compared to isogenic WT controls. The regions with reduced H3K27Ac in CREBBPR1446C cells can be seen to normally bear this mark in GCB cells. E) Density plots show that the degree of H3K27Ac loss (above) is most notable in CREBBPR1446C cells compared to isogenic WT cells, while CREBBPKO cells show an intermediate level of loss. Regions with H3K27Ac gain (below) in CREBBPR1446C cells showed fewer changes in CREBBPKO cells. F) A heat map of RNA-seq data shows that there are a similar number of genes with increased (n=766) and decreased (n=733) expression in CREBBPR1446C cells compared to isogenic WT controls. The CREBBPKO cells again show an intermediate level of change, with expression between that of CREBBPWT and CREBBPR1446C cells. G) Gene set enrichment analysis of the genes most closely associated with regions of H3K27Ac gain (above) or loss (below) shows that these epigenetic changes are significantly associated with coordinately increased or decreased expression in CREBBPR144C cells compared to isogenic WT controls, respectively. H) Gene set enrichment analysis shows that genes which were previously found to be down-regulated following shRNA-mediated knock-down of CREBBP in murine B-cells (top) or human lymphoma cell lines (middle) are also reduced in CREBBPR1446C mutant cells compared to CREBBPWT cells. However, the most significant enrichment was observed for the signature of genes that we found to be significantly reduced in primary human FL with CREBBP mutation compared to CREBBP wild-type tumors. I) Hypergeometric enrichment analysis identified sets of genes that were significantly over-represented in those with altered H3K27Ac or expression in CREBBPR1446C cells. This included (i) gene sets associated with CREBBP mutation in primary tumors, (ii) BCL6 target genes, (iii) BCR and IL4 signaling pathways, and (iv) gene sets involving immune responses, antigen presentation and interferon signaling were significantly enriched. J) ChIP-seq tracks of the MHC class II locus on chromosome 6 are shown for isogenic CREBBPWT (blue), CREBBPR1446C (red) and CREBBPKO (orange) cells with regions of significant H3K27Ac loss shaded in grey. A significant reduction can be observed between CREBBPWT and CREBBPR1446C cells, with CREBBPKO cells harboring an intermediate level H3K27Ac over these loci. K) Flow cytometry for HLA-DR shows that reduced H3K27Ac over the MHC class II region is associated with changes of cell surface protein expression. A ~2-fold reduction is observed in CREBBPKO cell compared to CREBBPWT, but a dramatic ~39-fold reduction is observed in CREBBPR1446C cells. L) Kaplan-Meier plots show the failure free survival in 231 previously untreated FL patients according to their CREBBP mutation status. Nonsense/frameshift mutations that create a loss-of-protein (LOP) are associated with a significantly better failure-free survival compared to KAT domain point mutations (KAT P.M.; log-rank P=0.026). M) Kaplan-Meier plots show the overall survival in 231 previously untreated FL patients according to their CREBBP mutation status. Patients with LOP mutations have a trend towards better overall survival, but this is not statistically significant (log-rank P=0.118).
Figure 2:
Figure 2:. Synthetic dependence upon BCL6 and HDAC3 in CREBBP mutant cells.
A) A heat map shows that regions with reduced H3K27Ac in CREBBPR1446C cells compared to CREBBPWT cells (above) are bound by both CREBBP and BCL6 in normal germinal center B-cells. This binding is not observed over regions with increased H3K27Ac in mutant cells. B) Isogenic CREBBPR1446C and CREBBPKO cells have a greater sensitivity to BRD3308, a selective HDAC3 inhibitor, compared to CREBBPWT cells. C) Knock-down of HDAC3 with two unique shRNAs shows a similar preference towards limiting cell proliferation in CREBBPR1446C cells compared to WT. Data are shown relative to control shRNA in the same cell lines (*P<0.05, ***P<0.001). D) Representative western blots show a dose-dependent increase in H3K27Ac in both CREBBPWT and CREBBPR1446C cells treated with BRD3308, compared to the control compound BRD4097. E) ChIP-seq tracks of H3K27Ac show that CREBBPKO and CREBBPR1446C both have reduced levels over the CDKN1A locus compared to isogenic CREBBPWT cells. Regions that are statistically significant are shaded in grey. F) A representative western blot shows that CDKN1A is induced at the protein level by treatment with 10μM BRD3308 in both CREBBPWT and CREBBPR1446C cells. G) Knock-down of CDKN1A (p21) using two unique shRNAs partially rescued the proliferative arrest of cells treated with BRD3308. This rescue was more significant in CREBBP mutant cells compared to wild-type. Data are displayed relative to vehicle-treated cells (*P<0.05, **P<0.01, ***P<0.001). H) The difference in sensitivity to BRD3308 between CREBBP wild-type (blue) and CREBBP mutant (yellow to red) was validated in a large panel of DLBCL cell lines. I) The effective dose 50 (ED50) concentrations for each cell line from (H) are shown, colored by CREBBP mutation status. The ED50s for CREBBP mutant (red) cell lines was significantly lower than that observed for CREBBP wild-type cell lines (blue; T-test P=0.002). J) Gene set enrichment analysis of ‘Germinal Center Terminal Differentiation’ signature genes shows that these genes are coordinately induced in both CREBBP wild-type (above) and mutant (below) DLBCL cell lines by BRD3308 treatment compared to control.
Figure 3:
Figure 3:. BRD3308 is effective in primary DLBCL.
A) The sensitivity of primary DLBCL tumors to BRD3308 was evaluated by expanding them in vivo, followed by culture in our in vitro organoid model with different concentrations of BRD3308. A dose-dependent decrease in cell viability was observed in all 6 tumors with increasing concentrations of BRD3308. B) Treatment of 3 unique DLBCL xenograft models in vivo with 25mg/kg (green) or 50mg/kg (orange) of BRD3308 significantly reduced tumor growth compared to vehicle (black) (**P<0.01; ***P<0.001). C) Representative MRI images of renal capsule implanted PDX tumors from a CREBBPR1446C mutant DLBCL at the beginning (day 0) and day 14 of treatment. Tumor is outlined in yellow. D) Quantification of tumor volume by MRI images, normalized to the pre-treatment volume for the same tumor, shows that BRD3308 treatment significantly reduces tumor growth (*P<0.05, **P<0.01).
Figure 4:
Figure 4:. HDAC3 inhibition counteracts the molecular phenotype of CREBBP mutation.
A) A heat map shows the regions with significantly increased (above, n=6756) or decreased (below, n=1916) H3K27Ac in CREBBPR1446C cells treated with BRD3308 compared to those treated with the control compound, BRD4097. Experimental duplicates are shown for each clone. B) A river plot show that a large fraction of the regions with significantly reduced H3K27Ac in CREBBPR1446C cells compared to CREBBPWT cells had significantly increased H3K27Ac following BRD3308 treatment. C) A density plot shows the regions with reduced H3K27Ac in CREBBPR1446C compared to CREBBPWT cells. The level of H3K27Ac over these regions is increased in CREBBPR1446C cells treated with BRD3308 compared to control (BRD4097), but does not reach the level observed in CREBBPWT cells. D) A heat map shows the genes with increased (above, n=1467) or decreased expression (below, n=209) following BRD3308 treatment. Duplicate experiments are shown for each of the two CREBBPR1446C clones. Interferon-responsive genes, including those with a role in antigen processing and presentation, can be observed to increase in expression following BRD3308 treatment. E) Gene set enrichment analysis shows that the set of genes with reduced H3K27Ac in association with CREBBP mutation has coordinately increased expression following BRD3308 treatment. F) A density plot illustrates the relative change in promoter (red) and enhancer (blue) H3K27Ac following treatment with BRD3308, with the enhancer distribution being significantly more right-shifted (increased) compared to promoter regions. G) A heat map shows the change in H3K27Ac at the promoter regions of MHC class II genes following BRD3308 treatment of CREBBPR1446C cells, showing a coordinate increase. H-I) Regions with significantly increased H3K27Ac (shaded in grey) included those within the MHC class II and CIITA gene loci. J) The increased expression of candidate genes within the interferon signaling and antigen presentation pathways was confirmed by qPCR. Increased expression was observed in both CREBBPWT and CREBBPR1446C cells following BRD3308 treatment, but the level of induction was much higher in CREBBPR1446C cells. Data are shown relative to vehicle treated cells (T-test *P<0.05, **P<0.01, ***P<0.001). K) The on-target role of HDAC3 in the induction of candidate genes was confirmed by shRNA-mediated knock-down of HDAC3 and qPCR analysis of gene expression. Knock-down of HDAC3 was able to induce the expression of all genes, which is shown relative the control shRNA (T-test *P<0.05, **P<0.01, ***P<0.001).
Figure 5:
Figure 5:. HDAC3 inhibition induces interferon signaling and antigen presentation in both CREBBP wild-type and mutant cells.
A) Flow cytometry was performed for HLA-DR following exposure to a selection of HDAC inhibitors at 10μM for 72h. This shows that HDAC inhibitors with a range specificities are able to induce MHC class II, but HDAC3 selective inhibition using BRD3308 is sufficient for this effect. B) Dose titrations of histone deacetylase inhibitors from (A) with peripheral blood CD4 and CD8 T-cells from healthy donors. C) A heat map of interferon responsive and antigen presentation genes from RNA-seq data shows an increased expression in both CREBBPWT and CREBBPR1446C cells. Data represent duplicate experiments for each clone and are normalized to control treated cells from the same experiment. D) Gene set enrichment analysis of the genes that have reduced H3K27Ac in CREBBPR1446C cells shows that the expression of these same genes are coordinately increased by BRD3308 treatment in CREBBPWT cells. E) A heat map of hypergeometric enrichment analysis results of RNA-seq data shows that BRD3308 induces the induction of similar gene sets in both CREBBPWT and CREBBPR1446C cells. F) A density strip plot, normalized to the mean expression in control (BRD4097)-treated CREBBPWT cells shows the relative expression of the set of genes with reduced H3K27Ac in CREBBPR1446C cells. This shows that these genes are induced by BRD3308 in CREBBPWT cells, resulting in expression levels greater than baseline. Further, CREBBPR1446C cells can be observed to start below baseline, with the induction by BRD3308 resulting in expression levels similar to that observed in control treated CREBBPWT cells. The 4 samples per condition represent duplicate experiments in each of the two clones for each genotype. G) The firefly luciferase luminescence of two unique IRF1 reporters (R1 and R2) is shown, normalized to renilla luciferase from a control vector and shown as fold change compared to untreated cells. CREBBPWT cells show increased IRF1 activity following IFN-γ treatment (positive control; grey), but not following treatment with BRD3308 (green). In contrast, CREBBPR1446C cells show increased IRF1 activity following BRD3308 treatment, to a level that is similar to that observed with IFN-γ treatment. (T-test vs control-treated cells, **P<0.01, ***P<0.001). H) The role of IFN-γ in inducing MHC class II expression following BRD3308 in CREBBPR1446C cells was assessed with a blocking experiment. Blocking IFN-γ with a neutralizing antibody (αIFN-γ) significantly reduced the induction of MHC class II, as measured by flow cytometry for HLA-DR, but the induction by BRD3308 with α IFN-γ remained significantly higher than vehicle with αIFN-γ (T-test, ***P<0.001).
Figure 6:
Figure 6:. Induction of interferon-responsive and antigen presentation genes in DLBCL cell lines and patient-derived xenograft.
A) A heat map shows significantly up-regulated (above) and down-regulated (below) genes in BRD3308-treated DLBCL cell lines that are CREBBP wild-type (OCI-Ly1) or mutant (OCI-Ly19 and OZ), expressed as a log2 ratio to vehicle control treated cells. The observed changes were consistent between wild-type and mutant cell lines, and included up-regulation of interferon-responsive and antigen presentation genes. B) MHC class II was assessed on vehicle control (left) and BRD3308 treated (25mg/kg, right) tumors from a CREBBP R1446C mutant PDX model, showing a visible increase in expression in the BRD3308-treated tumors. These images are representative of 4 tumors per group. C) An MHC class II-negative DLBCL patient derived xenograft model was treated in vivo with either 25mg/kg or 50mg/kg of BRD3308. Immunohistochemical staining was performed for MHC class II, revealing a robust induction of MHC class II expression that was relative to the dose of treatment. These images are representative of 6 tumors per group. D) qPCR was used to validate the gene expression changes of select interferon-responsive genes following BRD3308 treatment across an extended panel of CREBBP wild-type and mutant DLBCL cell lines. These genes were uniformly increased in both genetic contexts, but with a higher magnitude of increase in CREBBP mutant cell lines. One-tailed Students T-test *P<0.05, **P<0.01, **P<0.001. E) The induction of MHC class II expression by BRD3308 was measured in an extended panel of DLBCL cell lines by flow cytometry. Data are plotted as a fold-change of the mean fluorescence intensity (MFI) of HLA-DR in BRD3308-treated vs control-treated cells. We observed uniformly increased MHC class II expression in all cell lines, but with higher magnitude in CREBBP mutants.
Figure 7:
Figure 7:. HDAC3 inhibition induces antigen-dependent immune responses.
A) A schematic of the generation of antigen-specific T-cells and epigenetic priming of DLBCL cells. A human DLBCL cell line (OCI-Ly18) was engrafted into immunodeficient mice and allowed to establish. Human T-cells were then engrafted, exposing them to tumor antigens prior to harvesting of the tumor-infiltrating T-cell (TIL) fraction. These TILs were cultured with fresh DLBCL cells that had been epigenetically primed with different concentrations of BRD3308, and the cell viability of the DLBCL cells measured after 72h. B) TIL and DLBCL co-culture resulted in activation of the CD4 T-cells in a dose-dependent manner, as measured by flow cytometry for the CD69 activation marker. Data represent the fold change in CD69 expression compared to vehicle treated DLBCL cells (T-test vs DMSO control, *P<0.05). C) The cell viability of DLBCL cells in TIL co-culture experiments was measured by CellTiterBlue assay. Treatment with BRD3308 resulted in some cell killing through cell-intrinsic mechanisms in the absence of TILs (black). The addition of TILs at a 1:1 ratio led to a significant increase in cell death of the DLBCL cells. This was partially reduced by blocking of either MHC class I or MHC class II using neutralizing antibodies. Blocking of MHC class I and class II together completely eliminated the TIL-associated increase in cell death, suggesting that killing was mediated through MHC:TCR interactions. (T-test, *P<0.05, ***P<0.001) D) The production of IFN-γ was measured by ELISPOT and found to increase in cultures with epigenetically-primed DLBCL cells. (T-test vs DMSO control, **P<0.01, ***P<0.001) E) A syngeneic BCL6-dependent lymphoma model for in vivo testing of BRD3308 and PD-L1 blocking antibodies. Splenocytes were taken from Ezh2Y641 x IμBcl6 mice and injected into irradiated wild-type recipients that were treated upon the onset of lymphoma. F) Serum IFN-γ levels measured in mice following treatment. G-N) Representative immunofluorescence images of mouse spleens following treatment and quantification of mean fluorescence intensities from multiple mice for CD8 (G, H), CD4 (I, J), PD-L1 (K, L) and B220 (M, N), showing increased T-cell infiltration following treatment with BRD3308 and cooperation with αPD-L1 in eliminating B220+ tumor cells within the spleen. (T-test; *P<0.05, **P<0.01, ***P<0.001)

References

    1. Hatzi K & Melnick A Breaking bad in the germinal center: how deregulation of BCL6 contributes to lymphomagenesis. Trends Mol Med 20, 343–352, doi:10.1016/j.molmed.2014.03.001 (2014). - DOI - PMC - PubMed
    1. Mesin L, Ersching J & Victora GD Germinal Center B Cell Dynamics. Immunity 45, 471–482, doi:10.1016/j.immuni.2016.09.001 (2016). - DOI - PMC - PubMed
    1. Hatzi K et al. A hybrid mechanism of action for BCL6 in B cells defined by formation of functionally distinct complexes at enhancers and promoters. Cell reports 4, 578–588, doi:10.1016/j.celrep.2013.06.016 (2013). - DOI - PMC - PubMed
    1. Hatzi K et al. Histone demethylase LSD1 is required for germinal center formation and BCL6-driven lymphomagenesis. Nature immunology 20, 86–96, doi:10.1038/s41590-018-0273-1 (2019). - DOI - PMC - PubMed
    1. Beguelin W et al. EZH2 and BCL6 Cooperate to Assemble CBX8-BCOR Complex to Repress Bivalent Promoters, Mediate Germinal Center Formation and Lymphomagenesis. Cancer cell 30, 197–213, doi:10.1016/j.ccell.2016.07.006 (2016). - DOI - PMC - PubMed

Publication types

MeSH terms