. 2020 Feb 14;295(7):2018-2033.
doi: 10.1074/jbc.RA119.010565. Epub 2020 Jan 8.

First characterization of glucose flux through the hexosamine biosynthesis pathway (HBP) in ex vivo mouse heart

Affiliations

First characterization of glucose flux through the hexosamine biosynthesis pathway (HBP) in ex vivo mouse heart

Aaron K Olson et al. J Biol Chem. .

Abstract

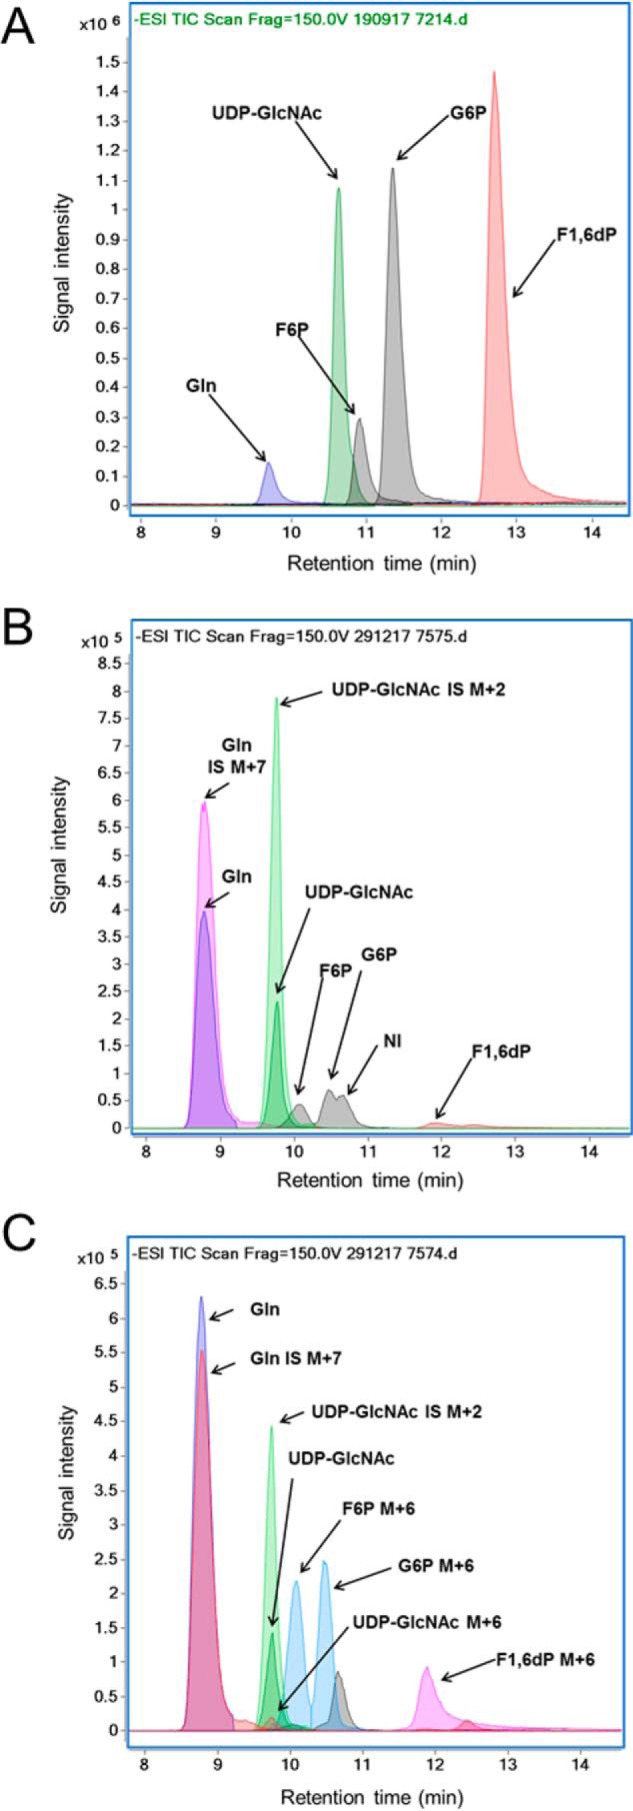
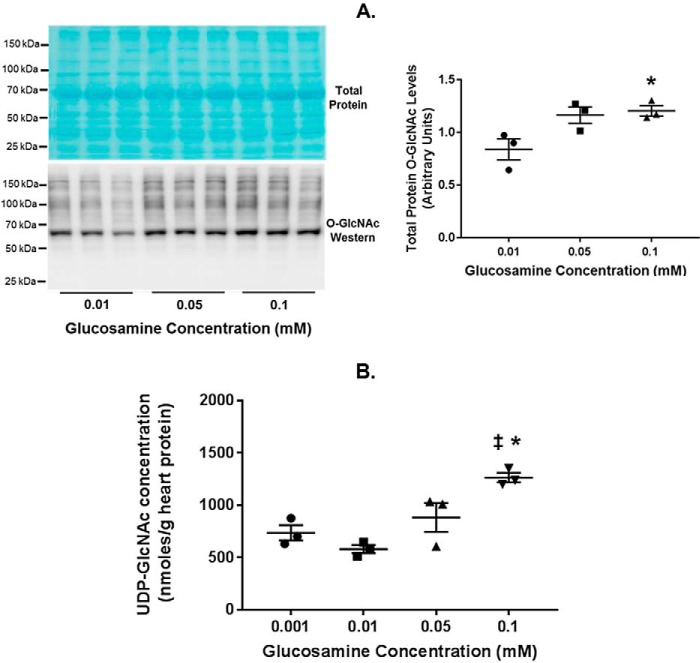
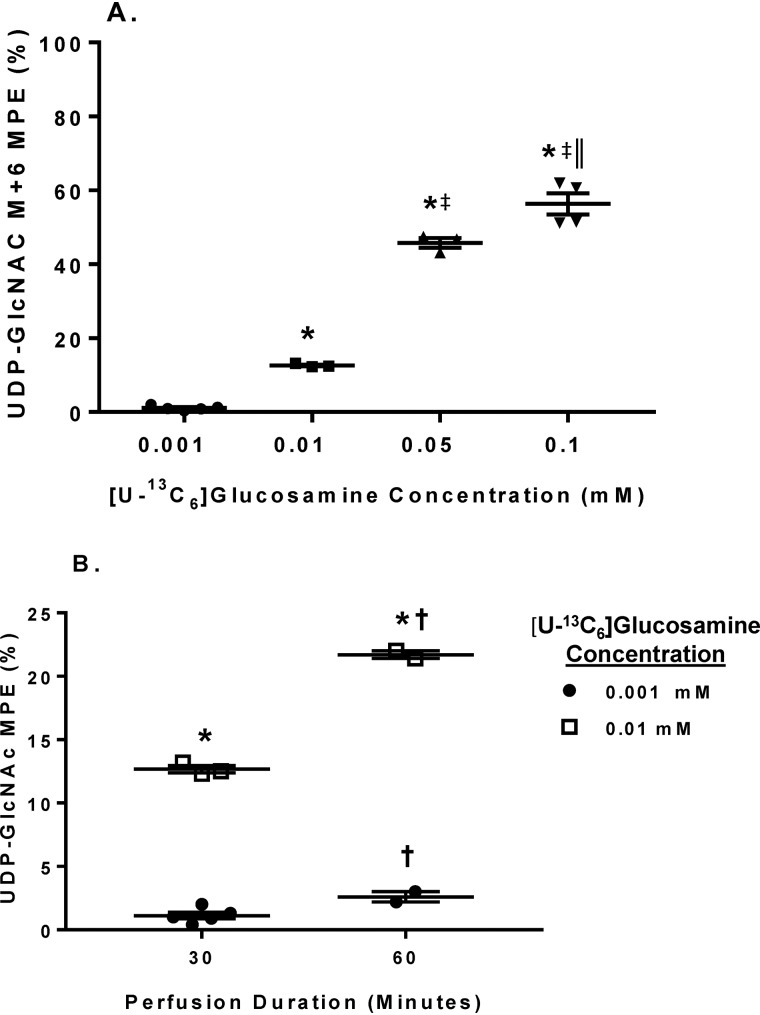
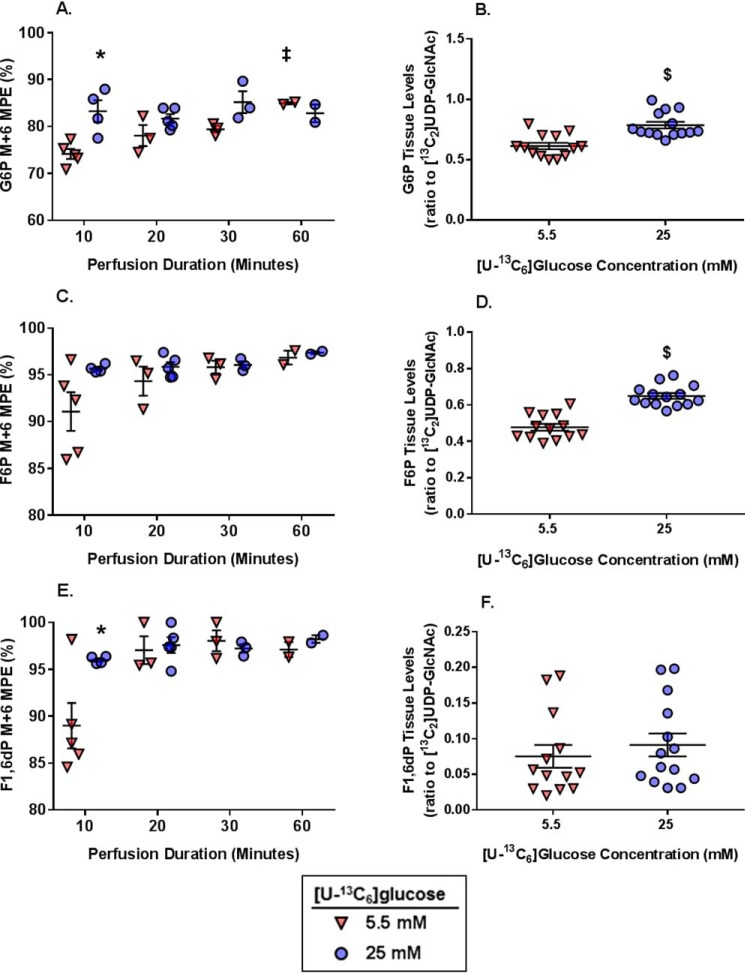
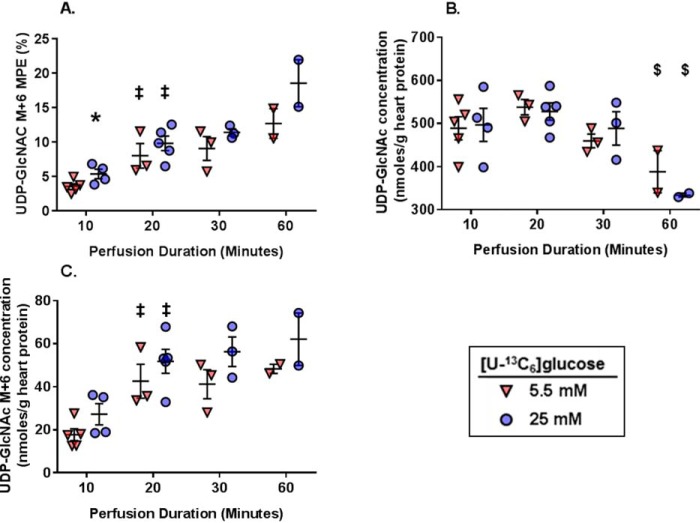
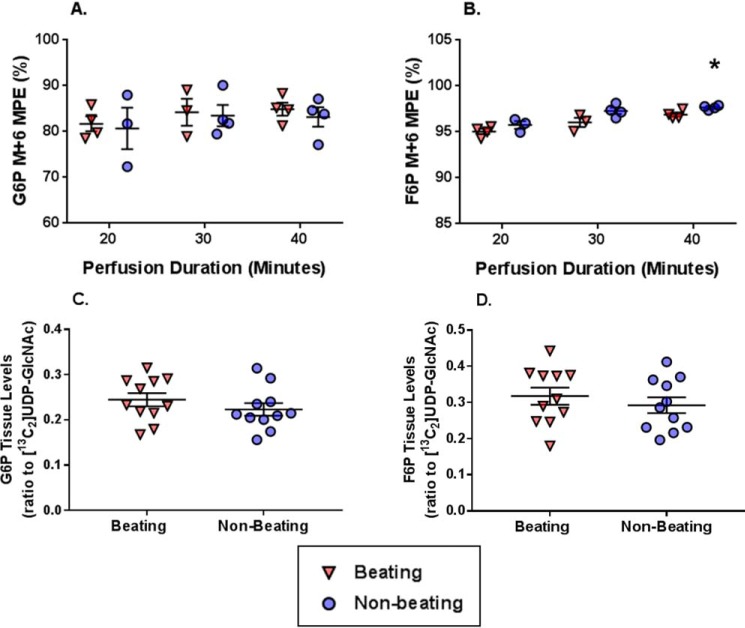
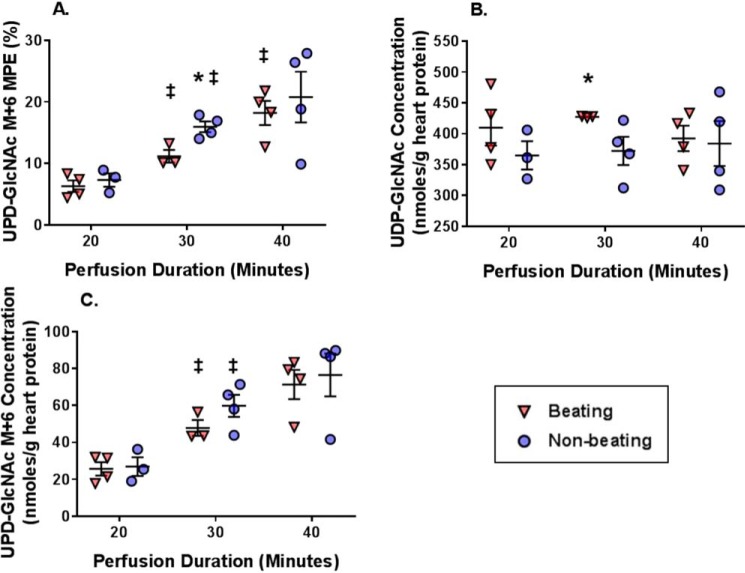
The hexosamine biosynthesis pathway (HBP) branches from glycolysis and forms UDP-GlcNAc, the moiety for O-linked β-GlcNAc (O-GlcNAc) post-translational modifications. An inability to directly measure HBP flux has hindered our understanding of the factors regulating protein O-GlcNAcylation. Our goals in this study were to (i) validate a LC-MS method that assesses HBP flux as UDP-GlcNAc (13C)-molar percent enrichment (MPE) and concentration and (ii) determine whether glucose availability or workload regulate cardiac HBP flux. For (i), we perfused isolated murine working hearts with [U-13C6]glucosamine (1, 10, 50, or 100 μm), which bypasses the rate-limiting HBP enzyme. We observed a concentration-dependent increase in UDP-GlcNAc levels and MPE, with the latter reaching a plateau of 56.3 ± 2.9%. For (ii), we perfused isolated working hearts with [U-13C6]glucose (5.5 or 25 mm). Glycolytic efflux doubled with 25 mm [U-13C6]glucose; however, the calculated HBP flux was similar among the glucose concentrations at ∼2.5 nmol/g of heart protein/min, representing ∼0.003-0.006% of glycolysis. Reducing cardiac workload in beating and nonbeating Langendorff perfusions had no effect on the calculated HBP flux at ∼2.3 and 2.5 nmol/g of heart protein/min, respectively. To the best of our knowledge, this is the first direct measurement of glucose flux through the HBP in any organ. We anticipate that these methods will enable foundational analyses of the regulation of HBP flux and protein O-GlcNAcylation. Our results suggest that in the healthy ex vivo perfused heart, HBP flux does not respond to acute changes in glucose availability or cardiac workload.

Keywords: O-linked N-acetylglucosamine (O-GlcNAc); UDP-GlcNAc; carbohydrate metabolism; cardiac metabolism; glucosamine; glucose; glucose metabolism; hexosamine biosynthesis pathway; metabolic flux; post-translational modification (PTM); protein glycosylation.


Conflict of interest statement

The authors declare that they have no conflicts of interest with the contents of this article

Figures

Figure 1.
Figure 1.
Glycolysis and the HBP. This scheme shows important metabolic intermediates for these pathways. Intermediates shared between glycolysis and HBP are shown in black, HBP-only intermediates are shown in red, and glycolysis-only intermediates are shown in green. Glucose is initially metabolized to G6P in the first glycolytic step. F6P, the next glycolytic intermediate, can either enter the HBP or undergo further glycolysis to generate pyruvate. GFAT (shown in the red oval) is the rate-limiting enzyme in the HBP and uses glutamine to catalyze the conversion of F6P to glucosamine 6-phosphate. After a series of reactions, uridine diphosphate-β-GlcNAc (UDP-GlcNAc) is the end product of the HBP and serves as the donor for the enzyme OGT to perform O-GlcNAc protein post-translational modifications. The enzyme O-GlcNAcase (OGA) removes the GlcNAc moiety from proteins. UDP-GlcNAc can also be epimerized to UDP-GalNAc, metabolized to n-acetylmannosamine (ManNAc), or utilized in other glycoconjugation reactions. Pyruvate is the end product of glycolysis and can enter the citric acid cycle, be metabolized to lactate, or be excreted from the cell (cellular efflux) as pyruvate or lactate.
Figure 2.
Figure 2.
Chromatographic separation using LC-QToF of UDP-GlcNAc, Gln, G6P, F6P, and F1,6dP in a representative sample of standard solution (A) and 50 mg of tissue extract from a heart without (B) or with (C) perfusion with 10 mm [U-13C6]glucose (MPE = 99%) added to 4 nm of [13C2]UDP-GlcNAc and 150 nm of [13C5,15N2]glutamine. Signal intensity is shown for the extracted ion chromatograms at the following m/z: UDP-GlcNAc, 606.0743 (unlabeled), 608.0815 (M+2), and 612.0944 (M+6); Gln, 145.06119 (unlabeled) and 152.0727 (M+7); G6P, 259.0224 (unlabeled) and 259.0224 (M+6); F6P, 259.0224 (unlabeled) and 259.0224 (M+6); and F1,6dP, 338.9888 (unlabeled) and 345.0089 (M+6).
Figure 3.
Figure 3.
Chromatographic separation using LC-QToF of UDP-GlcNAc versus UDP-GalNAc in a representative sample of 50 mg of tissue extract from a heart perfused with 5.5 mm [U-13C6]glucose (MPE = 99%).
Figure 4.
Figure 4.
Total tissue protein O-GlcNAc levels and UDP-GlcNAc concentrations in glucosamine working heart perfusions. A, immunoblot for total protein O-GlcNAc levels in the indicated glucosamine concentrations. Total protein O-GlcNAc levels were normalized to the total protein stain (shown). B, UDP-GlcNAc concentrations normalized to heart protein in the indicated glucosamine concentrations. Bars, means ± S.E. (error bars); n = 3 for all groups. *, p < 0.05 between the indicated group and the 0.01 mm glucosamine concentration; ‡, p < 0.05 between glucosamine 0.1 and 0.001 mm. In A, p = 0.058 between 0.01 and 0.05 mm glucosamine.
Figure 5.
Figure 5.
The effect of various [U-13C6]glucosamine concentrations and perfusion durations on tissue UDP-GlcNAc M+6 MPE. A, changes in UDP-GlcNAc M+6 MPE in response to increasing [U-13C6]glucosamine concentrations. B, effect of perfusion duration for the indicated [U-13C6]glucosamine concentrations on UDP-GlcNAc M+6 MPE. Horizontal bars, means ± S.E. (error bars). In A, n = 5 for 0.001, n = 3 for 0.01, n = 3 for 0.05, and n = 4 for 0.1. In B, n = 5 for 0.001 mm 30-min perfusions, n = 2 for 0.001 mm 60-min perfusions, n = 3 for 0.01 mm 30-min perfusions, and n = 2 for 0.01 mm 60-min perfusions. For A, *, p < 0.05 between 0.001 and the indicated groups; ‡, p < 0.05 between 0.01 and the indicated groups; ‖, p < 0.05 between 0.05 and 0.1. For B, *, p < 0.05 between the [U-13C6]glucosamine concentrations at the same perfusion duration; †, p < 0.05 for the same [U-13C6]glucosamine concentration at 60 min versus 30 min.
Figure 6.
Figure 6.
The effect of [U-13C6]glucose concentration on metabolic fluxes relevant to energy production and the citric acid cycle. A, glycolytic efflux of lactate and pyruvate formed from exogenous [U-13C6]glucose. B, percentage contribution of exogenous [U-13C6]glucose to the intracellular pyruvate pool. C, percentage contribution to acetyl-CoA formation of exogenous [U-13C6]glucose via pyruvate decarboxylation (PDCglu) relative to citrate synthesis (CS). D. Percent contribution of exogenous [U-13C6]glucose to anaplerosis via pyruvate carboxylation (PCglu) relative to CS. E, ratio of exogenous [U-13C6]glucose undergoing PCglu to PDCglu. n = 5 for 5.5 mm and n = 3 for 25 mm. Horizontal bars, means ± S.E. (error bars). *, p < 0.05 between the glucose concentrations. p = 0.08 in B and p = 0.09 in C.
Figure 7.
Figure 7.
The effect of [U-13C6]glucose concentrations and perfusion durations on 13C-labeling and concentration of myocardial tissue metabolites relevant to the glycolysis including precursors for the HBP. A, G6P M+6 MPE. B, G6P tissue levels (ratio to [13C2]UDP-GlcNAc external standard). C, F6P M+6 MPE. D, F6P tissue levels (ratio to [13C2]UDP-GlcNAc external standard). D, F1,6dP M+6 MPE. E, F1,6dP tissue levels (ratio to [13C2]UDP-GlcNAc external standard). For A, C, and E, n = 5 for 5.5 mm 10-min perfusions, n = 4 for 25 mm 10-min perfusions, n = 3 for 5.5 mm 20-min perfusions, n = 5 for 25 mm 20-min perfusions, n = 3 for 5.5 mm 30-min perfusions, n = 3 for 25 mm 30-min perfusions, n = 2 for the 5.5 mm 60-min perfusions, and n = 2 for the 25 mm 60-min perfusions. For B, D, and F, the values did not change over time and are shown as combined groups with n = 13 for 5.5 mm and n = 14 for 25 mm. Horizontal bars, means ± S.E. (error bars). *, p < 0.05 between the groups at the same perfusion duration; ‡, p < 0.05 versus the immediately preceding perfusion duration for the same glucose concentration; $, p < 0.05 5.5 mm versus 25 mm.
Figure 8.
Figure 8.
The effect of [U-13C6]glucose concentrations and perfusion durations on 13C-labeling and concentration of myocardial tissue metabolites relevant to the HBP. A, UDP-GlcNAc M+6 MPE. B, UDP-GlcNAc concentrations. C, UDP-GlcNAc M+6 myocardial concentrations. For all graphs, n = 5 for 5.5 mm 10-min perfusions, n = 4 for 25 mm 10-min perfusions, n = 3 for 5.5 mm 20-min perfusions, n = 5 for 25 mm 20-min perfusions, n = 3 for 5.5 mm 30-min perfusions, n = 3 for 25 mm 30-min perfusions, n = 2 for the 5.5 mm 60-min perfusions, n = 2 for the 25 mm 60-min perfusions. *, p < 0.05 between the groups at the same perfusion duration; ‡, p < 0.05 versus the immediately preceding perfusion duration for the same glucose concentration; $, p < 0.05 versus the 20-min perfusion duration for the same glucose concentration.
Figure 9.
Figure 9.
The effect of reducing cardiac workload via Langendorff heart perfusions on metabolic fluxes relevant to energy production and the citric acid cycle. A, glycolytic efflux of lactate and pyruvate formed from exogenous [U-13C6]glucose. B, percentage contribution of exogenous [U-13C6]glucose to the intracellular pyruvate pool. C, percentage contribution to acetyl-CoA formation of exogenous [U-13C6]glucose via pyruvate decarboxylation (PDCglu) relative to citrate synthesis (CS). D, percentage contribution of exogenous [U-13C6]glucose to anaplerosis via pyruvate carboxylation (PCglu) relative to CS. E, ratio of exogenous [U-13C6]glucose undergoing PCglu to PDCglu. Horizontal bars, means ± S.E. (error bars). For the Beating group, n = 7 in A and n = 6 for all other graphs. For the Nonbeating group, n = 8 for all graphs. *, p < 0.05 Beating versus Nonbeating.
Figure 10.
Figure 10.
The effect on reducing cardiac workload via Langendorff perfusions on 13C-labeling and concentration of metabolites relevant to glycolysis, including precursors for the HBP. A, G6P M+6 molar percentage enrichment (MPE). B, F6P M+6 MPE. C, G6P tissue levels (ratio to [13C2]UDP-GlcNAc internal standard). D, F6P tissue levels (ratio to [13C2]UDP-GlcNAc external standard). Horizontal bars, means ± S.E. (error bars). For A and B, n = 4 for Beating 20 min, n = 3 for Nonbeating 20 min, n = 3 for Beating 30 min, n = 4 for Nonbeating 30 min, n = 4 for Beating 40 min, and n = 4 for Nonbeating 40 min. For C and D, the values did not change over time and are shown as combined groups with n = 11 for Beating and n = 11 for Nonbeating. *, p < 0.05 Beating versus Nonbeating at the same perfusion duration; ‡, p < 0.05 Beating versus Nonbeating.
Figure 11.
Figure 11.
The effect on reducing cardiac workload via Langendorff perfusions on 13C-labeling and concentration of metabolites relevant to the HBP. A, UDP-GlcNAc M+6 MPE. B, UDP-GlcNAc concentrations. C, UDP-GlcNAc M+6 concentrations. Horizontal bars, means ± S.E. (error bars); n = 4 for Beating 20 min, n = 3 for Nonbeating 20 min, n = 3 for Beating 30 min, n = 4 for Nonbeating 30 min, n = 4 for Beating 40 min, n = 4 for Nonbeating 40 min. *, p < 0.05 Beating versus Nonbeating at the same perfusion duration; ‡, p < 0.05 versus the immediately preceding perfusion duration for the same experimental group.

Similar articles

Cited by

References

    1. Torres C. R., and Hart G. W. (1984) Topography and polypeptide distribution of terminal N-acetylglucosamine residues on the surfaces of intact lymphocytes: evidence for O-linked GlcNAc. J. Biol. Chem. 259, 3308–3317 - PubMed
    1. Hanover J. A., Krause M. W., and Love D. C. (2010) The hexosamine signaling pathway: O-GlcNAc cycling in feast or famine. Biochim. Biophys. Acta 1800, 80–95 10.1016/j.bbagen.2009.07.017 - DOI - PMC - PubMed
    1. Butkinaree C., Park K., and Hart G. W. (2010) O-Linked β-N-acetylglucosamine (O-GlcNAc): extensive crosstalk with phosphorylation to regulate signaling and transcription in response to nutrients and stress. Biochim. Biophys. Acta 1800, 96–106 10.1016/j.bbagen.2009.07.018 - DOI - PMC - PubMed
    1. Zhu W. Z., El-Nachef D., Yang X., Ledee D., and Olson A. K. (2019) O-GlcNAc transferase promotes compensated cardiac function and protein kinase A O-GlcNAcylation during early and established pathological hypertrophy from pressure overload. J. Am. Heart Assoc. 8, e011260 10.1161/JAHA.118.011260 - DOI - PMC - PubMed
    1. Yokoe S., Asahi M., Takeda T., Otsu K., Taniguchi N., Miyoshi E., and Suzuki K. (2010) Inhibition of phospholamban phosphorylation by O-GlcNAcylation: implications for diabetic cardiomyopathy. Glycobiology 20, 1217–1226 10.1093/glycob/cwq071 - DOI - PubMed

Publication types

LinkOut - more resources