. 2020 Jan 21;117(3):1514-1523.
doi: 10.1073/pnas.1916820117. Epub 2020 Jan 8.

A cell atlas of the adult Drosophila midgut

Affiliations

A cell atlas of the adult Drosophila midgut

Ruei-Jiun Hung et al. Proc Natl Acad Sci U S A. .

Abstract

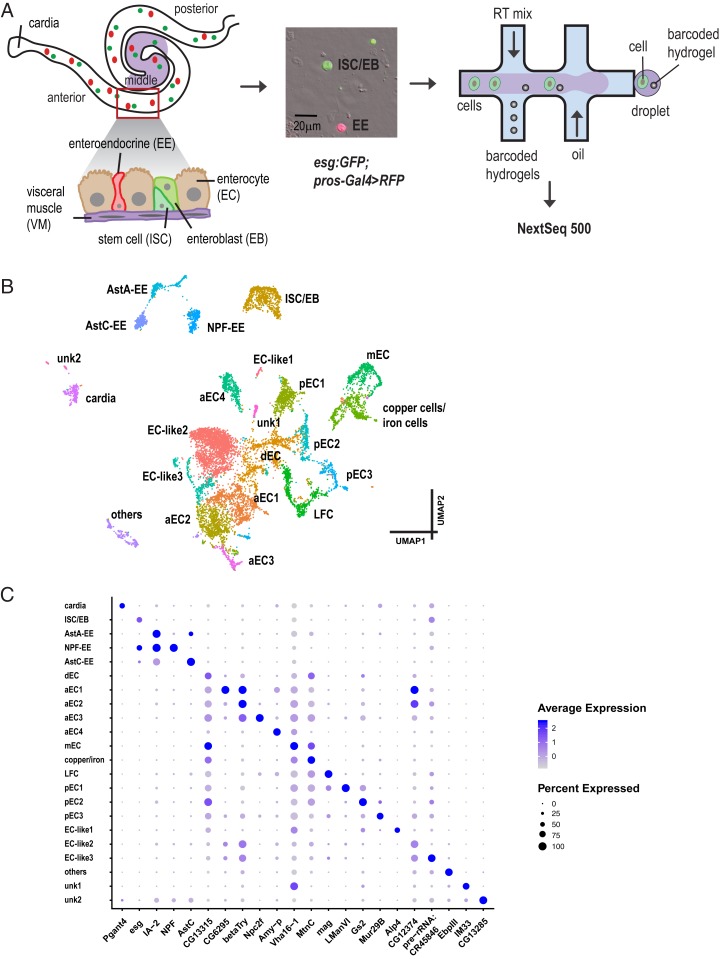
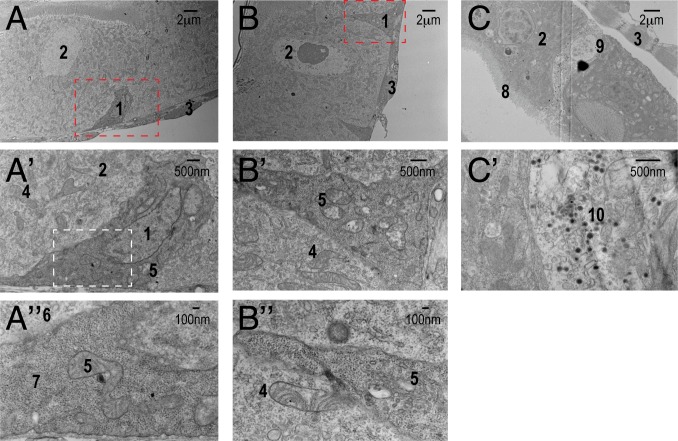
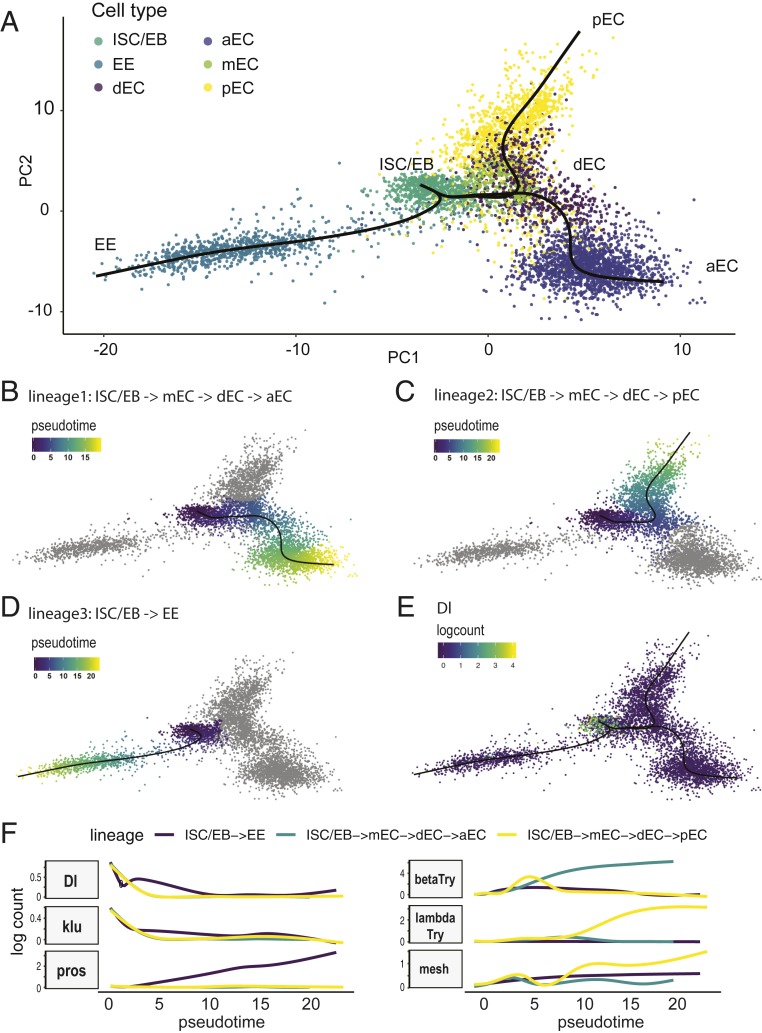
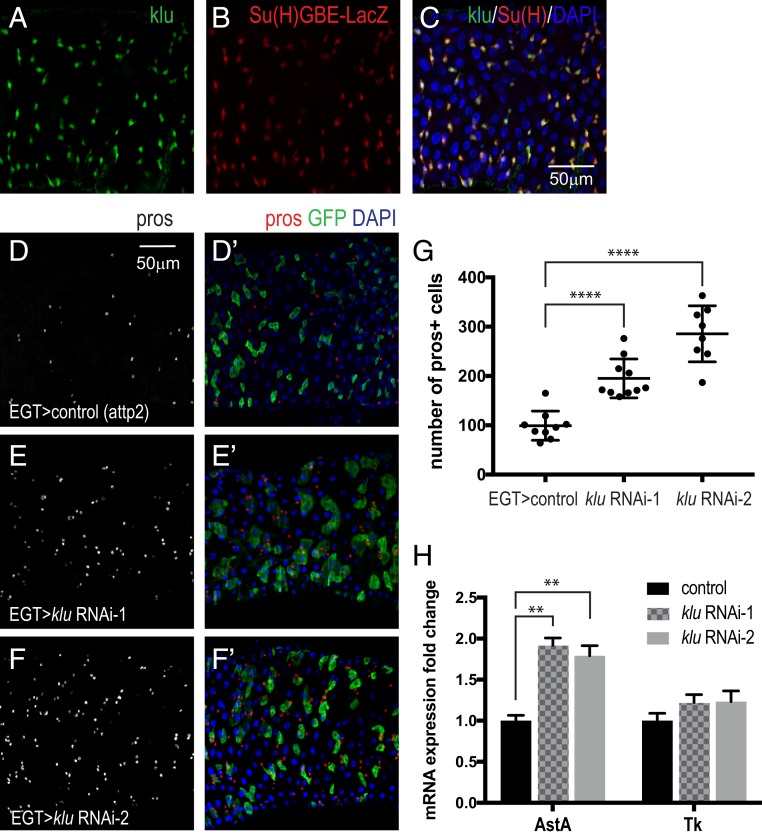
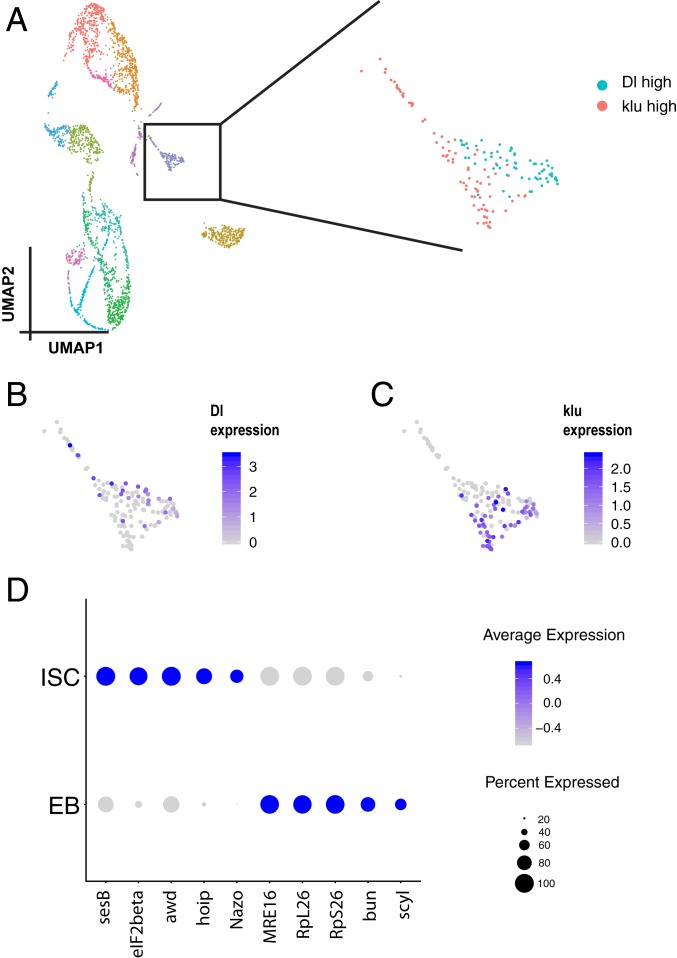
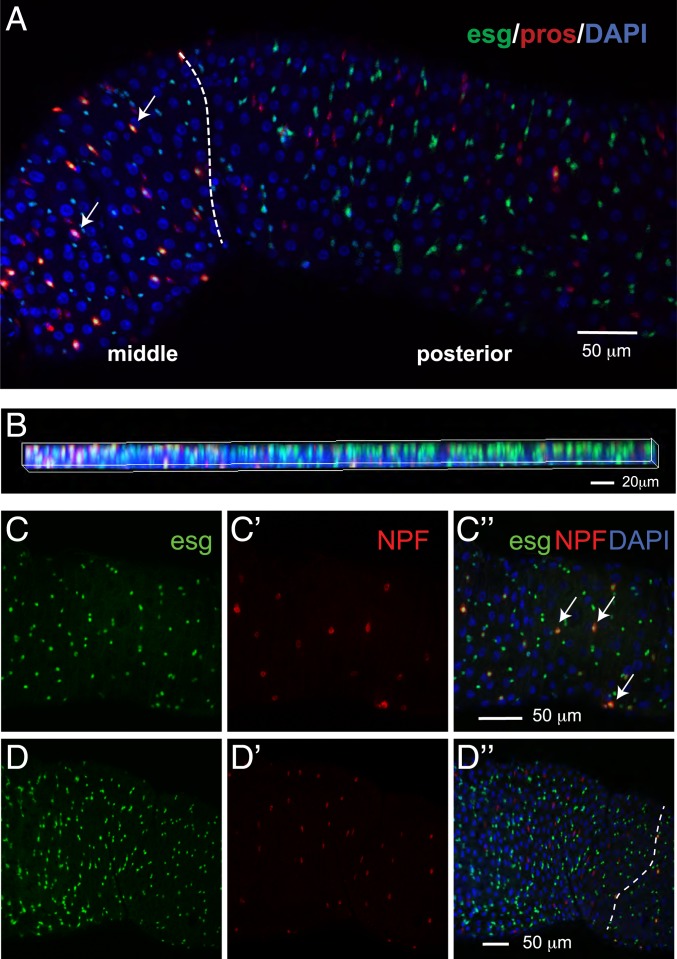
Studies of the adult Drosophila midgut have led to many insights in our understanding of cell-type diversity, stem cell regeneration, tissue homeostasis, and cell fate decision. Advances in single-cell RNA sequencing provide opportunities to identify new cell types and molecular features. We used single-cell RNA sequencing to characterize the transcriptome of midgut epithelial cells and identified 22 distinct clusters representing intestinal stem cells, enteroblasts, enteroendocrine cells (EEs), and enterocytes. This unbiased approach recovered most of the known intestinal stem cells/enteroblast and EE markers, highlighting the high quality of the dataset, and led to insights on intestinal stem cell biology, cell type-specific organelle features, the roles of new transcription factors in progenitors and regional variation along the gut, 5 additional EE gut hormones, EE hormonal expression diversity, and paracrine function of EEs. To facilitate mining of this rich dataset, we provide a web-based resource for visualization of gene expression in single cells. Altogether, our study provides a comprehensive resource for addressing functions of genes in the midgut epithelium.

Keywords: Drosophila; enteroblast; enteroendocrine cell; gut; stem cell.


Conflict of interest statement

The authors declare no competing interest.

Figures

Fig. 1.
Fig. 1.
Single-cell expression survey of the adult intestinal gut. (A) Experimental design. Different regions of the midgut and different cell types are shown. For simplicity, we distinguish 3 regions of the midgut: Anterior, middle, and posterior. Green, ISC/EB; red, EE. Cells were isolated and encapsulated using inDrop and 10x Genomics approaches. (B) Annotated cell types visualized on the UMAP of 10,605 cells. (C) Expression levels and the percentage of cells expressing markers in each cluster are shown as a dot plot.
Fig. 2.
Fig. 2.
Electron micrographs of the ultrastructure of different cell types. (A) ISC (1) with darker density than its neighboring EC (2) resides on the basal side of the epithelium. They are often triangular shape with extensive basement membrane contact. (A′) Magnified view of the region shown in A outlined by the red dash box. (A″) Magnified view of A′ outline by the white dash box. The density of ribosomes (7) in ISCs is more pronounced than that of ribosomes (6) compared to ECs. B′ is a magnified view of B. Mitochondria in ISCs (5) contain less cristae than mitochondria of ECs (4), which can be visualized better in B″. Mitochondria in ISCs look “empty.” (C) EEs (9) contain many “loaded” secreted vesicles (10, dark vesicle), better visualized in C′. 1, ISC; 2, EC; 3, visceral muscle; 4, mitochondria in EC; 5, mitochondria in ISC; 6, ribosomes in EC; 7, ribosomes in ISC; 8, microvilli; 9, EE; 10, secretory vesicles.
Fig. 3.
Fig. 3.
Results of cell lineage inference and pseudotime analysis using Slingshot. (A) Cell lineages were inferred using Slingshot. Three lineages were constructed: The first lineage is from ISC to aEC: ISC/EB → mEC → dEC → aEC (B). Pseudotime was inferred. The second lineage is from ISC to pEC: ISC/EB → mEC → dEC → pEC (C). The third lineage is from ISC to EE (D). (E) The expression level of Dl was plotted using logcount and its expression is restricted to the initial state (ISC/EB). (F) Plot of gene expression as a function of pseudotime for each lineage. The expression pattern of klu is similar to Dl (i.e., high in the beginning and gradually decreasing over pseudotime).
Fig. 4.
Fig. 4.
klu expression in EBs and its loss-of-function phenotype. (AC) Coexpression of klu and the EB reporter Su(H)GBE-LacZ. (DF′). Knockdown of klu in ISCs/EBs results in an increase of EEs, marked by pros staining: red, pros; green, esg; blue, DAPI. (G) Quantification of EE number. Data are represented as mean ± SEM. Two-tailed t test, ****P < 0.0001. (H) qRT-PCR measurement of AstA and Tk expression from midguts expressing klu RNAi in adult ISCs/EBs for 7 d. rp49 was used for normalization. Data are represented as mean ± SEM. Two-tailed t test, **P = 0.0011 for control vs. RNAi-1; **P = 0.0047 for control vs. RNAi-2.
Fig. 5.
Fig. 5.
Analysis of differences between ISCs and EBs. (A) UMAP of 2,979 cells from 10x Genomics. The ISC/EB cluster is outlined by a black box. There are 2 groups of cells in these clusters. One expresses high Dl (B) and the other expresses klu (C). (D) Dot plot of top 5 genes that express differentially in ISCs and EBs.
Fig. 6.
Fig. 6.
Characterization of a subset of EEs. (A and B) The majority of pros+ esg+ double-positive cells are located in the middle of the midgut, whereas very few double-positive cells are located in the posterior region. pros, an EE marker; esg, a progenitor marker. Dashed line indicates the boundary between the middle and posterior midgut regions. Arrow, pros+ esg+ double-positive cells. (B) Z-stacking 2D image showing the colocalization of pros and esg in the middle but not the posterior region. Genotype, esg-sfGFP/+, pros-Gal4; UAS-mCD8.RFP/+. (C and D) Image of middle (C and C″) and anterior (D and D″) midguts. Arrow, NPF+ esg+ double-positive cells. Dash line indicates the boundary between anterior and middle midgut regions. Genotype: esg-sfGFP/+, UAS-mcherryCAAX; NPF-Gal4/+. (Scale bars in C″ and D″ also apply to C, C′, D, and D′.)

References

    1. Jiang H., Grenley M. O., Bravo M. J., Blumhagen R. Z., Edgar B. A., EGFR/Ras/MAPK signaling mediates adult midgut epithelial homeostasis and regeneration in Drosophila. Cell Stem Cell 8, 84–95 (2011). - PMC - PubMed
    1. Jiang H., et al. , Cytokine/Jak/Stat signaling mediates regeneration and homeostasis in the Drosophila midgut. Cell 137, 1343–1355 (2009). - PMC - PubMed
    1. Shaw R. L., et al. , The Hippo pathway regulates intestinal stem cell proliferation during Drosophila adult midgut regeneration. Development 137, 4147–4158 (2010). - PMC - PubMed
    1. Karpowicz P., Perez J., Perrimon N., The Hippo tumor suppressor pathway regulates intestinal stem cell regeneration. Development 137, 4135–4145 (2010). - PMC - PubMed
    1. Wisidagama D. R., Thummel C. S., Regulation of Drosophila intestinal stem cell proliferation by enterocyte mitochondrial pyruvate metabolism. G3: Genes, Genomes, Genet. 9, 3623–3630 (2019). - PMC - PubMed

Publication types