. 2020 Jan;577(7790):421-425.
doi: 10.1038/s41586-019-1884-x. Epub 2020 Jan 8.

Rapid non-uniform adaptation to conformation-specific KRAS(G12C) inhibition

Affiliations

Rapid non-uniform adaptation to conformation-specific KRAS(G12C) inhibition

Jenny Y Xue et al. Nature. 2020 Jan.

Abstract

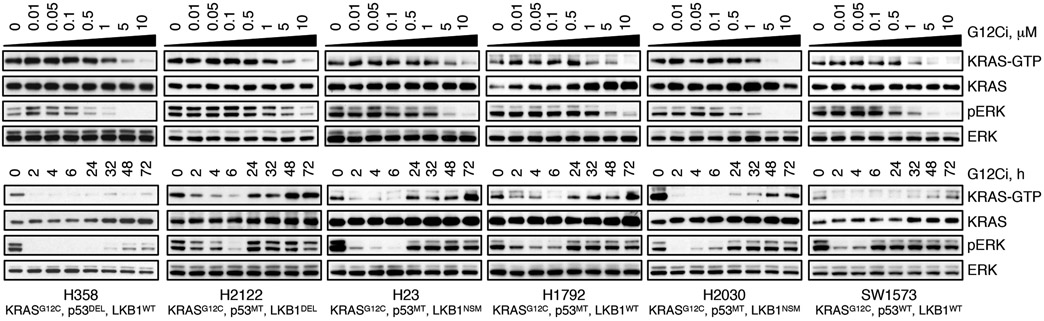
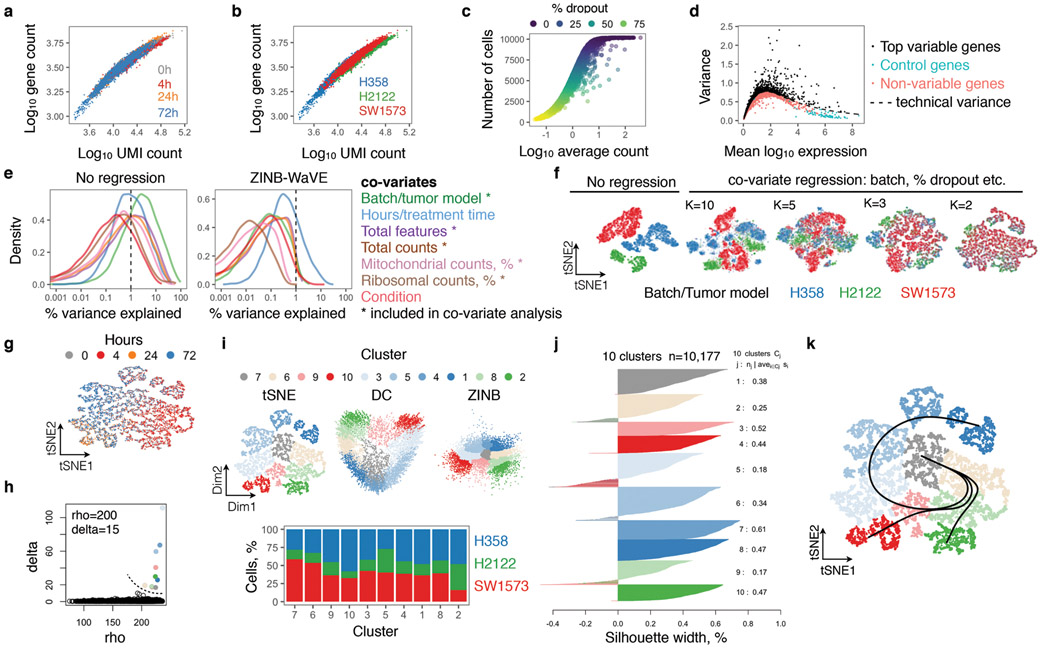
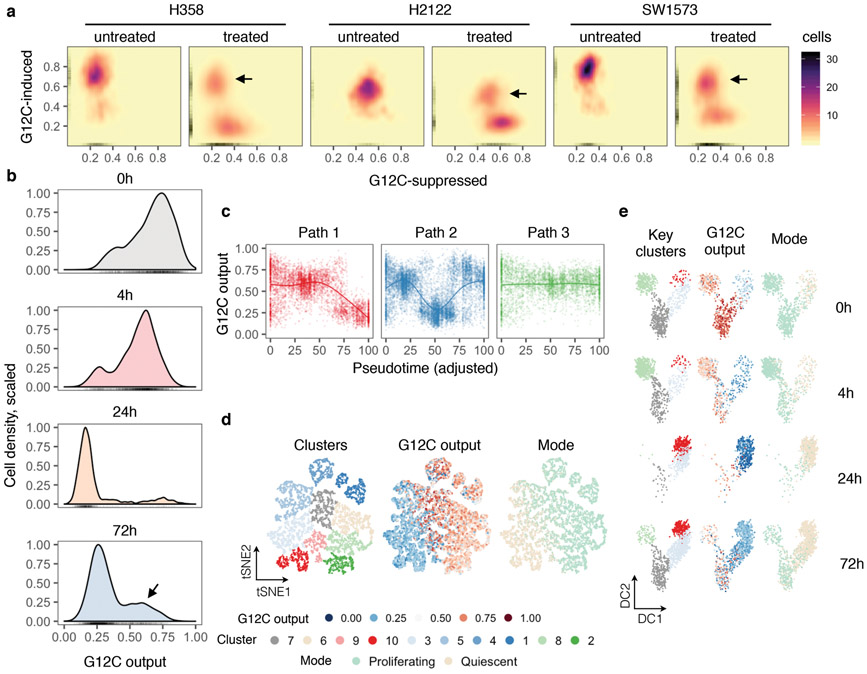
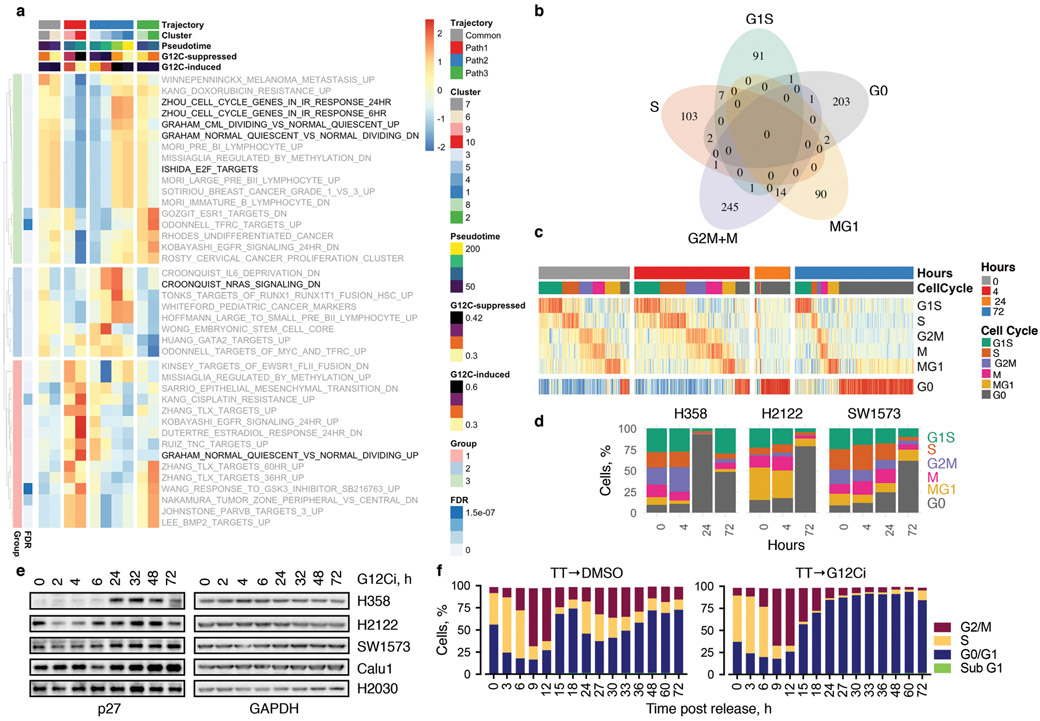
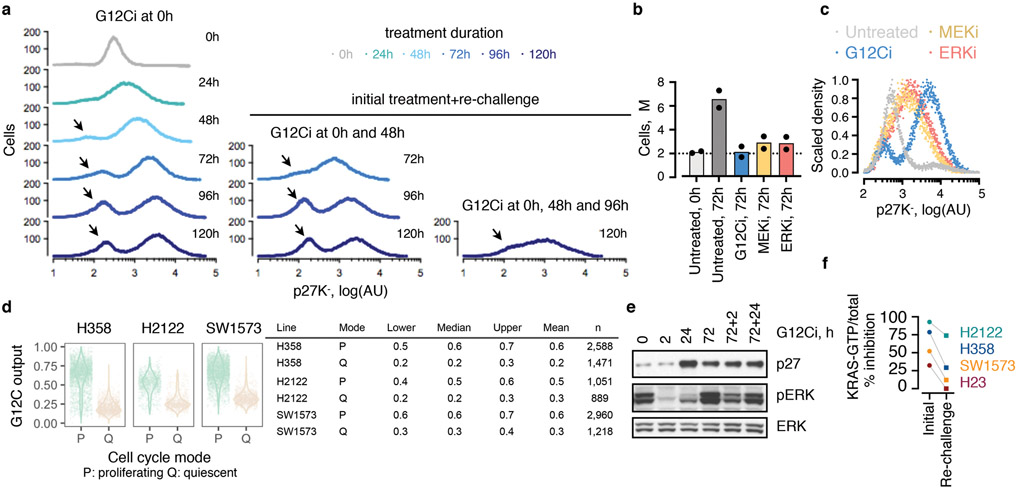
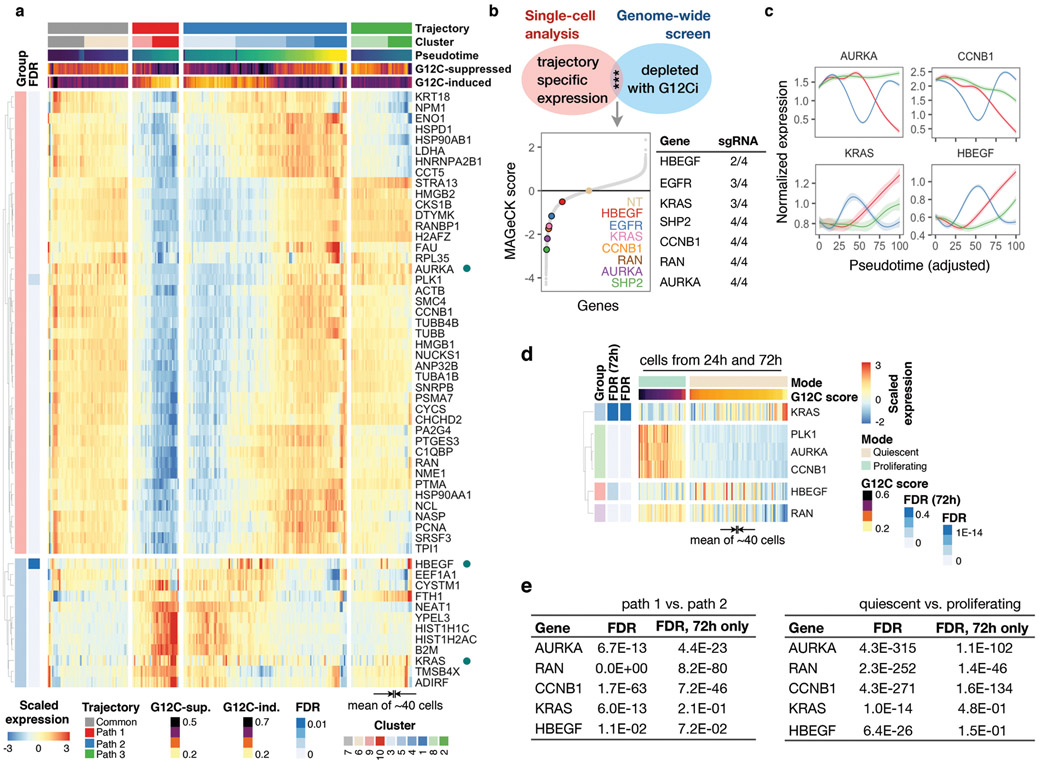
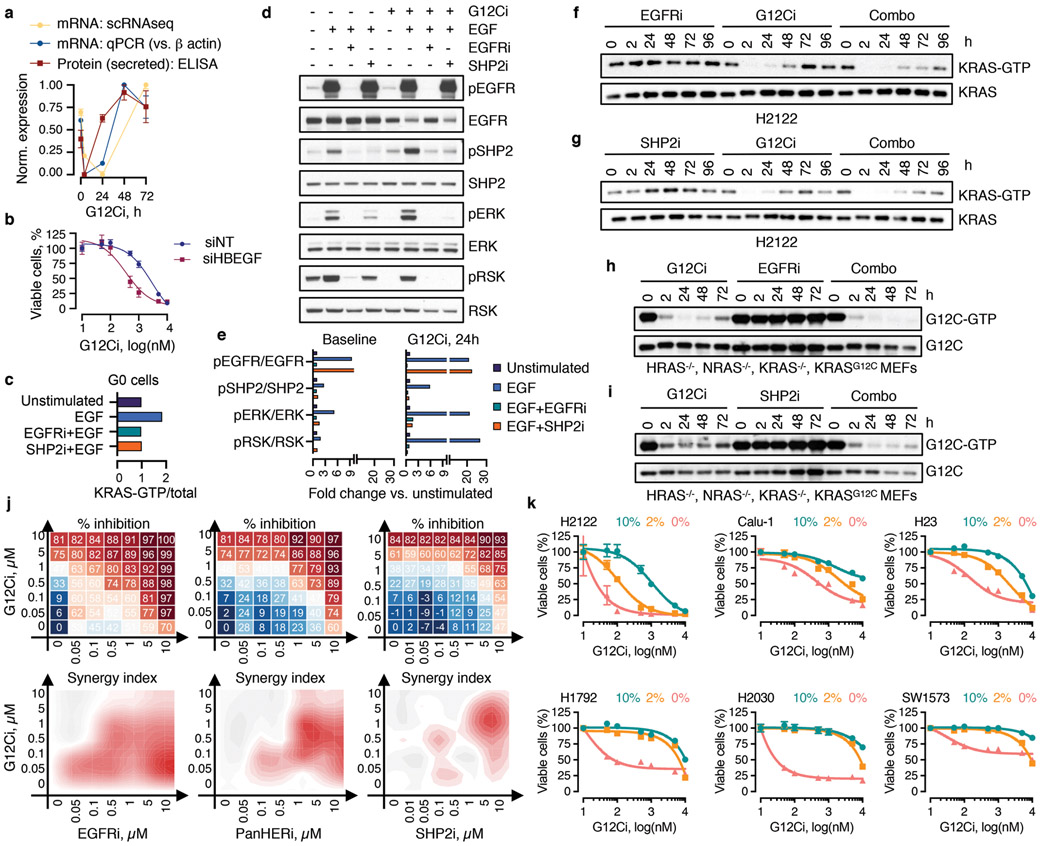
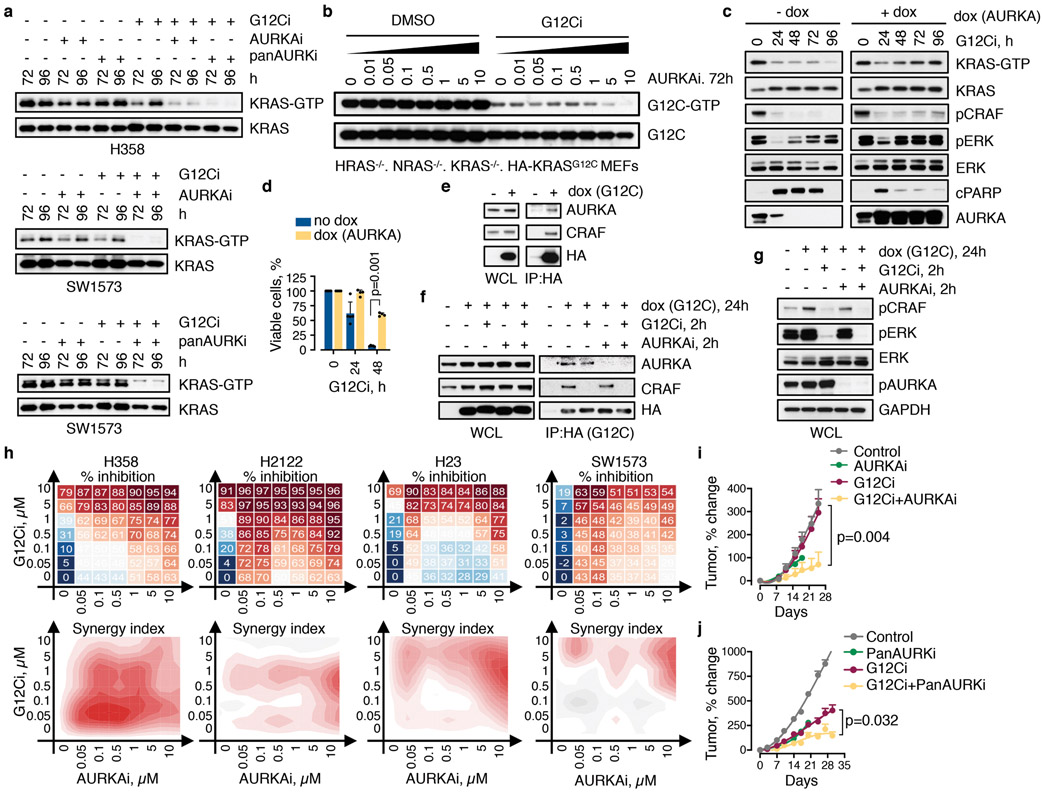
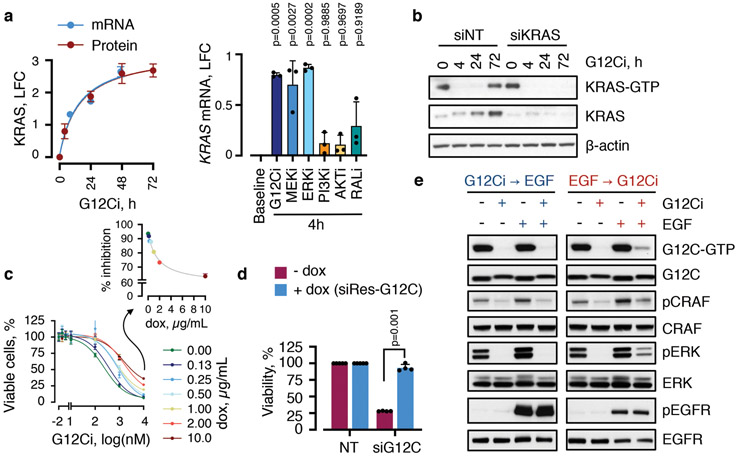
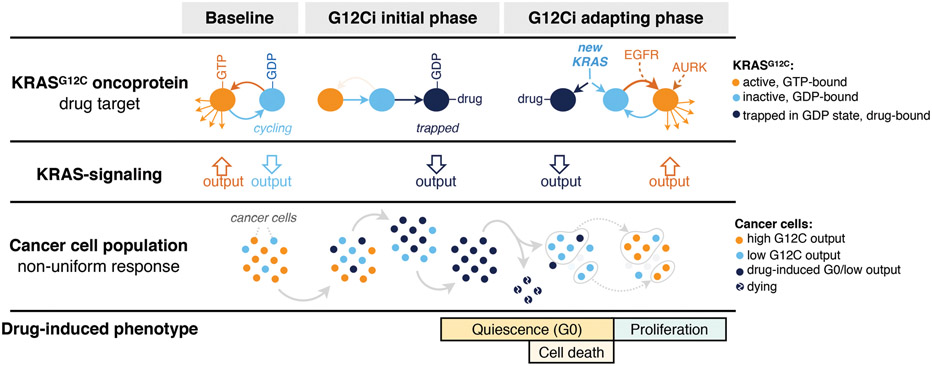
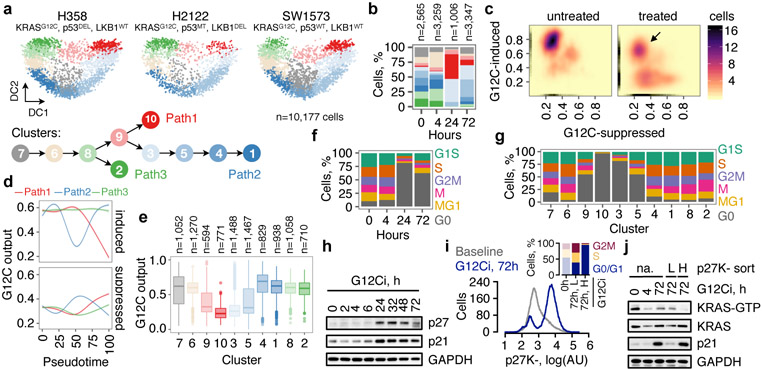
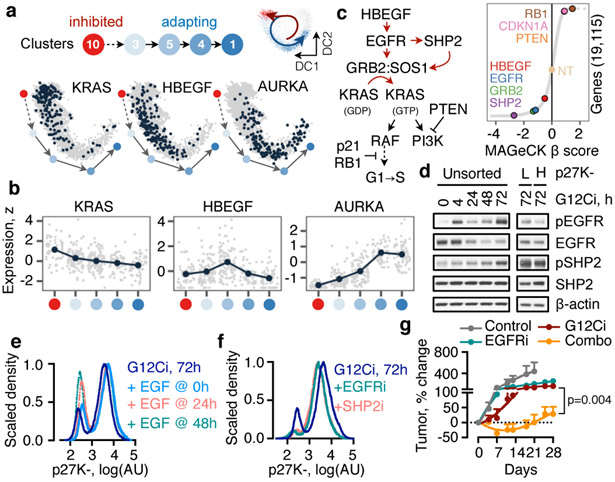
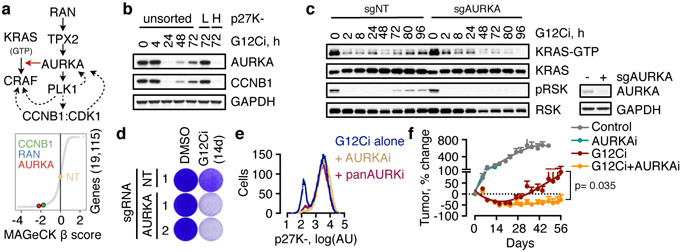
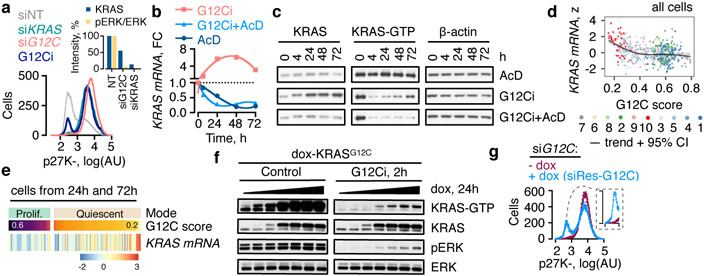
KRAS GTPases are activated in one-third of cancers, and KRAS(G12C) is one of the most common activating alterations in lung adenocarcinoma1,2. KRAS(G12C) inhibitors3,4 are in phase-I clinical trials and early data show partial responses in nearly half of patients with lung cancer. How cancer cells bypass inhibition to prevent maximal response to therapy is not understood. Because KRAS(G12C) cycles between an active and inactive conformation4-6, and the inhibitors bind only to the latter, we tested whether isogenic cell populations respond in a non-uniform manner by studying the effect of treatment at a single-cell resolution. Here we report that, shortly after treatment, some cancer cells are sequestered in a quiescent state with low KRAS activity, whereas others bypass this effect to resume proliferation. This rapid divergent response occurs because some quiescent cells produce new KRAS(G12C) in response to suppressed mitogen-activated protein kinase output. New KRAS(G12C) is maintained in its active, drug-insensitive state by epidermal growth factor receptor and aurora kinase signalling. Cells without these adaptive changes-or cells in which these changes are pharmacologically inhibited-remain sensitive to drug treatment, because new KRAS(G12C) is either not available or exists in its inactive, drug-sensitive state. The direct targeting of KRAS oncoproteins has been a longstanding objective in precision oncology. Our study uncovers a flexible non-uniform fitness mechanism that enables groups of cells within a population to rapidly bypass the effect of treatment. This adaptive process must be overcome if we are to achieve complete and durable responses in the clinic.


Figures

Extended Data Fig. 1.
Extended Data Fig. 1.. The effect of G12Ci-treatment on KRAS signaling across lung cancer cell lines.
The indicated models were treated with increasing concentrations of G12Ci (ARS1620) for 2h (top) or with 10 μM over time (bottom) and immunoblotted to determine the effect on KRAS signaling intermediates. Key genetic alterations found at baseline in the KRASG12C mutant cell lines used in this study. A representative of two independent experiments for each cell line is shown.
Extended Data Fig. 2.
Extended Data Fig. 2.. Quality assessment and processing of scRNAseq data.
a, b, Gene counts as a function of unique molecular identifier (UMI) count. Cells were grouped by G12Ci-treatment time (a) or tumor model (b). c, The number of cells expressing a gene as a function of its average count across the dataset. d, Variance as a function of mean expression. Technical variance, i.e. variability attributed to technical factors, was calculated by the expression of ribosomal genes. n=10,177 single-cells in a-d. e, The percent of variance explained by various experimental factors. A number of variables had a meaningful contribution to the variance of the dataset (i.e. they accounted for greater than 1% of the variation), suggesting the need to correct for these potentially confounding factors in downstream analysis. f, Dimensionality reduction and co-variate regression using the ZINB-WaVE (ZinB) algorithm. The K parameter of 2 was chosen as this minimizes batch and other covariate effects. g, tSNE projection showing single-cells colored by time of inhibitor treatment. h, Parameters employed to cluster cells by using the Density Cluster algorithm. i, Cluster distribution in the indicated projections (top) and cell line composition of each cluster (bottom) showing a similar representation of cells from different tumor models in each cluster. j, Silhouette width analysis to assess the appropriateness of clustering. Negative values indicate cells that have been inappropriately assigned. k, tSNE projection of KRASG12C single-cells with the three inhibitory trajectories identified by the Slingshot algorithm.
Extended Data Fig. 3.
Extended Data Fig. 3.. KRASG12C-dependent transcriptional output score in 10,177 lung cancer cells.
a, The distribution of KRASG12C-specific gene expression output score across single-cells in the three tumor models under study. The arrows denote cohorts of cells with high output despite treatment. b, Density plots showing the effect of G12Ci-treatment on the KRASG12C output score (n=2,565 single-cells from 0h, n=3,259 single-cells from 24h, n=1,006 single-cells from 24h and n=3,347 single-cells from 72h). At 72h the cells assume an asymmetric distribution, suggesting that a subpopulation of KRASG12C cells has adapted to treatment by reactivating KRASG12C-dependent output (arrow). c, The KRASG12C-output score as a function of pseudotime (which was adjusted in order to allow comparisons between trajectories). The trendline was derived by fitting a spline to the G12C score for each cell (n=4,759 in path 1, n=8,653 in path 2 and n=4,050, where n denotes the number of singe-cells). d, e, The indicated variables are plotted for each cell in a 2-dimensional tSNE (d) or DC (e) space. For simplicity, only the key clusters delineating each trajectory are shown in e.
Extended Data Fig. 4.
Extended Data Fig. 4.. G12Ci-treatment induces quiescence in a subpopulation of cancer cells.
a, Single-cells were analyzed to determine gene expression signatures that correlated with the inhibitory fates. The top 20 signatures in each direction are shown. b, The overlap in the cycle-specific gene expression signatures used to classify cells along their cell cycle phase. The G0 and G1 comprise of mostly non-overlapping genes. c, A heatmap of cell cycle-specific gene expression scores across each cell. Values were scaled across columns. d, Effect of G12Ci on cell cycle distribution across treatment time and tumor models. e, The cell lines were treated as shown to determine the level of p27 expression by immunoblotting. A representative of two independent experiments is shown for all except H2030, which was assayed once. f, KRASG12C mutant cells (H358) were synchronized with double thymidine treatment and then released in the presence or absence of G12Ci-treatment, followed by cell cycle analysis using propidium iodide (PI) staining. Note that this assay cannot distinguish G0 from G1. TT: double thymidine. A representative of two independent experiments is shown.
Extended Data Fig. 5.
Extended Data Fig. 5.. Biosensor validation of the divergent response to G12Ci-treatment.
a, Quiescence biosensor-expressing cells (H358/p27K-) were treated and re-challenged with the G12Ci to determine the effect on quiescence (i.e. p27K-high peak) at the indicated times. b, c, The cells were treated with the indicated inhibitors for 72h to determine the effect on cell number (b, n=2 biological replicates) or the distribution of biosensor expression (c). d, Comparison of the KRASG12C-output score between proliferating and quiescent cells. Note the similarity of the transcriptional output signature score derived from scRNAseq analysis with the KRAS-GTP levels determined by RBD pulldown in Fig. 1j. e, The cells were exposed to single treatment (0-72h) or drug re-challenge (+) for 2h or 24h. Cell extracts were evaluated by immunoblotting. f, The indicated KRASG12C-mutant lung cancer cell lines were treated with the G12Ci for 72h followed by drug re-challenge for 4h. The % inhibition in KRAS-GTP/total was determined by comparing baseline vs. 4h G12Ci and 72h G12Ci vs 72h+4h G12Ci. A representative of two experimental repeats is shown in a and e.
Extended Data Fig. 6.
Extended Data Fig. 6.. Genes with trajectory-specific expression profiles.
a, Single-cells were analyzed to identify differentially expressed genes by contrasting paths 1 and 2. The top 50 genes are shown. The teal dots indicate genes that were validated in subsequent experiments. b, A CRISPR-Cas9 screen was carried out in H358 cells in order to help narrow down the list of genes with trajectory-specific expression (by identifying and focusing on genes modulating the antiproliferative effect of the G12Ci). Note that the schematic is not drawn to scale. Preference was given to genes with 2 or more sgRNAs that were down-regulated by at least 2-fold in the G12Ci v. t0 comparison and that were also identified as having trajectory specific expression in the scRNAseq analysis. Pathways with several intermediates represented were prioritized. The number of gene-specific sgRNAs that were depleted during G12Ci-treatment is also shown. NT: non-targeting control. c, The trend in expression for the indicated genes as a function of pseudotime was established by fitting a spline to single-cell data. The 95% confidence interval is shown. The pseudotime was adjusted to compare between trajectories. The number of cells in each trajectory is noted below. d, The expression of the indicated genes in proliferating or quiescent cells. Only cells collected during the adaptive phase (24-72h) of G12Ci-treatment are shown. e, The gene false discovery rate (FDR) in the indicated comparisons either across the entire cohort of cells, or the subset of cells collected at the 72h time point only (n=4,759 in path 1, n=8,653 in path 2, n=4,050 in path 3, n=6,599 in G1S, S, G2M, M or MG1 (proliferating) and n=3,578 in G0 (quiescent), where n denotes the number of singe-cells in each group).
Extended Data Fig. 7.
Extended Data Fig. 7.. The adaptive reactivation of KRAS during G12Ci-treatment is dependent on EGFR signaling.
a, The cells were treated with the G12Ci over time to determine the effect on HBEGF expression. mRNA expression was determined by scRNAseq (mean, n>1000 single-cells per time point, see Fig. 1b), or by quantitative PCR (qPCR, mean ± s.e.m, n=3). The amount of protein secreted in the medium was quantified by ELISA (mean ± s.e.m, n=3). Norm.: normalized (min-max). b, Cells transfected with HBEGF-specific siRNAs were treated with increasing concentrations of G12Ci for 72h to determine the effect on viability (mean ± s.e.m, n=3). c, Cells treated with the G12Ci for 72h were stimulated with EGF for 10 min, alone or in combination with the indicated inhibitors. Quiescent cells (p27K-high) were isolated by FACS and their extracts were assayed for active KRAS by RBD pull-down. Immunoblots were quantified by densitometry and reported as fold-change relative to unstimulated. d-e, Untreated or G12Ci-treated (24h) H358 cells were stimulated with EGF (200 ng/mL) for 10 min alone or in combination with the indicated inhibitors. Cell extracts were analyzed by immunoblotting (d). The effect of EGF stimulation at baseline (lanes 2-4 vs. lane 1) or after G12Ci-treatment (lanes 6-8 vs. lane 5) was quantified by densitometry (e). f-i, The indicated KRASG12C mutant lung cancer cells (f, g) or HA-KRASG12C expressing ‘RASless’ MEFs (h, i) were treated with the G12Ci alone or in combination with EGFR or SHP2 inhibitors as shown. Cell extracts were subjected to RBD pull-down to determine the level of active (GTP-bound) and total KRAS. The HA-tag was used to determine the specific effect on KRASG12C (h, i). j, H358 cells were treated with the G12Ci alongside gefitinib (EGFRi), afatinib (PanHERi) or SHP099 (SHP2i) to determine the effect on cancer cell growth (top) and the presence of treatment synergy (bottom), by using the Bliss index. Red denotes synergy. The mean of 3 biological replicates is shown on top. k, The indicated KRASG12C mutant cells were treated with increasing concentration of the G12Ci in the presence of 10%, 2% or 0% serum to determine the effect on cell viability (mean ± s.e.m, n=3). A representative of two independent experiments is shown in d, f, g, h and i. Unless otherwise indicated n denotes biological replicates.
Extended Data Fig. 8.
Extended Data Fig. 8.. AURKA is involved in the reactivation of KRAS-GTP during G12Ci-treatment.
a, KRASG12C mutant lung cancer cells were treated with the G12Ci alone or in combination with AURKA (alisertib, 10 μM) or panAURK (tozasertib, 10 μM) inhibitors to determine the effect on KRAS-GTP levels over time. Note the lack of a significant effect on KRAS-GTP levels with AURKi treatment in the absence of G12Ci-treatment. b, ‘RASless' murine embryonic fibroblast expressing KRASG12C were treated as shown to determine the effect on KRASG12C-GTP. c, H358 cells stably transfected with dox-inducible AURKA (dox-AURKA) were treated with the G12Ci in the presence or absence of dox (2 μg/mL). Extracts from cells were analyzed by immunoblotting to determine the effect on the indicated intermediates. d, H358 dox-AURKA cells were treated as shown and assayed to determine the effect on cell viability (mean + s.e.m, n=5). A two-tailed t test p value is shown. e-g, H358 stably expressing HA-tagged KRAS G12C under a dox-inducible promoter were treated with dox for 24h alone (e) or with the indicated inhibitors (f, g). Cell extracts were immunoprecipitated and immunoblotted as indicated. h, KRASG12C mutant cell lines were treated as shown to determine the effect on cancer cell growth (top) and the presence of treatment synergy (bottom), by using the Bliss index. Red denotes synergy. The mean of three biological replicates is shown on top. i, j, Mice bearing SW1573 (i) or H2122 (j) xenografts were treated with the indicated inhibitors to determine the effect on tumor growth (mean + s.e.m, n=6 in SW1573, n=5 in H2122). A two-tailed t-test p value is shown. A representative of at least two independent experiments is shown in a-g. Unless otherwise indicated n denotes biological replicates.
Extended Data Fig. 9.
Extended Data Fig. 9.. Inhibition of MAPK signaling stimulates new KRAS synthesis.
a, The cells were treated with the indicated inhibitors and analyzed to determine the level of KRAS mRNA or protein expression (mean ± s.e.m., n=3) LFC: log2 fold change relative to 0h. The indicated p values were determined by ANOVA (p=0.001) followed by pairwise comparisons vs. baseline, while correcting for multiple hypotheses (using Dunnett’s test in Prism). b, SW1573 (KRASG12C+/+) cells were transfected with non-targeting (NT) or KRAS-specific siRNAs followed by treatment with the G12Ci and immunoblotting. c, H358 cells engineered to express HA-KRASG12C under a dox-inducible promoter were treated with the G12Ci, alone or in the presence of dox, to determine the effect on cell viability at 72h (mean ± s.e.m., n=3). d, H358 p27K- cells were stably transfected with dox-inducible siRNA-resistant KRASG12C (siRes-G12C). The cells were transfected with KRASG12C-specific siRNA (siG12C) followed by dox (2 μg/mL) induction. The effect on cell viability is shown as mean ± s.e.m (n=5 for −dox and n=4 for +dox). A two-tailed t test p value is shown. e, H358 cells with dox-inducible HA-KRASG12C were treated with dox (2 μg/mL) for 24h in serumfree medium. Then, the cells were exposed to either EGF (200 ng/mL) followed by the G12Ci (10 μM), or vice versa. Cell extracts were analyzed by RBD pull-down and immunoblotting. The specific effect on KRASG12C was determined by the HA-tag. A representative of at least two independent experiments is shown in b, d, e. Unless otherwise indicated n denotes biological replicates.
Extended Data Fig. 10.
Extended Data Fig. 10.. Rapid non-uniform adaptation to conformation-specific KRASG12C inhibition.
Left: At baseline, KRASG12C cycles between its active (GTP-bound) and inactive (GDP-bound) conformations. Active KRASG12C engages effector signaling, which regulates a transcriptional repertoire (i.e. KRAS-output) responsible for controlling various cellular functions. Middle: Shortly after exposure to G12Ci-treatment, KRASG12C is trapped in its inactive state, and eventually the cancer cell population is sequestered in a low-KRAS-output state. These cells stop proliferating and enter quiescence (G0). Right: In time, some cells undergo cell-death, while others adapt to the G12Ci to reactivate KRAS-transcriptional output, bypassing drug-induced quiescence to resume proliferation. Our model suggests that this occurs because cells with low KRAS output produce new KRASG12C protein, which is not bound by the drug. Then, upstream signals operating in distinct cancer cell subpopulations, such as those mediated by EGFR or AURKA, maintain the new protein in its active/drug-insensitive state. By comparison, in cells where these upstream signals are not active (or in cells where these signals are pharmacologically inactivated), the new KRASG12C spends a longer time in its inactive conformation, where it can be bound by the drug and be inhibited. This multifactorial process gives rise to a non-uniform treatment response with diverging effects across the cancer cell population.
Fig. 1.
Fig. 1.. Divergent single-cell fates after conformation-specific KRASG12C inhibition.
a, Diffusion component (DC) analysis of single-cells from KRASG12C tumor models treated with a G12Ci for 0, 4, 24 and 72h. The arrows indicate inhibitory trajectories derived by the Slingshot algorithm. b, Cluster composition across treatment time. c, The distribution of KRASG12C-dependent transcriptional output score across single-cells. d, The trend in G12C output as a function of pseudotime was established by fitting a spline to single-cell data. The 95% confidence interval is shown (n=4,759, n=8,653 and n=4,050 in paths 1-3, respectively; where n denotes the number of cells). e, G12C output score across clusters. Median, upper- and lower- quartiles and outliers are shown. f, g, Cell cycle phase distribution over time (f) or across clusters (g). h, Extracts from drug-treated KRASG12C-mutant cells (H358) were analyzed to determine the expression of the indicated proteins. i, H358 cells expressing a quiescence biosensor based on a CDK-binding deficient p27 mutant (p27K-, mVenus), were analyzed by FACS. Inset: The cell cycle distribution of the indicated populations. j, Biosensor-expressing cells were treated, sorted and analyzed to determine the levels of active and total KRAS. A representative of three independent experiments is shown in h-j.
Fig. 2.
Fig. 2.. Adaptation to G12Ci-treatment is dependent on EGFR signaling.
a, b, The peak (a) or mean (b) expression of genes with trajectory-specific expression. a, Cells from the indicated clusters were projected in their DC coordinates. Cells with peak expression in the indicated genes are shown in navy. b, Cells were grouped by cluster, ordered in pseudotime and the mean expression was calculated for pools of 15 cells (gray) or the entire cluster (navy). c, A genome-wide CRISPR/Cas9 screen in H358 cells identified EGFR signaling intermediates as potential regulators of G12Ci-treatment. NT: non-targeting sgRNAs. d, Immunoblots of extracts from G12Ci-treated and FACS-sorted H358/p27K- cells. e, f, The cells were treated with the G12Ci for 72h alone or in the presence of EGF stimulation at the indicated times (e) or in the presence of the indicated EGFR signaling inhibitors (f). g, H2122 xenograft-bearing mice were treated as shown to determine the effect on tumor growth (mean + s.e.m, n=4). A two-sided t-test p value is shown. A representative of two independent experiments is shown in d-f.
Fig. 3.
Fig. 3.. AURKA is involved in the adaptive reactivation of KRAS and escape from drug-induced quiescence.
a, AURK signaling intermediates identified in the CRISPR/Cas9 screen as potential regulators of G12Ci-treatment response. b, Immunoblots of extracts from FACS-sorted H358/p27K-cells. c, d, KRASG12C-mutant lung cancer cells (H358) expressing a non-targeting (NT) or AURKA-specific sgRNAs were treated with the G12Ci and analyzed by immunoblotting (c) or by crystal violet staining (d). e, Cells were treated with the indicated inhibitors for 72h and analyzed by FACS. f, H358 xenograft-bearing mice were treated with the indicated inhibitors to determine the effect on tumor growth (mean + s.e.m, n=4). A two-sided t-test p value is shown. A representative of three independent experiments is shown in b-e.
Fig. 4.
Fig. 4.. Newly-synthesized KRASG12C is reactivated to escape trapping by the drug.
a, Quiescence biosensor-expressing cells (H358/p27K-, KRASG12C+/−) were transfected with KRAS- specific siRNAs targeting both wild-type and G12C alleles or only G12C for 72h and analyzed by FACS. The effect of a 72h G12Ci-treatment is shown. Inset: Cell extracts were immunoblotted and quantified to determine the intensity of KRAS expression and ERK phosphorylation. b, Effect of the indicated treatments on KRAS mRNA. FC: fold change, AcD: actinomycin D. c, Inhibitortreated cell extracts were analyzed by immunoblotting. d, e, Normalized KRAS expression across single-cells as a function of KRASG12C-output score (d) or in quiescent vs. proliferating cells (e). f, H358 cells engineered to express HA-KRASG12C under a dox-inducible promoter were treated with the G12Ci in the presence of dox (0-2 μg/mL). g, Biosensor expressing cells, engineered to stably express dox-inducible siRNA-resistant (siRes) KRASG12C, were transfected with G12C-specific siRNA followed by dox treatment (100 ng/mL). A representative of three independent experiments are shown in a-c, f, g.

Comment in

References

    1. Pylayeva-Gupta Y, Grabocka E & Bar-Sagi D RAS oncogenes: weaving a tumorigenic web. Nature reviews. Cancer 11, 761–774, doi:10.1038/nrc3106 (2011). - DOI - PMC - PubMed
    1. Li S, Balmain A & Counter CM A model for RAS mutation patterns in cancers: finding the sweet spot. Nat Rev Cancer 18, 767–777, doi:10.1038/s41568-018-0076-6 (2018). - DOI - PubMed
    1. Ostrem JM, Peters U, Sos ML, Wells JA & Shokat KM K-Ras(G12C) inhibitors allostericaNy control GTP affinity and effector interactions. Nature 503, 548–551, doi:10.1038/nature12796 (2013). - DOI - PMC - PubMed
    1. Patricelli MP et al. Selective Inhibition of Oncogenic KRAS Output with Small Molecules Targeting the Inactive State. Cancer discovery 6, 316–329, doi:10.1158/2159-8290.CD-15-1105 (2016). - DOI - PubMed
    1. Lito P, Solomon M, Li LS, Hansen R & Rosen N Allele-specific inhibitors inactivate mutant KRAS G12C by a trapping mechanism. Science 351, 604–608, doi:10.1126/science.aad6204 (2016). - DOI - PMC - PubMed

Additional full text HTML references:

    1. Klein AM et al. Droplet barcoding for single-cell transcriptomics applied to embryonic stem cells. Cell 161, 1187–1201, doi:10.1016/j.cell.2015.04.044 (2015). - DOI - PMC - PubMed
    1. Macosko EZ et al. Highly Parallel Genome-wide Expression Profiling of Individual Cells Using Nanoliter Droplets. Cell 161, 1202–1214, doi:10.1016/j.cell.2015.05.002 (2015). - DOI - PMC - PubMed
    1. Azizi E et al. Single-Cell Map of Diverse Immune Phenotypes in the Breast Tumor Microenvironment. Cell 174, 1293–1308 e1236, doi:10.1016/j.cell.2018.05.060 (2018). - DOI - PMC - PubMed
    1. van Dijk D et al. Recovering Gene Interactions from Single-Cell Data Using Data Diffusion. Cell 174, 716–729 e727, doi:10.1016/j.cell.2018.05.061 (2018). - DOI - PMC - PubMed
    1. Huber W et al. Orchestrating high-throughput genomic analysis with Bioconductor. Nat Methods 12, 115–121, doi:10.1038/nmeth.3252 (2015). - DOI - PMC - PubMed

Publication types

MeSH terms

LinkOut - more resources