. 2020 Apr;580(7801):113-118.
doi: 10.1038/s41586-019-1885-9. Epub 2020 Jan 8.

In vitro characterization of the human segmentation clock

Affiliations

In vitro characterization of the human segmentation clock

Margarete Diaz-Cuadros et al. Nature. 2020 Apr.

Abstract

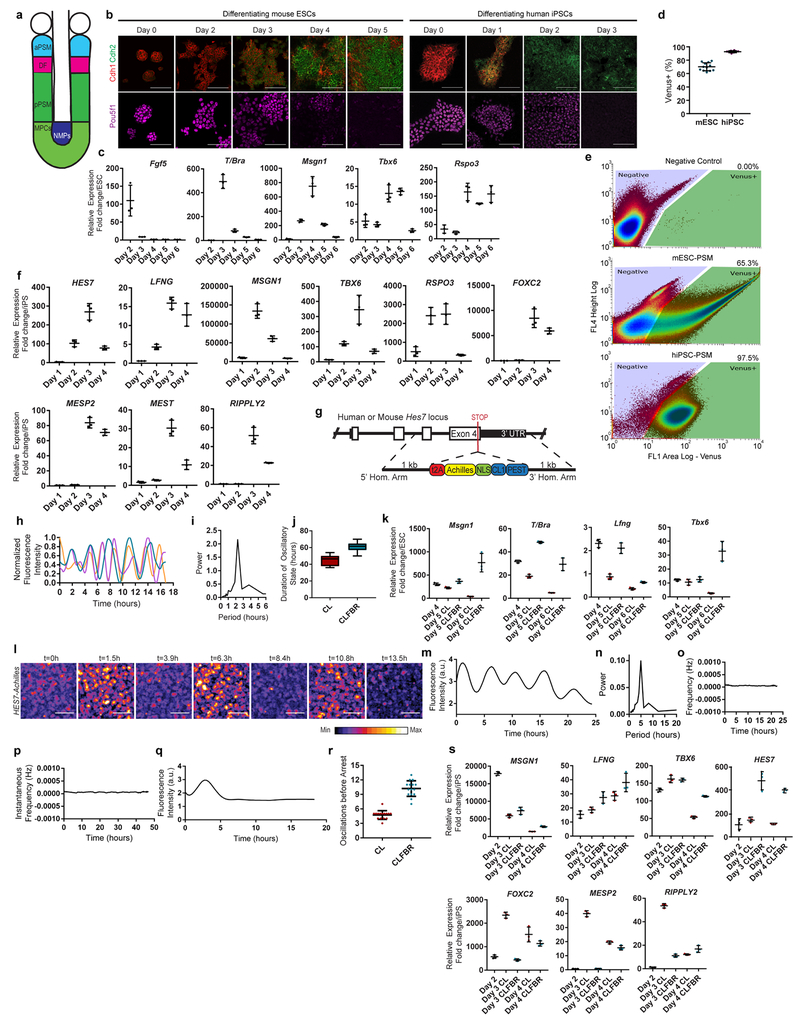
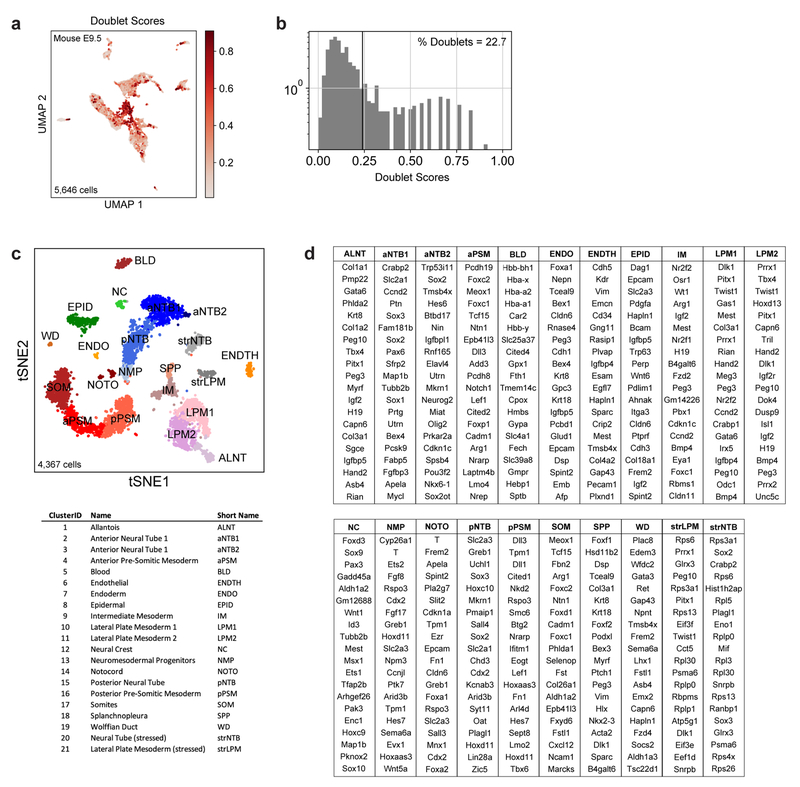
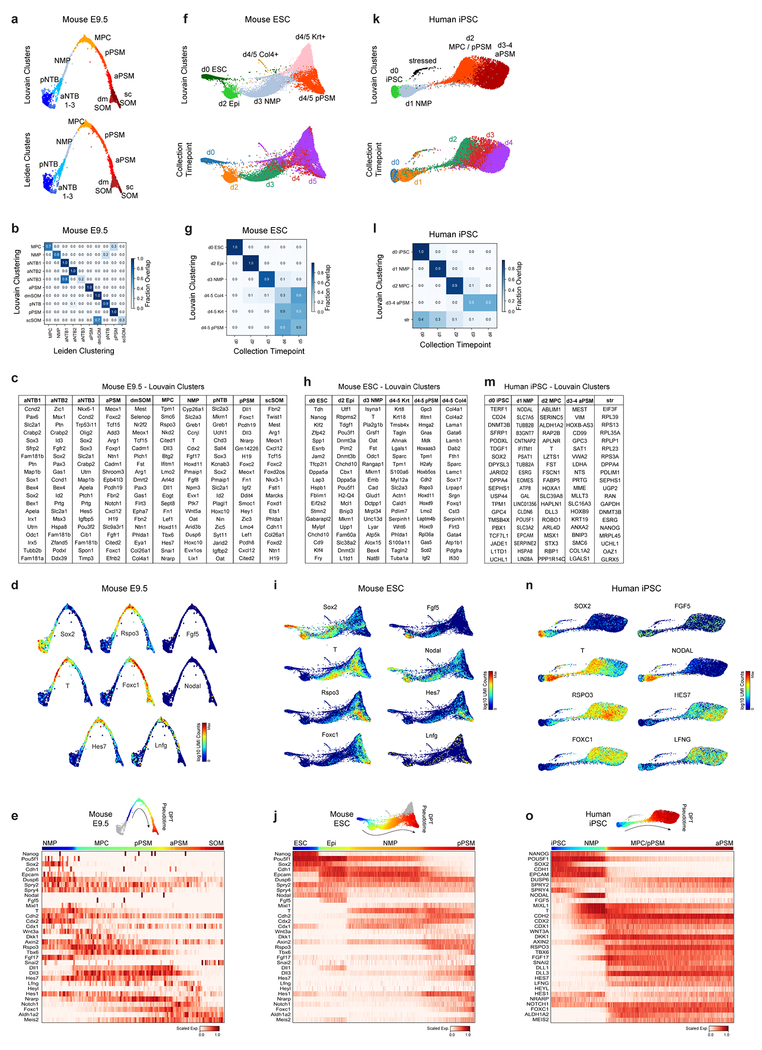
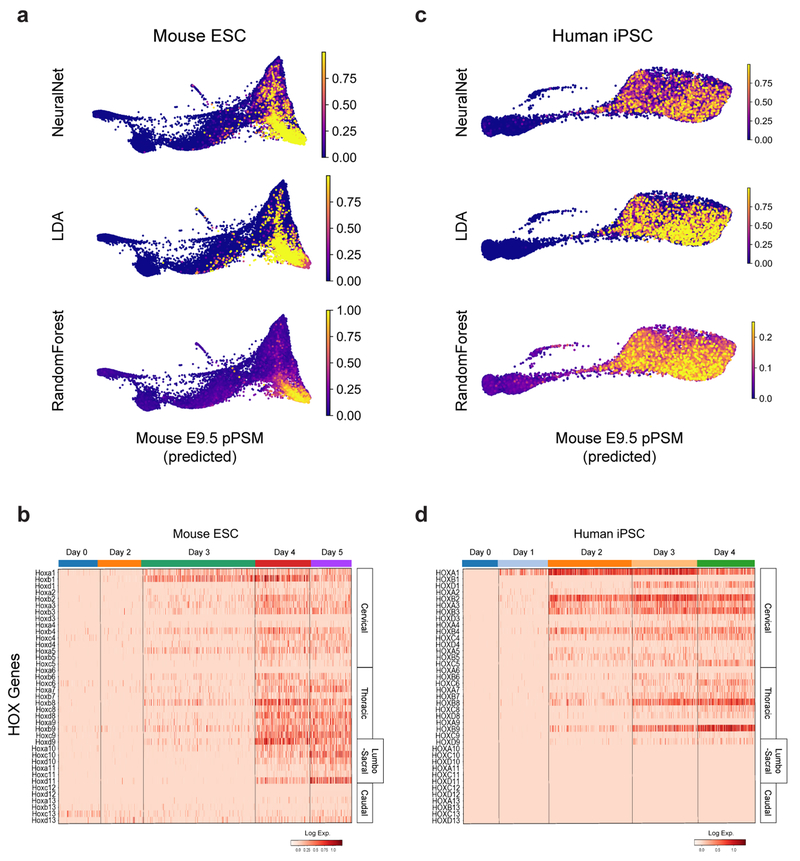
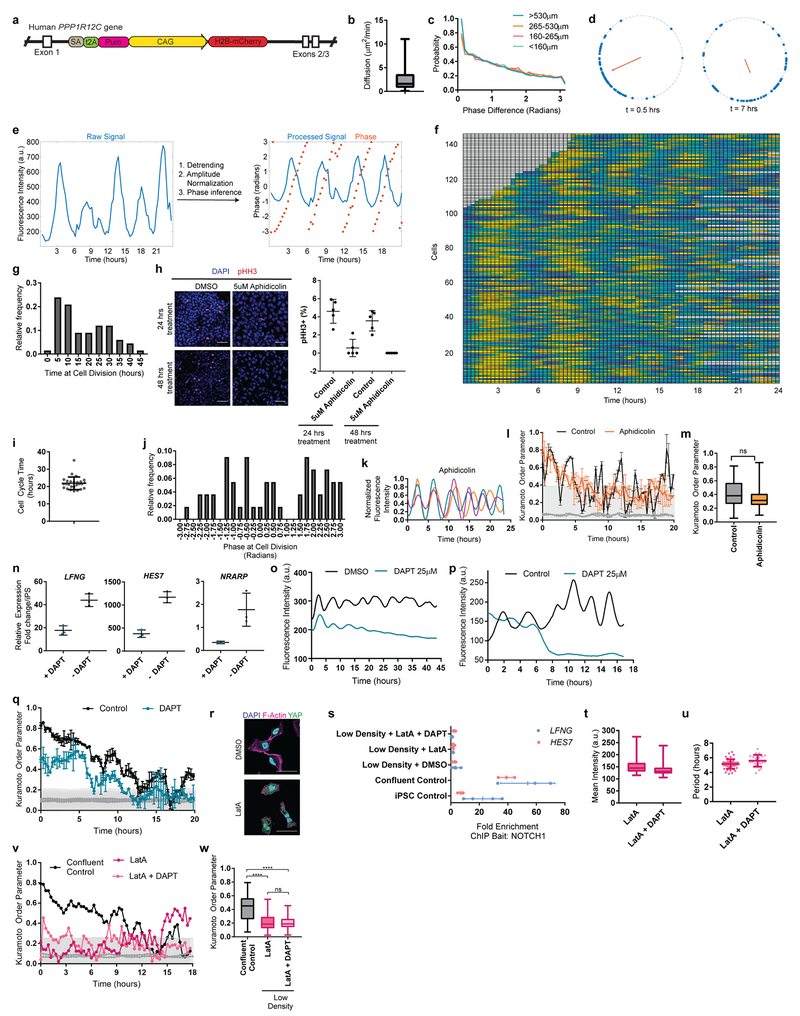
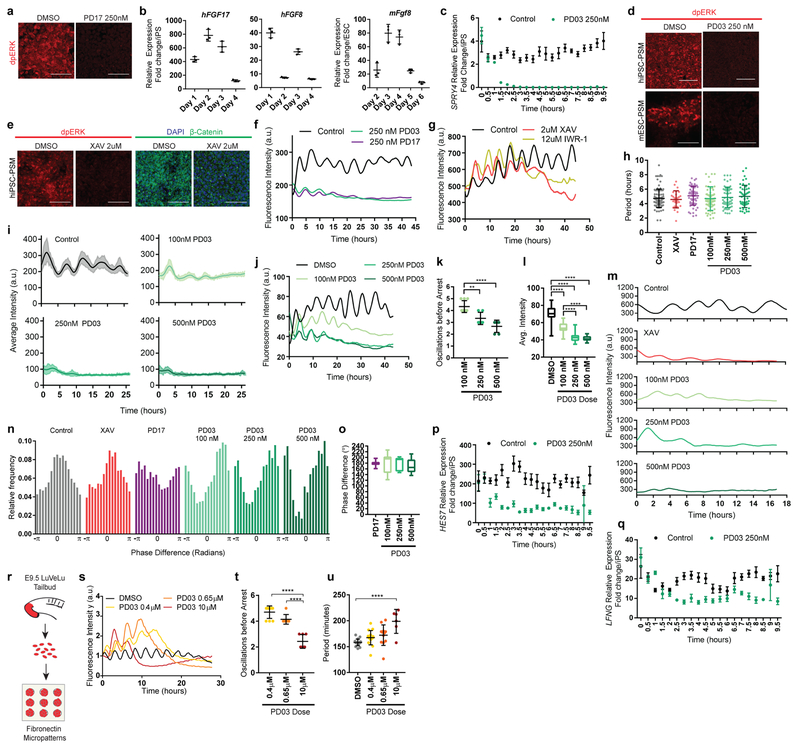
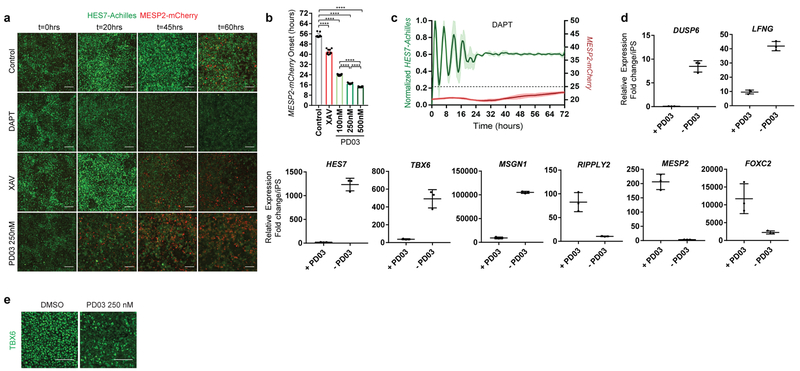
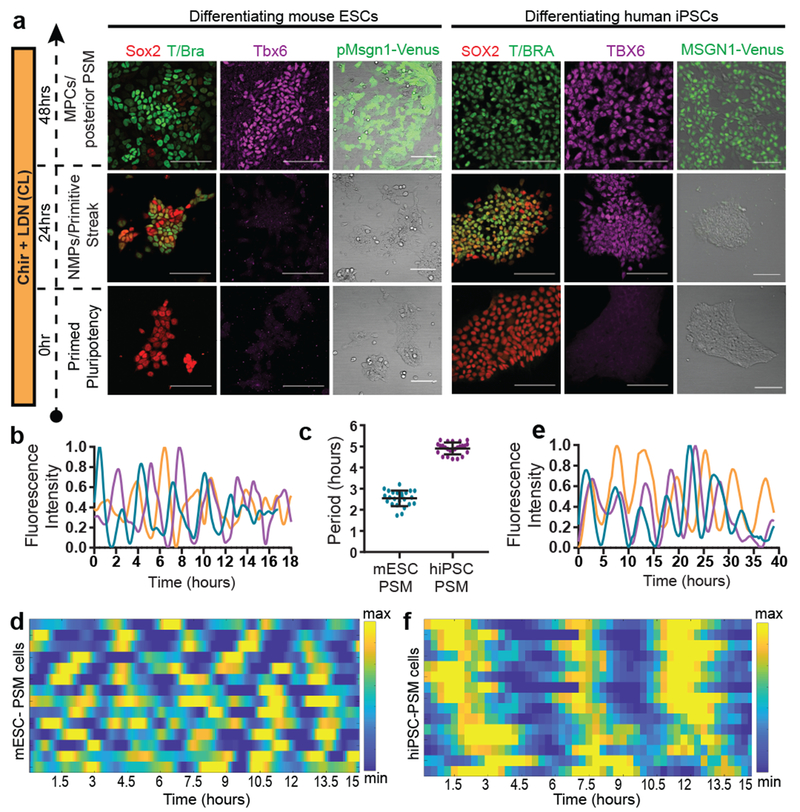
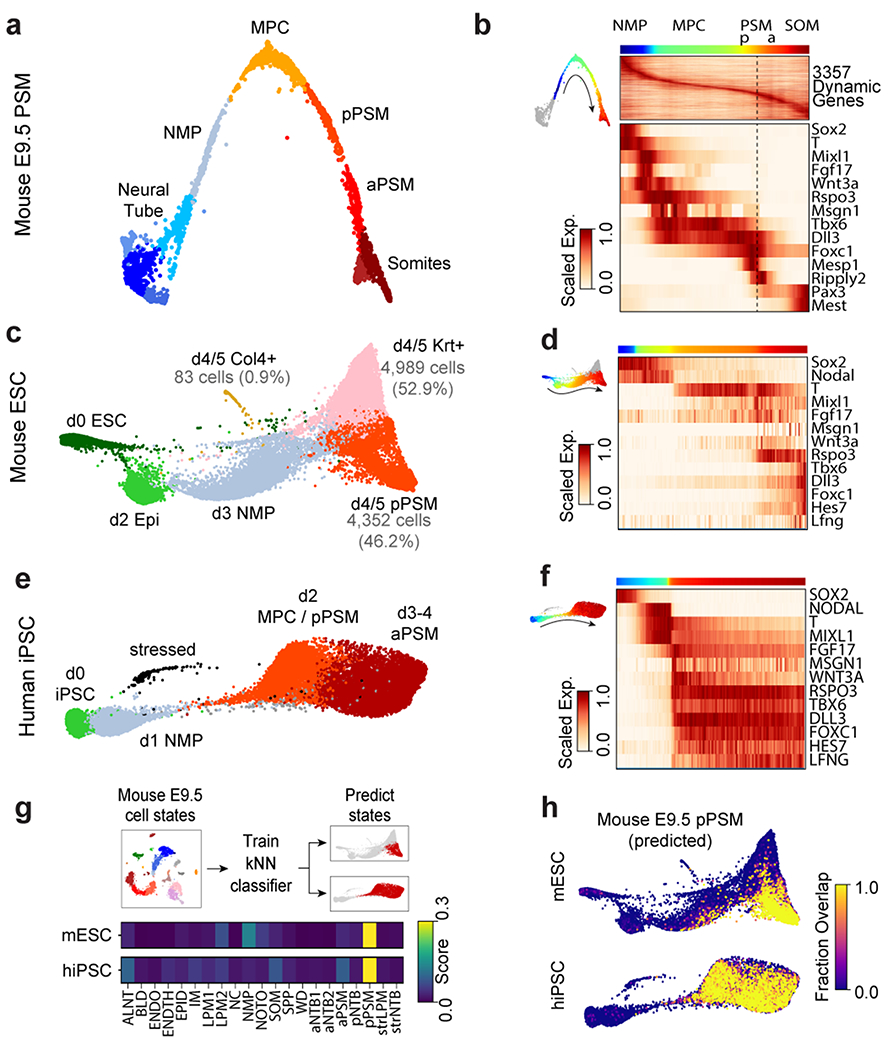
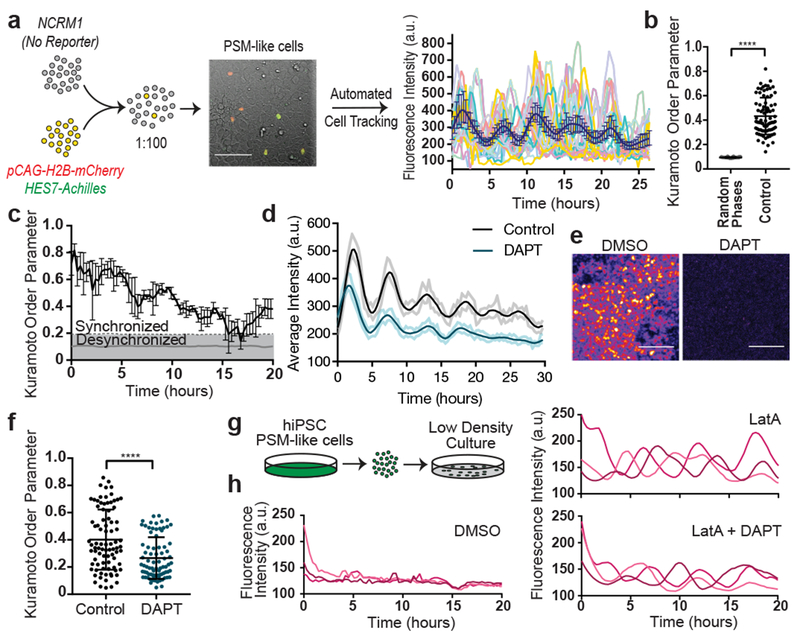
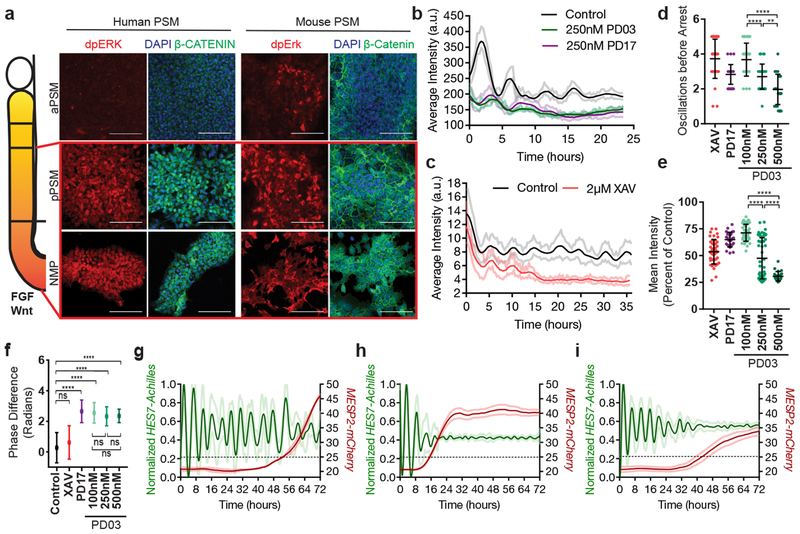
The segmental organization of the vertebral column is established early in embryogenesis, when pairs of somites are rhythmically produced by the presomitic mesoderm (PSM). The tempo of somite formation is controlled by a molecular oscillator known as the segmentation clock1,2. Although this oscillator has been well-characterized in model organisms1,2, whether a similar oscillator exists in humans remains unknown. Genetic analyses of patients with severe spine segmentation defects have implicated several human orthologues of cyclic genes that are associated with the mouse segmentation clock, suggesting that this oscillator might be conserved in humans3. Here we show that human PSM cells derived in vitro-as well as those of the mouse4-recapitulate the oscillations of the segmentation clock. Human PSM cells oscillate with a period two times longer than that of mouse cells (5 h versus 2.5 h), but are similarly regulated by FGF, WNT, Notch and YAP signalling5. Single-cell RNA sequencing reveals that mouse and human PSM cells in vitro follow a developmental trajectory similar to that of mouse PSM in vivo. Furthermore, we demonstrate that FGF signalling controls the phase and period of oscillations, expanding the role of this pathway beyond its classical interpretation in 'clock and wavefront' models1. Our work identifying the human segmentation clock represents an important milestone in understanding human developmental biology.


Figures

Extended data Figure 1.
a, Scheme illustrating the maturation stages of paraxial mesoderm. aPSM, anterior PSM; DF, determination front; MPCs, mesodermal precursor cells; pPSM, posterior PSM; NMPs, neuromesodermal progenitors. b, Top: Immunofluorescence staining for the cadherins Cdh1 and Cdh2 (top), and the pluripotency factor Pou5f1 (bottom) in differentiating mESCs (left) and hiPSCs (right). n=4 independent experiments. Scale bar = 100 μm. c, qRT-PCR for the epiblast marker Fgf5, the NMP/mesodermal marker T/Bra, and the MPC/PSM markers Tbx6, Msgn1 and Rspo3 on days 2-6 of mESC differentiation. Relative expression shown as fold change relative to ESC (day 0). Mean ±SD. n=3 d, Percentage induction of the mESC pMsgn1-Venus reporter and the hiPSC MSGN1-Venus reporter as determined by FACS. Mean ±SD. n=12 (mESC), n=8 (hiPSC) e, Gating strategy and representative FACS plots for quantification of pMsgn1-Venus/MSGN1-Venus induction. f, qRT-PCR for cyclic genes (HES7, LFNG), posterior PSM markers (MSGN1, TBX6, RSPO3), determination front markers (MESP2, RIPPLY2), and anterior PSM markers (MEST, FOXC2) on days 1-4 of human iPSC differentiation. Relative expression shown as fold change relative to iPS (day 0). Mean ±SD. n=3 g, Diagram outlining the targeting strategy used to generate Hes7-Achilles/HES7-Achilles knock-in reporter lines in mouse ESCs and human iPSCs. h, Normalized Hes7-Achilles fluorescence intensity for three mESC-derived PSM cells imaged in CL medium on day 4 of differentiation. n=4 independent experiments i, Representative Fourier transform of Hes7-Achilles oscillations in mESC-derived PSM cells indicating the predominant period. n=19 cells j, Total time spent in the oscillatory state for Hes7-Achilles mESC-derived PSM cells cultured in CL or CLFBR medium from day 4 onwards. Middle hinge corresponds to median, lower and upper hinges correspond to 1st and 3rd quartiles, lower and upper whiskers correspond to minimum and maximum. n=8 (CL), n=12 (CLFBR) k, qRT-PCR comparing relative expression levels of Msgn1, Lfng, T/Bra and Tbx6 in mESC-derived PSM cells cultured in CL or CLFBR medium from day 4 onwards. Relative expression shown as fold change relative to ESC (day 0). Mean ± SD. n=3 l, Snapshots of HES7-Achilles fluorescence in human iPSC-derived PSM cells showing peaks and troughs over the course of 13.5 hours in CL medium on day 2 of differentiation. n=25 independent experiments. Scale bar = 100μm m, Representative quantification of HES7-Achilles fluorescence intensity in a small region of interest from day 2 to day 3 of human iPSC differentiation. n=25 independent experiments n, Representative Fourier transform of HES7-Achilles oscillations indicating the predominant period in day 2 human iPSC-derived PSM cells in CL medium. n=25 independent experiments o, Representative instantaneous frequency in Hertz (calculated by Hilbert transformation) of HES7-Achilles oscillations in human iPSC-derived PSM cells from day 2 to day 3 of differentiation in CL medium. n=25 independent experiments p, Representative instantaneous frequency in Hertz (calculated by Hilbert transformation) of HES7-Achilles oscillations in human iPSC-derived PSM cells from day 2 to day 3 of differentiation in CLFBR medium. n=33 independent experiments q, Quantification of HES7-Achilles fluorescence in human iPSCs differentiated for 48 hours without the BMP inhibitor LDN93189 (CHIR99021 only medium). n=3 independent experiments r, Total number of HES7-Achilles oscillations for human iPSC-derived PSM cells cultured in CL or CLFBR medium from day 2 onwards. Mean ±SD. n=15 s, qRT-PCR comparing relative expression levels of HES7, LFNG, TBX6 and MSGN1 in human iPSC-derived PSM cells cultured in CL or CLFBR medium from day 2 onwards. Relative expression shown as fold change relative to iPS (day 0). Mean ± SD. n=3
Extended Data Figure 2.
a, Pre-filtering of doublet-like cells. UMAP embedding shows all original E9.5 cells (n=5,646), colored by doublet score. Doublet scores indicate the extent to which a given single-cell transcriptome resembles a linear combination of two randomly selected cells (see Wolock et al 2019 and Methods). b, Histogram of doublet scores. Scores >0.24 were filtered from subsequent analyses. c, tSNE embedding of E9.5 cells (n=4,367) post-doublet filtering. Individual cells are colored according to annotated Louvain cluster IDs. d, Top 20 positively enriched transcripts for each Louvain cluster relative to all other clusters, as detected by a two-sided Wilcoxon rank-sum test. Reported transcripts are ranked by FDR-corrected p-values (Benjamini-Hochberg). For exact sample sizes, see Extended Data Table 1.
Extended Data Figure 3.
a,f,k, ForceAtlas2 layouts of mouse E9.5 embryos, mESC, and hiPSC single-cell kNN graphs, colored by cluster ID and collection timepoints as indicated. b,g,l, Confusion matrix plots overlap of cluster and timepoint assignments, row normalized. c,h,m, Top 20 positively enriched transcripts for Louvain clusters relative to all other clusters in each dataset, as detected by a two-sided Wilcoxon rank-sum test. Reported transcripts are ranked by FDR-corrected p-values (Benjamini-Hochberg). For exact sample sizes, see Extended Data Table 1. d,i,n, ForceAtlas2 layouts of single-cell kNN graphs, overlaid with log-normalized transcript counts for indicated genes. e,j,o, Top, colors indicate pseudo-temporal orderings. Bottom, heatmap of selected markers of paraxial mesoderm differentiation. Approximate locations of cluster centers are indicated.
Extended Data Figure 4.
a,c, ForceAtlas2 layouts of indicated single-cell kNN graphs, overlaid with classifier prediction scores. b,d, Heatmap of single-cell HOX gene expression levels for mESC and hiPSC datasets. Columns (individual cells) are grouped by collection timepoint. Rows are individual HOX genes ordered by position. Approximate anatomical positions of HOX paralogs are indicated at right.
Extended Data Figure 5.
a, Scheme showing the insertion of a constitutively expressed pCAG-H2B-mCherry nuclear label in the safe harbor AAVS1 locus in a HES7-Achilles human iPSC background. b, Diffusion (μm2/min) for individual human HES7-Achilles cells automatically tracked over a period of 24 hours. Middle hinge corresponds to median, lower and upper hinges correspond to 1st and 3rd quartiles, lower and upper whiskers correspond to minimum and maximum. n=76 c, Distribution of pairwise instantaneous phase shifts between individual oscillating human HES7-Achilles cells, binned by instantaneous distance between pairs of cells. P-values for the pair-wise Kolmogorov-Smirnov test are as follows: 0.6407, 0.1811, 0.1340, 0.1428, 0.6784, 0.8171. n=1000. d, Distribution of phases along the unit circle at early, middle, and late timepoints. Each dot represents one cell. n=144 cells. e, Illustration of phase determination: representative raw HES7-Achilles fluorescence profile for an automatically tracked cell (left) and corresponding processed signal along with the inferred phase from Hilbert transform (right). f, Heatmap of HES7-Achilles fluorescence intensity over time in automatically tracked cells. Each line represents one cell. n=144 cells. g, Histogram of the time (hours since the onset of imaging) at cell division for manually tracked human HES7-Achilles cells. n=67 h, Left: Immunofluorescence staining for phosphorylated histone H3 (Ser10) in human iPSC-derived PSM cells treated with either vehicle control (DMSO) or 5μM Aphidicolin for 24 or 48 hours, starting on day 2 of differentiation. n=5. Scale bar = 100μm. Right: Quantification of phosphorylated histone H3 (Ser10) nuclei as a percent of total nuclei. Middle hinge corresponds to median, lower and upper hinges correspond to 1st and 3rd quartiles, lower and upper whiskers correspond to minimum and maximum. i, Scatter plot showing the cell cycle time in human iPSC-derived PSM cells cultured in CLFBR medium. Mean±SD. n=26. j, Scatter plot showing the cell cycle time in human iPSC-derived PSM cells cultured in CLFBR medium. Mean±SD. n=26. k, Normalized HES7-Achilles fluorescence intensity profiles for 3 individual human iPSC-derived PSM cells pre-treated with 5μM Aphidicolin for 24 hours. n=6 independent experiments. l, Kuramoto order parameter over 20 hours on day 3 of differentiation for human HES7-Achilles cells treated with vehicle control (DMSO) or 5μM Aphidicolin for 24 hours. Synchronization threshold is shown as the mean±SD of the Kuramoto order parameter for same dataset, but with randomized phases. n=45 cells (Control), 48 cells (Aphi). m, Comparison of the Kuramoto order parameter for oscillating HES7-Achilles treated with vehicle control (DMSO) or 5μM Aphidicolin. Middle hinge corresponds to median, lower and upper hinges correspond to 1st and 3rd quartiles, lower and upper whiskers correspond to minimum and maximum. Paired two-sided t-test p=0.348. n=45 cells (Control), 48 cells (Aphi). n, qRT-PCR for Notch target genes HES7, NRARP and LFNG in human iPSC-derived PSM cells treated with vehicle control (DMSO) or 25μM DAPT on day 2 of differentiation. Mean±SD. n=3. o, Example of HES7-Achilles fluorescence intensity in a small region of interest (ROI) over a period of 45 hours in cells treated with DMSO (vehicle control) or the γ-secretase inhibitor DAPT (25μM) in CLFBR medium. n=16 independent experiments p, Representative example of Hes7-Achilles fluorescence intensity profiles for mESC-derived PSM cells treated with vehicle control (DMSO) or 25μM DAPT. n=13 independent experiments q, Kuramoto order parameter over 20 hours on day 2 of differentiation for human HES7-Achilles cells treated with vehicle control (DMSO) or 25μM DAPT. Synchronization threshold is shown as the mean±SD of the Kuramoto order parameter for same dataset, but with randomized phases. n=131 cells (Control), 110 cells (DAPT). r, Representative immunofluorescence staining for YAP, F-actin (phalloidin) and DAPI nuclear stain in isolated human PSM-like cells treated with either DMSO or Latrunculin A (350nM). Scale bar = 50 μm. n=4 independent experiments. s, ChIP-qPCR fold enrichment of the LFNG and HES7 promoters in chromatin pulled down with an antibody against NOTCH1 relative to isotype IgG controls. Mean ±SD. iPSC control n=4, all other conditions n=3. t, Mean HES7-Achilles fluorescence intensity for isolated human cells cultured with either 350nM Latrunculin A alone or in combination with 25μM DAPT. Middle hinge corresponds to median, lower and upper hinges correspond to 1st and 3rd quartiles, lower and upper whiskers correspond to minimum and maximum. n=18 cells. u, Scatter plot showing the HES7-Achilles oscillatory period for isolated human cells cultured with either 350nM Latrunculin A alone or in combination with 25μM DAPT. Mean ±SD. n= 47 (LatA), 22 (LatA + DAPT) v, Kuramoto order parameter over 18 hours on day 2 of differentiation for human HES7-Achilles cells treated with DMSO, LatA alone or LatA in combination with DAPT. Synchronization threshold is shown as the mean±SD of the Kuramoto order parameter for same dataset, but with randomized phases. n=53 cells (Control), 18 cells (LatA), 18 cells (LatA + DAPT). w, Comparison of the Kuramoto order parameter in confluent HES7-Achilles cells vs. isolated cells treated with either 350nM Latrunculin A alone or in combination with 25μM DAPT. Middle hinge corresponds to median, lower and upper hinges correspond to 1st and 3rd quartiles, lower and upper whiskers correspond to minimum and maximum. Paired one-way ANOVA with Bonferroni correction: Confluent control vs. LatA p=1.16e−6, Confluent control vs. LatA + DAPT p=6.8e−13, LatA vs. LatA + DAPT p=0.304. n=53 cells (Control), 18 cells (LatA), 18 cells (LatA + DAPT).
Extended data Figure 6.
a, Immunofluorescence staining for doubly phosphorylated ERK on Day 2 of differentiation following 3 hours of treatment with either DMSO (vehicle control) or the FGFR inhibitor PD173074 (250 nM). n=4 independent experiments b, Left: qRT-PCR for the FGF ligands FGF17 and FGF8 on days 1-4 of human iPSC differentiation. Relative expression shown as fold change relative to iPS (day 0). Mean ±SD n=3 Right: qRT-PCR for the FGF ligand Fgf8 on days 2-6 of mouse ESC differentiation. Relative expression shown as fold change relative to ESC (day 0). Mean ±SD. n=3 c, Time-course qRT-PCR for the FGF target gene SPRY4 in human iPSC-derived PSM cells during the 10 hours immediately following treatment with either vehicle control (DMSO) or 250nM PD03. Relative expression shown as fold change relative to ESC (day 0). Mean ±SD. n=3 d, Immunofluorescence staining for doubly phosphorylated ERK in human iPSC-derived PSM (top) or mESC-derived PSM (bottom) cells treated with either DMSO or PD03 (250 nM). n=4. e, Immunofluorescence staining for doubly phosphorylated ERK (left), β-catenin and nuclear stain (right) in human iPSC- derived PSM cells treated with vehicle control (DMSO) or 2μM XAV. n=4 independent experiments. Scale bar = 100μm. f, Representative examples of HES7-Achilles fluorescence intensity over the course of 45 hours in a small area of interest within human cultures treated with DMSO (vehicle control), the MAPK inhibitor PD0325901 (250nM), or the FGFR inhibitor PD173074 (250nM) in CLFBR medium. n=16 independent experiments. g, HES7-Achilles fluorescence intensity over the course of 45 hours in a small area of interest within human cultures treated with DMSO (vehicle control), 2μM XAV or 12μM IWR-1 in CLFBR medium. n=3 independent experiments. h, HES7-Achilles oscillatory period of individual cells treated with vehicle control (DMSO), 2μM XAV, 250nM PD17 or 100nM/250nM/500nM PD03 on day 2 of differentiation. Mean±SD. One-way ANOVA p values (ns): 0.9929, 0.4097, 0.9998, 0.9845, 0.7425. n=27 (XAV), n=48 (100nM PD03), n=57 (all others). i, Average fluorescence intensity profiles for automatically tracked individual HES7-Achilles human cells treated with vehicle control (DMSO) or increasing doses of PD03 (100nM, 250nM, 500nM) on day 2 of differentiation. Mean ± 95% CI. n=68 cells (Control), 45 cells (100nM), 35 cells (250nM), 36 cells (500nM). j, Representative examples of HES7-Achilles fluorescence intensity profiles in a small area of interest within human cultures treated with increasing doses of PD03 (100nM, 250 nM, 500nM) or vehicle control (DMSO). n=8 independent experiments. k, Number of HES7-Achilles oscillations before arrest in small areas of interest within cultures treated with increasing doses of PD03 (100nM, 250 nM, 500nM). One-way ANOVA:100nM vs. 250nM p=0.0042, 100nM vs. 500nM p=2.0e−5. n=6. l, Average HES7-Achilles fluorescence intensity over the course of the oscillatory regime (i.e. prior to the arrest of oscillations) in cells treated with either vehicle control (DMSO) or increasing doses of PD03 (100nM, 250 nM, 500nM). Middle hinge corresponds to median, lower and upper hinges correspond to 1st and 3rd quartiles, lower and upper whiskers correspond to minimum and maximum. One-way ANOVA: control vs. 100nM p= 6.7e−17, control vs. 250nM p=6.5e−21, control vs. 500nM p=1.9e−22, 100nM vs. 250nM p=1.1e−17, 100nM vs. 500nM p=2.5e−18. n=6 m, Representative Hes7-Achilles fluorescence intensity profiles for mESC-derived PSM cells treated with either vehicle control (DMSO), 2μM XAV or 100nM/250nM/500nM PD03. n=12 (control, XAV, 100nM PD03), n=10 (250nM, 500nM PD03). n, Histograms showing the instantaneous phase difference relative to control for individual cells treated with vehicle control (DMSO), 2μM XAV, 250nM PD17 or 100nM/250nM/500nM PD03. See “Phase shifts” in methods section for details. n fixed at 11,000 observations. o, Quantification of the average phase difference (degrees) for HES7-Achilles oscillations in cells treated with 250nM PD17 or 100nM/250nM/500nM PD03 relative to control (DMSO) cells. Middle hinge corresponds to median, lower and upper hinges correspond to 1st and 3rd quartiles, lower and upper whiskers correspond to minimum and maximum. n=13 (PD17), n=17 (100nM), n=7 (250nM), n=11 (500nM). p-q, Timelapse qRT-PCR for the cyclic genes HES7 (p) and LFNG (q) in human iPSC-derived PSM cells under control (DMSO) and 250nM PD03 conditions. Samples were taken every 30 minutes immediately following treatment. Relative expression shown as fold change relative to ESC (day 0). Mean ±SD. n=3. r, Outline of the experimental strategy used to assess the effect of FGF inhibition in primary mouse PSM cells carrying the LuVeLu reporter. The tailbud is dissected from E9.5 transgenic embryos and cells are dissociated for seeding on fibronectin micropatterns. Oscillations of the LuVeLu reporter are examined in each micropattern. s, LuVeLu fluorescence intensity profiles in mouse tailbud explant cells cultured on CYTOO micropatterns in CLFBR medium containing DMSO (vehicle control) or increasing doses of PD03 (0.4μM, 0.65μM, 10μM). n=2 independent experiments. t, Number of LuveLu oscillations before arrest in mouse tailbud explant cells cultured on CYTOO micropatterns treated with DMSO (vehicle control) or increasing doses of PD03 (0.4μM, 0.65μM, 10μM). Mean ±SD. One way ANOVA: 0.4μM vs. 0.65μM p=0.0642, 0.4μM vs. 10μM p=8.4e−9, 0.65μM vs. 10μM p=2.9e−6. n=10 micropatterns (0.4μM), n=7 micropatterns (0.65μM, 10μM) u, Average period of LuVeLu oscillations in mouse tailbud explant cells cultured on CYTOO micropatterns treated with DMSO (vehicle control) or increasing doses of PD03 (0.4μM, 0.65μM, 10μM). Mean ±SD. One way ANOVA: control vs. 0.4μM p=0.2785, control vs. 0.65μM p=0.0658, control vs. 10μM p=2.7e−6, 0.4μM vs. 0.65μM p=0.831, 0.4μM vs. 10μM p=3.05e−4, 0.65μM vs. 10μM p=4e−3 . n=18 micropatterns (DMSO), n=16 micropatterns (0.4μM), n=12 micropatterns (0.65μM), n=6 micropatterns (10μM).
Extended Data Figure 7.
a, Snapshots of HES7-Achilles; MESP2-mCherry double reporter cells on days 2-5 of differentiation in CLFBR medium at 0, 20, 45 and 60 hours. Cultures treated with DMSO (control), 25μM DAPT, 2μM XAV and 250nM PD03 are shown. n=10. Scale bar = 100μm. b, Time of MESP2-mCherry expression onset in human iPSC-derived PSM cells treated with vehicle control (DMSO), 2μM XAV, 250nM PD17 or 100nM/250nM/500nM PD03. Expression onset defined by threshold (25 a.u.). Mean ±SD. One-way ANOVA: control vs. XAV p=4.6e−15, control vs. 100nM PD03 p=5.1−17, control vs. 250nM PD03 p=1.3e−17, control vs. 500nM PD03 p= 1.4e−18, 100nM vs. 250nM PD03 p=2.6e−15, 100nM vs. 500nM PD03 p=7.7e−16, 250nM vs. 500nM PD03 p=6.9e−5. n=10. c, HES7-Achilles and MESP2-mCherry fluorescence intensity profiles in small regions of interest within human iPSC-derived PSM cultures treated with 25μM DAPT on days 2-5 of differentiation in CLFBR medium. Mean ±SD. Dotted line denotes threshold for MESP2 activation (25 a.u.). n=15. d, qRT-PCR for the genes HES7, LFNG, MSGN1, TBX6, DUSP6, FOXC2, MESP2 and RIPPLY2 in human iPSC-derived PSM cultures treated for 24 hours with either vehicle control (DMSO) or 250nM PD03 in CLFBR medium. Relative expression shown as fold change relative to iPS (day 0). Mean ± SD. n=3 e, Immunofluorescence staining for TBX6 on day 3 of differentiation (CLFBR medium) in cells treated with either DMSO or PD03 (250 nM). n=4 independent experiments. Scale bar = 100μm.
Figure 1.
Figure 1.. Recapitulation of the mouse and human segmentation clocks in vitro by differentiation of pluripotent stem cells towards PSM fate.
a, Immunofluorescence for stage-specific markers (left) and images of the mESC pMsgn1-Venus/hiPSC MSGN1-Venus reporters (right) in differentiating mouse ESCs and human iPSCs. Scale bar = 100μm. n=7 independent experiments. b, Normalized Hes7-Achilles intensity profiles for three mESC-derived PSM cells imaged in CLFBR medium. n=17 independent experiments c, Period of Hes7-Achilles/HES7-Achilles oscillations in mouse ESC-derived PSM and human iPSC-derived PSM cells cultured in CLFBR medium. Mean ±SD. n=25 d, Heatmap of Hes7-Achilles intensity over time in mESC-derived PSM cells in CLFBR medium. Each row represents one cell. n=15 e, Normalized HES7-Achilles intensity profiles for three human iPSC-derived PSM cells imaged in CLFBR medium. n= 23 independent experiments f, Heatmap of HES7-Achilles intensity over time in human iPSC-derived PSM cells in CLFBR medium. Each row represents one cell. n=15
Figure 2.
Figure 2.. Single cell RNA-sequencing analysis of differentiating mouse and human PSM.
a, Nearest-neighbor (kNN) graph of mouse E9.5 neural tube, PSM, and somite clusters (2,340 cells, 20 PC dimensions), visualized with ForceAtlas2 and colored by Louvain cluster ID. b, Pseudo-temporal ordering of non-neural E9.5 cells. Heatmap illustrates genes with significant dynamic expression ordered by peak expression (see Methods) and selected markers of paraxial mesoderm differentiation. Color bars indicate pseudotemporal position and Louvain cluster assignments. Dotted line marks the determination front (boundary between anterior/posterior PSM). c, Batched-balanced kNN graph of mouse ESC single-cell transcriptomes (21,478 cells), colored by Louvain cluster ID and visualized with ForceAtlas2. Cell numbers for the three terminal day 4/5 states are indicated. d, Pseudo-temporal ordering of mESCs along a path towards the putative d4/5 PSM state. Heatmap shows selected markers of paraxial mesoderm differentiation. e, Batched-balanced kNN graph (ForceAtlas2 layout) of hiPSC single-cell transcriptomes (14,750 cells), colored by Louvain cluster ID. f, Pseudo-temporal ordering of hiPSCs along a path towards the terminal d3/4 PSM state. Heatmap shows selected markers of paraxial mesoderm differentiation. g, Machine-learning classification of human and mouse in vitro cultured cells. A kNN-classifier trained on E9.5 clusters was used to predict identities of terminal in vitro states (inset, red cells). Heatmaps depict fraction of E9.5 assignments for mESC day 4/5 PSM cells and hiPSC (day 2-4 cells). h, Overlay of kNN-classifier scores (fraction of nearest neighbors with the E9.5 ‘pPSM’ label) onto the mESC and hiPSC kNN graphs.
Figure 3.
Figure 3.. Synchronization of individual oscillators within human PSM cultures.
a, Experimental strategy for automated tracking of HES7-Achilles oscillations in individual cells. Scale bar = 100μm b, Kuramoto order parameter for HES7-Achilles cells vs. the same dataset with randomized phases. Mean ±SD. Paired two-sided t-test p=5e−107. n=139 cells. c, Kuramoto order parameter timecourse of HES7-Achilles human PSM cells. Synchronization threshold shown as mean±SD of the Kuramoto order parameter for same dataset, but with randomized phases. n=139 cells d, Average intensity profiles for individual HES7-Achilles human PSM cells treated with vehicle control (DMSO) or 25μM DAPT. Mean ± 95% CI. n=152 cells (Control), 106 cells (DAPT). e, HES7-Achilles fluorescence in human PSM cells following treatment with DMSO or DAPT (25μM). n=9 independent experiments. Scale bar = 100μm f, Kuramoto order parameter for HES7-Achilles cells treated with DMSO or 25μM DAPT. Mean ±SD. Paired two-sided t-test p=2.6e−18. n=131 cells (Control), 110 cells (DAPT). g, Experimental strategy for analysis of oscillations in isolated human PSM cells. h, Representative HES7-Achilles intensity profiles for three isolated human PSM cells in medium containing DMSO, 350nM LatA, or 350nM LatA in combination with 25μM DAPT. n=5 independent experiments.
Figure 4.
Figure 4.. FGF signaling regulates the dynamic properties of the segmentation clock.
a, Left: Scheme illustrating the posterior-to-anterior gradients of FGF and Wnt signaling along the PSM. Right: Immunofluorescence for doubly phosphorylated ERK, β-catenin and DAPI nuclear stain in differentiating human iPSCs and mouse ESCs. n=8 independent experiments. Scale bar = 100μm. b, Average intensity profiles for individual HES7-Achilles human PSM cells treated with vehicle control (DMSO), 250nM PD03 or 250nM PD17. Mean ± 95% CI. n=89 cells (Control), 30 cells (PD03), 34 cells (PD17) c, Average intensity profiles for individual HES7-Achilles human PSM cells treated with vehicle control (DMSO) or 2μM XAV. Mean ± 95% CI. n=67 cells (Control), 29 cells (XAV). d, Number of HES7-Achilles oscillations before arrest in individual human PSM cells treated with 2μM XAV, 250nM PD17 or 100nM/250nM/500nM PD03. Mean ±SD. One-way ANOVA:100nM vs. 250nM p=2.3e−5, 100nM vs. 500nM p=2.2e−10, 250nM vs. 500nM p=1.5e−3. n=34 e, Mean HES7-Achilles intensity for individual HES7-Achilles human PSM cells treated with 2μM XAV, 250nM PD17 or 100nM/250nM/500nM PD03. Mean ±SD. One-way ANOVA: 100nM vs. 250nM p=1.2e−13, 100nM vs. 500nM p=3e−13, 250nM vs. 500nM p=6.9e−6. n=46 (XAV), n=28 (PD17), n=47 (100nM PD03), n=64 (250nM PD03), n=26 (500nM PD03). f, Summary statistics comparing the instantaneous absolute phase difference relative to control for individual cells treated with vehicle control (DMSO), 2μM XAV, 250nM PD17 or 100nM/250nM/500nM PD03. Mean ±SD. One-way ANOVA: control vs. XAV p= 0.0578, control vs. PD17 p=9.2e-8, control vs. 100nM PD03 p=1.3e-14, control vs. 250nM PD03 p=1.1e−8, control vs. 500nM PD03 p=1.1e−5, 100nM vs. 250nM PD03 p=0.8338, 100nM vs. 500nM PD03 p=0.0601, 250nM vs. 500nM p=0.061. n fixed at 11,000 observations. See Extended data Fig. 6n for full histograms. g-i, HES7-Achilles and MESP2-mCherry intensity profiles in small regions of interest within human PSM cultures. Mean ±SD. Dotted line denotes threshold for MESP2 activation (25 a.u.). g, Vehicle control (DMSO) h, 250nM PD03 i, 2μM XAV. n=15.

Comment in

References

    1. Hubaud A & Pourquie O Signalling dynamics in vertebrate segmentation. Nature reviews. Molecular cell biology 15, 709–721, doi:10.1038/nrm3891 (2014). - DOI - PubMed
    1. Oates AC, Morelli LG & Ares S Patterning embryos with oscillations: structure, function and dynamics of the vertebrate segmentation clock. Development 139, 625–639, doi:10.1242/dev.063735 (2012). - DOI - PubMed
    1. Sparrow DB et al. Mutation of the LUNATIC FRINGE gene in humans causes spondylocostal dysostosis with a severe vertebral phenotype. American journal of human genetics 78, 28–37 (2006). - PMC - PubMed
    1. Chal J et al. Differentiation of pluripotent stem cells to muscle fiber to model Duchenne muscular dystrophy. Nature biotechnology 33, 962–969, doi:10.1038/nbt.3297 (2015). - DOI - PubMed
    1. Hubaud A, Regev I, Mahadevan L & Pourquie O Excitable Dynamics and Yap-Dependent Mechanical Cues Drive the Segmentation Clock. Cell 171, 668–682 e611, doi:10.1016/j.cell.2017.08.043 (2017). - DOI - PMC - PubMed

Substances