. 2020 May;41(7):1934-1949.
doi: 10.1002/hbm.24922. Epub 2020 Jan 9.

Mapping neural dynamics underlying saccade preparation and execution and their relation to reaction time and direction errors

Affiliations

Mapping neural dynamics underlying saccade preparation and execution and their relation to reaction time and direction errors

Sonya Bells et al. Hum Brain Mapp. 2020 May.

Abstract

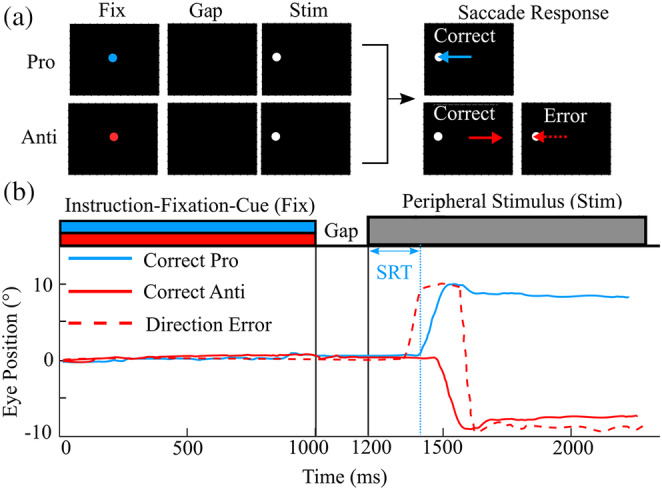
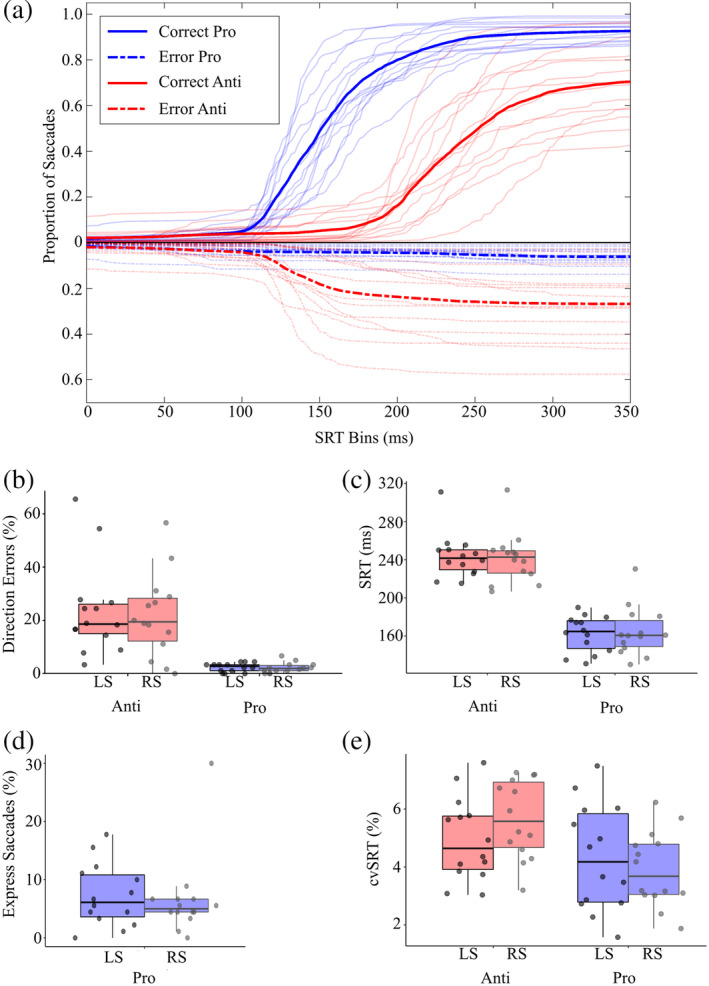
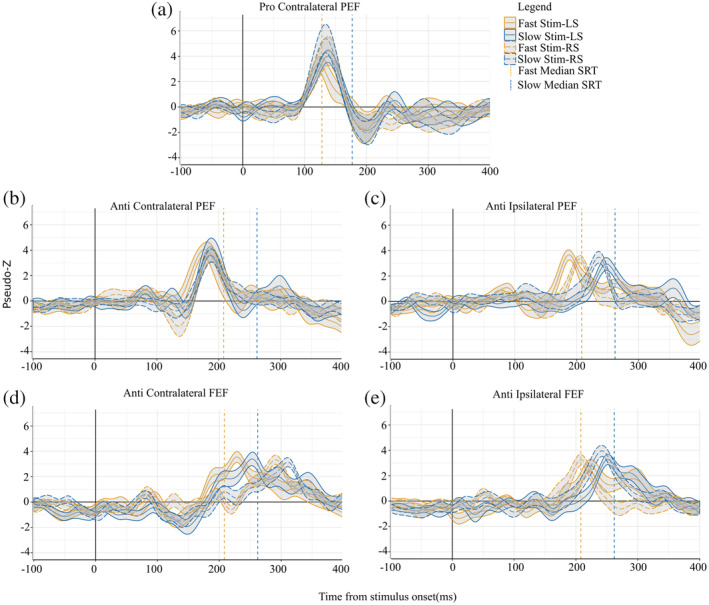
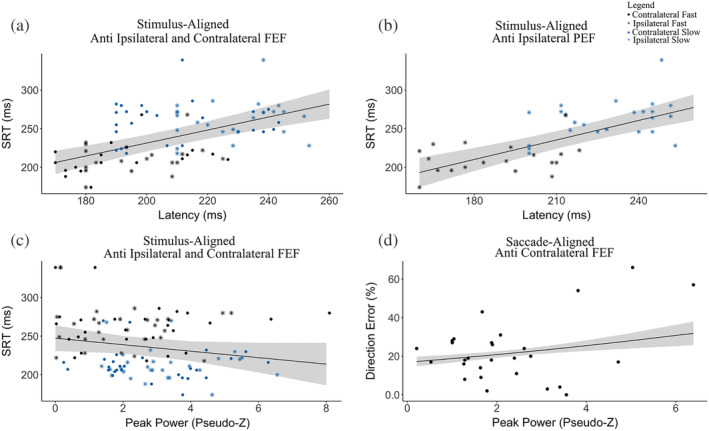
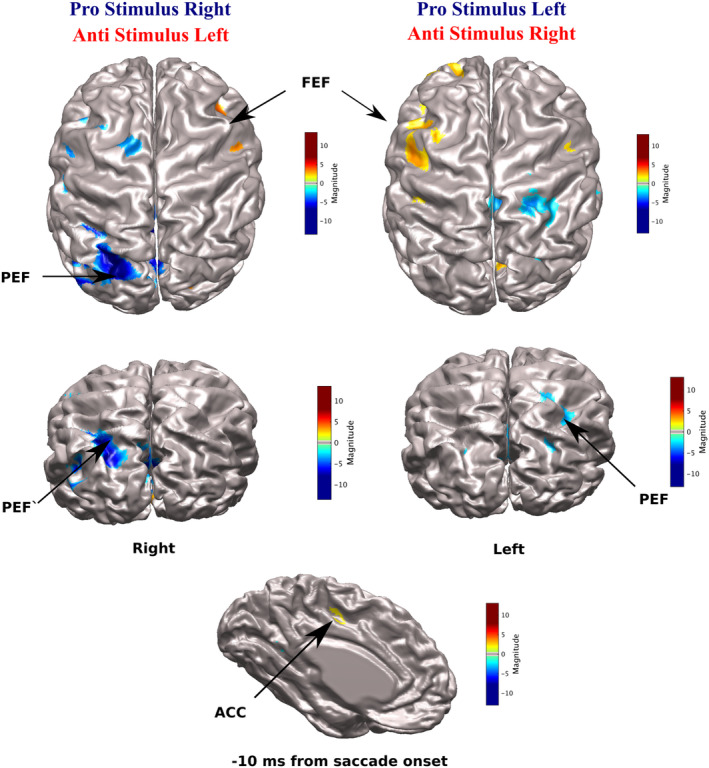
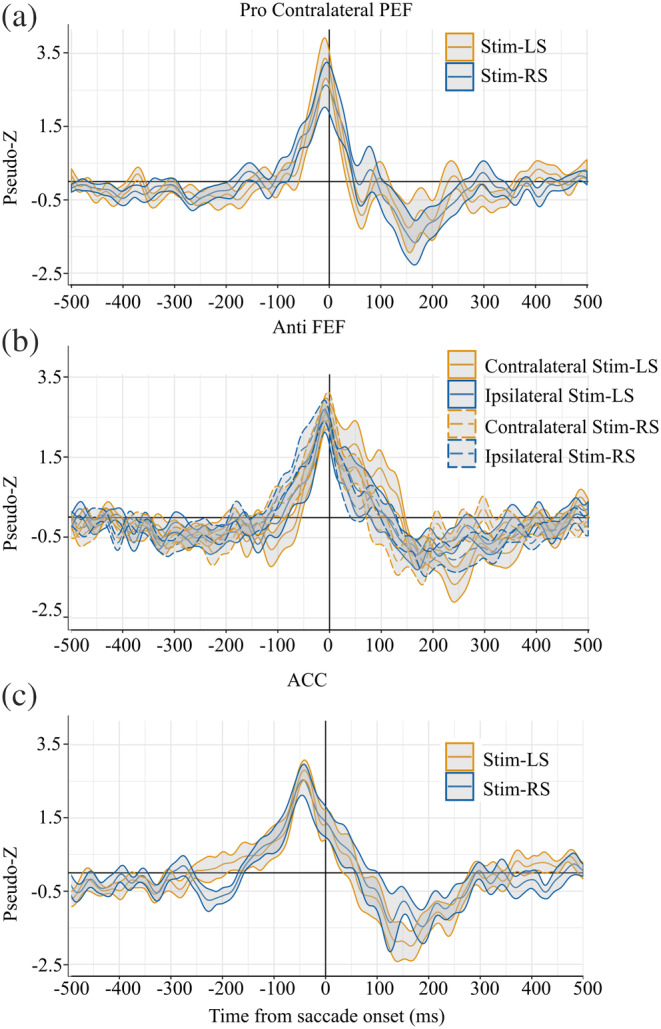
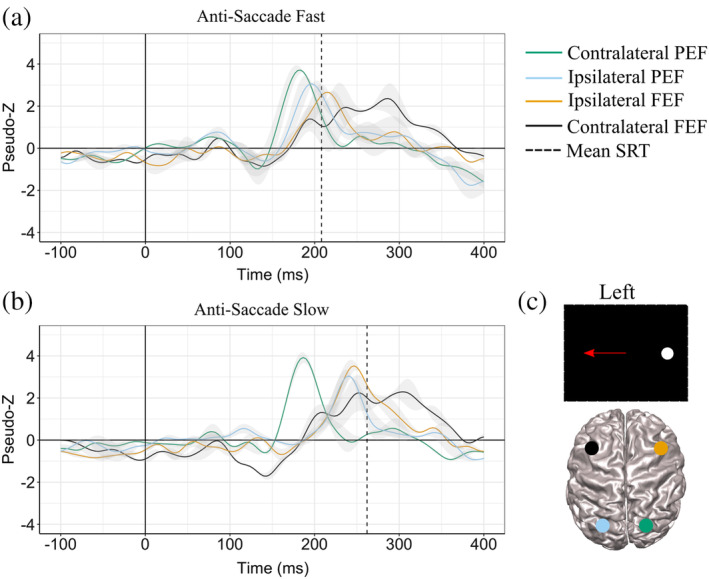
Our ability to control and inhibit automatic behaviors is crucial for negotiating complex environments, all of which require rapid communication between sensory, motor, and cognitive networks. Here, we measured neuromagnetic brain activity to investigate the neural timing of cortical areas needed for inhibitory control, while 14 healthy young adults performed an interleaved prosaccade (look at a peripheral visual stimulus) and antisaccade (look away from stimulus) task. Analysis of how neural activity relates to saccade reaction time (SRT) and occurrence of direction errors (look at stimulus on antisaccade trials) provides insight into inhibitory control. Neuromagnetic source activity was used to extract stimulus-aligned and saccade-aligned activity to examine temporal differences between prosaccade and antisaccade trials in brain regions associated with saccade control. For stimulus-aligned antisaccade trials, a longer SRT was associated with delayed onset of neural activity within the ipsilateral parietal eye field (PEF) and bilateral frontal eye field (FEF). Saccade-aligned activity demonstrated peak activation 10ms before saccade-onset within the contralateral PEF for prosaccade trials and within the bilateral FEF for antisaccade trials. In addition, failure to inhibit prosaccades on anti-saccade trials was associated with increased activity prior to saccade onset within the FEF contralateral to the peripheral stimulus. This work on dynamic activity adds to our knowledge that direction errors were due, at least in part, to a failure to inhibit automatic prosaccades. These findings provide novel evidence in humans regarding the temporal dynamics within oculomotor areas needed for saccade programming and the role frontal brain regions have on top-down inhibitory control.

Keywords: antisaccade; frontal cortex; inhibition; magnetoencephalography; parietal cortex.


Figures

Figure 1
Figure 1
Pro/antisaccade task. (a) Representation of stimuli for two of the four trial types. A central instructional‐fixation cue (Fix) was presented for 1,000ms. A green Fix instructed a pro trial (blue) and a red instructed an antitrial. This was followed by a gap period (black screen) of 200ms and then a white peripheral stimulus (Stim) 10° either left or right of central for 1,000ms (stimulus on the right is not shown). The blue arrow indicates a correct prosaccade and the solid red arrow indicates a correct anti saccade, while the dashed red arrow indicates a direction error. (b) Representation of task timing and sample eye traces depicting a correct prosaccade trials (solid blue), a correct antisaccade (solid red), and a direction error (dashed red). Saccade reaction time (SRT) is the time between when the Stim was displayed and the start of a saccadic movement
Figure 2
Figure 2
Eye movement behavioral data. (a) Cumulative histograms of SRT for prosaccade (light gray) and antisaccade (black) saccade distributions for all participants (thin lines) and the group average (thick lines). Positive Y values indicate correct saccades (solid lines), whereas negative Y vales indicate direction errors (dashed lines). (b) Mean percentage of direction errors (a saccade away from stimulus on prosaccade trial, toward stimulus on antisaccade trial) for stimuli on the left side (LS) and right side (RS). (c) Mean SRTs on correct trials for stimuli on the LS and RS. (d) Mean percentage of express saccades (90–135ms) for stimuli on the LS and RS. (e) Mean inter‐participant coefficient of variation in SRT (cvSRT) for stimuli on the LS and RS. SRT, saccade reaction time
Figure 3
Figure 3
ERB Virtual‐Sensors (1–30Hz) from stimulus aligned trials (where 0 in the above plots are stimulus onset). All plots have both fast (orange) and slow (blue) virtual sensors for both left and right stimulus. Group median fast SRT is the orange vertical dashed line and group median slow SRT is the blue dashed vertical line for the plots corresponding task: either prosaccade or antisaccades. Shading around virtual sensor lines is standard error. (a) Peaks within contralateral PEF for prosaccade trials (fast and slow; stimulus on the right and left). (b) Peaks within contralateral PEF from antisaccade trials (fast and slow; stimulus on the right and left). (c) Peaks within ipsilateral PEF from antisaccade trials (fast and slow; stimulus on the right and left). (d) Peaks within ipsilateral FEF relative to the stimulus from antisaccade trials. (e) Peaks within contralateral FEF relative to the stimulus from antisaccade trials. ERB, event‐related beamforming; FEF, frontal eye field PEF; PEF, parietal eye field; SRT, saccade reaction time
Figure 4
Figure 4
Plots from GLM fits between antisaccade measures (direction errors and SRT) and ERB measures (latency or mean peak pseudo‐Z) during antisaccade preparation (stimulus‐aligned) (a–c) and execution (saccade‐aligned) (d). (a) SRT and latency of peaks within ipsilateral and contralateral FEF (b) SRT and latency of peaks within ipsilateral PEF. (c) SRT and mean peak power pseudo‐Z within ipsilateral and contralateral FEF (d) Percent direction errors and mean peak power pseudo‐Z within contralateral FEF. GLM, general linear model; ERB, event‐related beamforming; FEF, frontal eye field PEF; PEF, parietal eye field; SRT, saccade reaction time
Figure 5
Figure 5
CIVET‐generated surface images with imposed ERB Beamforming contrast images of antisaccade (red) and prosaccade (blue) trials during saccade execution (saccade‐aligned). Virtual sensors were extracted FEF peaks (mean Talairach coordinates; left: x = −25, y = 2, z = 40; right: x = 26, y = 1, z = 40) and ACC peak (mean Talairach coordinates; x = 2, y = −4, z = 41) for antisaccade trials and PEF peaks (mean Talairach coordinates; left: x = −26, y = −57, z = 37; right: x = 20, y = −60, z = 35) in prosaccade trials at their corresponding peaks at 10ms before saccade movement. ERB, event‐related beamforming; FEF, frontal eye field PEF; PEF, parietal eye field; SRT, saccade reaction time
Figure 6
Figure 6
ERB Virtual‐Sensors (1–30Hz) from saccade‐aligned trials. Shading around virtual sensor lines is standard error. (a) Peaks within contralateral PEF were localized within prosaccade trails. (b) Peaks within contralateral and ipsilateral FEF were localized within antisaccade trials. (c) Peaks within the ACC were localized within antisaccade trials. ERB, event‐related beamforming; FEF, frontal eye field PEF; PEF, parietal eye field; SRT, saccade reaction time
Figure 7
Figure 7
ERB Virtual‐Sensors (1–30Hz) from stimulus aligned antisaccade trials (where 0 in the above plots are stimulus onset). Plots show contralateral and ipsilateral PEF and FEF time courses for fast (a) and slow (b) trials averaged over left and right stimulus. Group median fast SRT is the black vertical dashed line in (a) and group median slow SRT is the black dashed vertical line in (b). (c) Is a representation of contralateral and ipsilateral PEF and FEF areas during left stimulus trial. ERB, event‐related beamforming; FEF, frontal eye field PEF; PEF, parietal eye field; SRT, saccade reaction time

References

    1. Alahyane, N. , Brien, D. C. , Coe, B. C. , Stroman, P. W. , & Munoz, D. P. (2014). Developmental improvements in voluntary control of behavior: Effect of preparation in the fronto‐parietal network? NeuroImage, 98, 103–117. 10.1016/j.neuroimage.2014.03.008 - DOI - PubMed
    1. Amador, N. , Schlag‐Rey, M. , & Schlag, J. (2004). Primate Antisaccade. II. Supplementary eye field neuronal activity predicts correct performance. Journal of Neurophysiology, 91, 1672–1689. - PubMed
    1. Amita, H. , Kim, H. F. , Smith, M. K. , Gopal, A. , & Hikosaka, O. (2019). Neuronal connections of direct and indirect pathways for stable value memory in caudal basal ganglia. The European Journal of Neuroscience, 49, 712–725. - PMC - PubMed
    1. Ashburner, J. (2009). Computational anatomy with the SPM software. Magnetic Resonance Imaging, 27, 1163–1174. 10.1016/j.mri.2009.01.006 - DOI - PubMed
    1. Baizer, J. S. , Ungerleider, L. G. , & Desimone, R. (1991). Organization of Visual Inputs to the inferior parietal cortex in macaques. The Journal of Neuroscience, 11, 168–190. - PMC - PubMed

Publication types