. 2020 Mar;98(2):131-145.
doi: 10.1002/cyto.b.21860. Epub 2020 Jan 9.

Profiling myelodysplastic syndromes by mass cytometry demonstrates abnormal progenitor cell phenotype and differentiation

Affiliations

Profiling myelodysplastic syndromes by mass cytometry demonstrates abnormal progenitor cell phenotype and differentiation

Gregory K Behbehani et al. Cytometry B Clin Cytom. 2020 Mar.

Abstract

Background: We sought to enhance the cytometric analysis of myelodysplastic syndromes (MDS) by performing a pilot study of a single cell mass cytometry (MCM) assay to more comprehensively analyze patterns of surface marker expression in patients with MDS.

Methods: Twenty-three MDS and five healthy donor bone marrow samples were studied using a 34-parameter mass cytometry panel utilizing barcoding and internal reference standards. The resulting data were analyzed by both traditional gating and high-dimensional clustering.

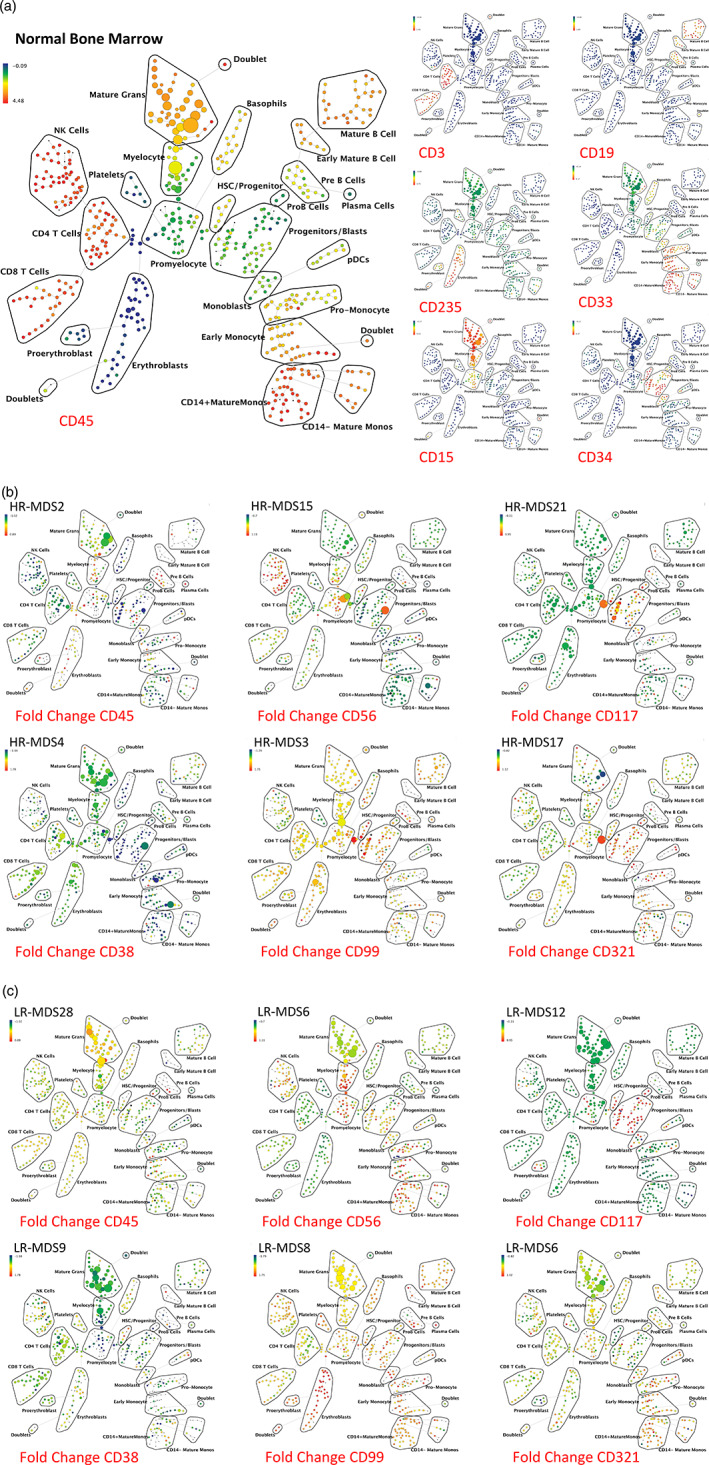
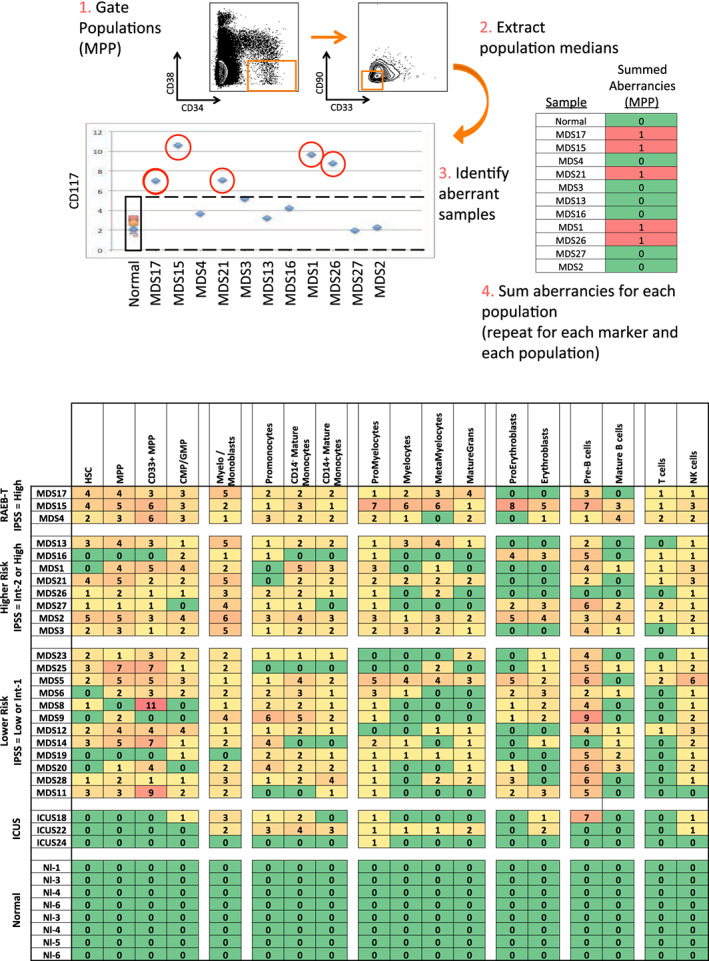
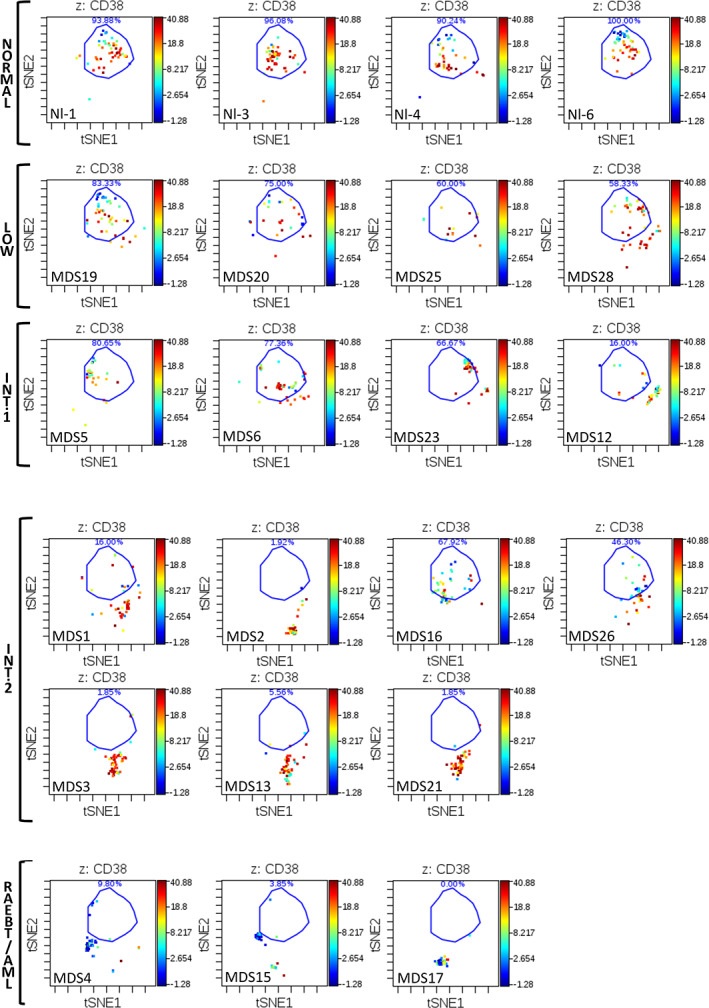
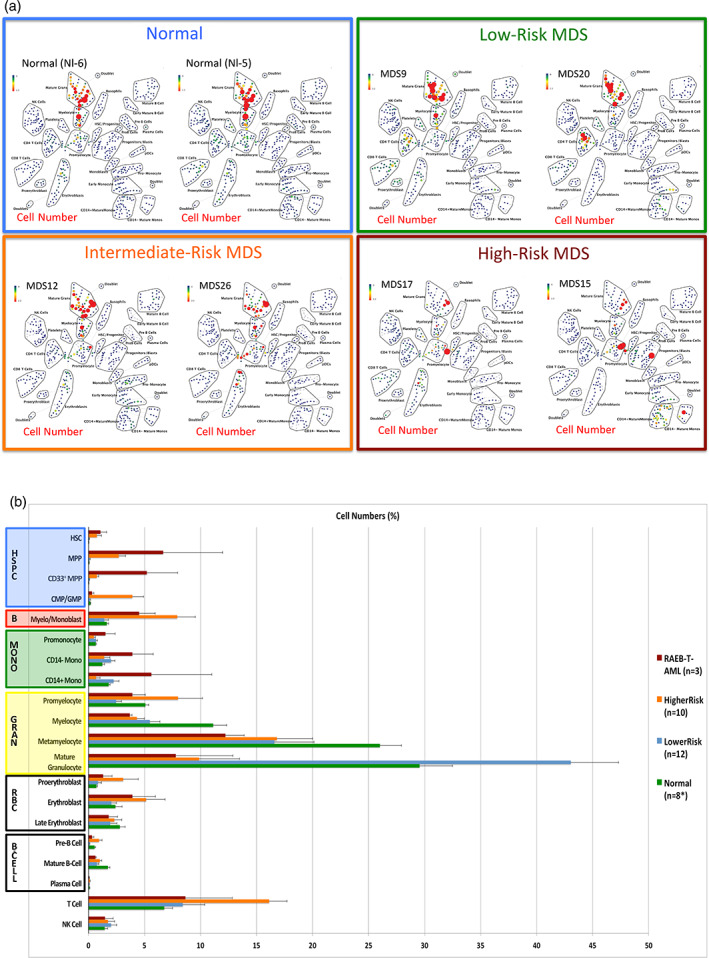
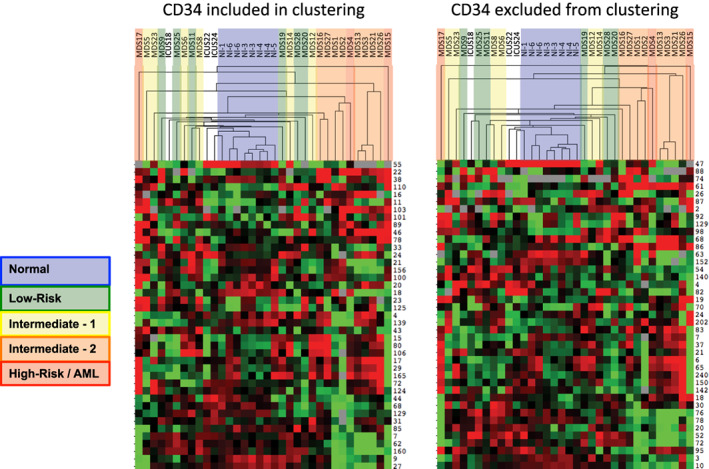
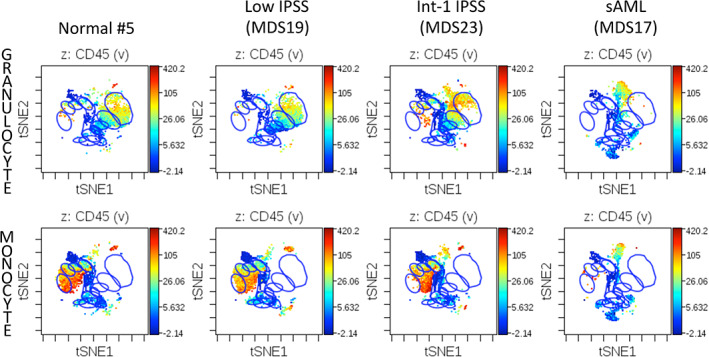
Results: This high-dimensional assay provided three major benefits relative to traditional cytometry approaches: First, MCM enabled detection of aberrant surface maker at high resolution, detecting aberrancies in 27/31 surface markers, encompassing almost every previously reported MDS surface marker aberrancy. Additionally, three previously unrecognized aberrancies in MDS were detected in multiple samples at least one developmental stage: increased CD321 and CD99; and decreased CD47. Second, analysis of the stem and progenitor cell compartment (HSPCs), demonstrated aberrant expression in 21 of the 23 MDS samples, which were not detected in three samples from patients with idiopathic cytopenia of undetermined significance. These immunophenotypically abnormal HSPCs were also the single most significant distinguishing feature between clinical risk groups. Third, unsupervised clustering of high-parameter MCM data allowed identification of abnormal differentiation patterns associated with immunophenotypically aberrant myeloid cells similar to myeloid derived suppressor cells.

Conclusions: These results demonstrate that high-parameter cytometry methods that enable simultaneous analysis of all bone marrow cell types could enhance the diagnostic utility of immunophenotypic analysis in MDS.


Conflict of interest statement

G.K.B. and G.P.N. have provided paid consulting to Fluidigm Sciences. G.P.N. has equity ownership of Fluidigm Sciences. Other authors disclose no potential conflicts of interest.

Figures

Figure 1
Figure 1
SPADE analysis enables detection of aberrant surface marker expression patterns. (a) SPADE plots of normal bone marrow sample #6. SPADE clustering was performed on all samples (normal and MDS) simultaneously to generate a single tree structure for all samples. All of the cell events from each sample were then mapped to the common tree structure. Each cell cluster (node) of the SPADE tree in (a) is colored for the median expression of the indicated markers from low (blue) to high (red). (b) SPADE tree colored for the fold change in each cell node for each of the indicated markers relative to the average of the eight healthy donor samples for the same node. Cell nodes in (b) are colored from lowest expression relative to normal (blue) to highest expression relative to normal (red); yellow and light green colors indicate no change in expression relative the average of the control samples. These can be compared to the normal samples shown in Figure S4. HR indicates higher‐risk MDS (IPSS of Int‐2 or High) LR indicates lower‐risk MDS (IPSS of low or Int‐1). The eight replicate control samples came from five healthy donors. The size of each node is correlated to the fraction of cells mapping to the node; however, a minimum size was enforced for most nodes to allow visualization of node color. Immunophenotypic grouping of nodes was performed manually on the basis of the median marker expression level of each node, and based on analysis of the relevant biaxial plots (e.g., CD38 vs. CD34) [Color figure can be viewed at wileyonlinelibrary.com]
Figure 2
Figure 2
Systematic detection of multiple small aberrancies defines large immunophenotypic changes across hematopoiesis in patients with MDS. (a) Method for defining aberrant marker expression. All immunophenotypic gates were defined on the basis of the normal samples and the same gates were applied to the each of the MDS samples. Once each population was gated, the median expression of each of the 31 surface markers was extracted and compared to the median expression in the eight samples from five healthy donors for each gated population. MDS samples that were outside twofold the total variance of the normal samples were considered to be aberrant for that marker (CD117 is shown as an example). (b) The total number of aberrant markers (of 31 measured markers) was summed for each population and each patient. Each box is colored for the number of the 31 markers that was aberrant for each patient (rows) in each gated immunophenotypic population (columns). The color scale ranges from green indicating no aberrant marker expression to the highest numbers of aberrancies colored red. The exact number of aberrant markers expressed (of the 31 tested) is printed in each box. The high rates of aberrancy observed in the pre‐B cell population may be due in part to contamination of this gate with dimly CD19‐positive malignant myeloid cells due to the limited number of markers defining this immunophenotypic subset (CD19 and CD10) and to the relatively dim staining of these antibodies in normal cells. Because the normal reference range used for this analysis was larger than the absolute variance of the healthy donor samples; no aberrancies were observed in the healthy donor control samples by definition. Note that samples MDS3, MDS13, and MDS21 come from serial biopsies of the same patient (each several months apart) and demonstrate consistent properties [Color figure can be viewed at wileyonlinelibrary.com]
Figure 3
Figure 3
viSNE analysis of CD34 + CD38low subset reveals distinct immunophenotypic patterns in high‐dimensional space. Each sample was analyzed by viSNE (up to 5,000 sampled events per individual) using 19 dimensions (Table S1). A gate (light blue line) encompassing the vast majority of normal CD34 + CD38low events is shown for reference. The MDS subtype and sample is indicated for each viSNE map. Each cell event is colored for its expression level of CD38 from blue (0 ion counts) to red (approximately 40 ion counts). Red cell events still fall within the CD34+CD38low gate and demonstrated dim CD38 expression. Note that samples MDS3, MDS13, and MDS21 come from serial biopsies of the same patient (each several months apart) and demonstrate consistent properties
Figure 4
Figure 4
Distribution of cell frequency across hematopoietic development correlates with MDS risk. (a) SPADE tree colored for the fraction of total cells in each node from lowest (blue) to highest (red). The size of each node is correlated to the fraction of cells mapping to the node; however, a minimum size was enforced for most nodes to allow visualization of node color. (b) The frequency of cells in the indicated (manually gated) stem and progenitor cell compartments for patients of each MDS risk group. Error bars indicate standard errors of the means. Asterisk denotes the eight replicate normal samples came from five donors [Color figure can be viewed at wileyonlinelibrary.com]
Figure 5
Figure 5
Clustering of cell frequency across SPADE nodes in MDS and control samples groups control samples and MDS samples into groups of similar clinical risk. SPADE analysis of total events from each MDS and control sample was performed, and the frequency of cell events within each cluster was extracted from the resulting SPADE trees. The cell frequency by node was then entered into a biaxial clustering analysis (similar to gene expression array analysis). A portion of the cell frequency heat map is shown, each row represents the relative cell frequency in the indicated SPADE node for each sample (columns). Red indicates higher cell fractions and green lower cell fractions. The dendrogram at the top of the figure demonstrates how the different MDS and control samples grouped together. Each sample is colored by its clinical risk as indicated. The analysis was performed once with CD34 used for generation of the SPADE tree and then again with CD34 ignored during SPADE tree generation. In both analyses, patients with higher clinical risk cluster further from the normal samples. Note that samples MDS3, MDS13, and MDS21 come from serial biopsies of the same patient (each several months apart) and demonstrate consistent properties [Color figure can be viewed at wileyonlinelibrary.com]
Figure 6
Figure 6
Developmental progression in control and MDS samples during granulocyte and monocyte differentiation. Blue gates on the viSNE projection show the positions of the normal immunophenotypic developmental stages as described in Figure S10

Similar articles

Cited by

References

    1. Bandura, D. R. , Baranov, V. I. , Ornatsky, O. I. , Antonov, A. , Kinach, R. , Lou, X. , … Tanner, S. D. (2009). Mass cytometry: Technique for real time single cell multitarget immunoassay based on inductively coupled plasma time‐of‐flight mass spectrometry. Analytical Chemistry, 81(16), 6813–6822. - PubMed
    1. Behbehani, G. K. , Bendall, S. C. , Clutter, M. R. , Fantl, W. J. , & Nolan, G. P. (2012). Single‐cell mass cytometry adapted to measurements of the cell cycle. Cytometry. Part A, 81(7), 552–566. - PMC - PubMed
    1. Behbehani, G. K. , Samusik, N. , Bjornson, Z. B. , Fantl, W. J. , Medeiros, B. C. , & Nolan, G. P. (2015). Mass Cytometric functional profiling of acute myeloid leukemia defines cell‐cycle and Immunophenotypic properties that correlate with known responses to therapy. Cancer Discovery, 5(9), 988–1003. - PMC - PubMed
    1. Behbehani, G. K. , Thom, C. , Zunder, E. R. , Finck, R. , Gaudilliere, B. , Fragiadakis, G. K. , … Nolan, G. P. (2014). Transient partial permeabilization with saponin enables cellular barcoding prior to surface marker staining. Cytometry. Part A, 85(12), 1011–1019. - PMC - PubMed
    1. Bendall, S. C. , Simonds, E. F. , Qiu, P. , Amir, E. A. D. , Krutzik, P. O. , Finck, R. , … Nolan, G. P. (2011). Single‐cell mass cytometry of differential immune and drug responses across a human hematopoietic continuum. Science, 332(6030), 687–696. - PMC - PubMed

Publication types