Review
. 2020 Jan-Feb;40(1):200-222.
doi: 10.1148/rg.2020190070.

Multimodality Imaging of Dementia: Clinical Importance and Role of Integrated Anatomic and Molecular Imaging

Affiliations
Review

Multimodality Imaging of Dementia: Clinical Importance and Role of Integrated Anatomic and Molecular Imaging

Kunal P Patel et al. Radiographics. 2020 Jan-Feb.

Abstract

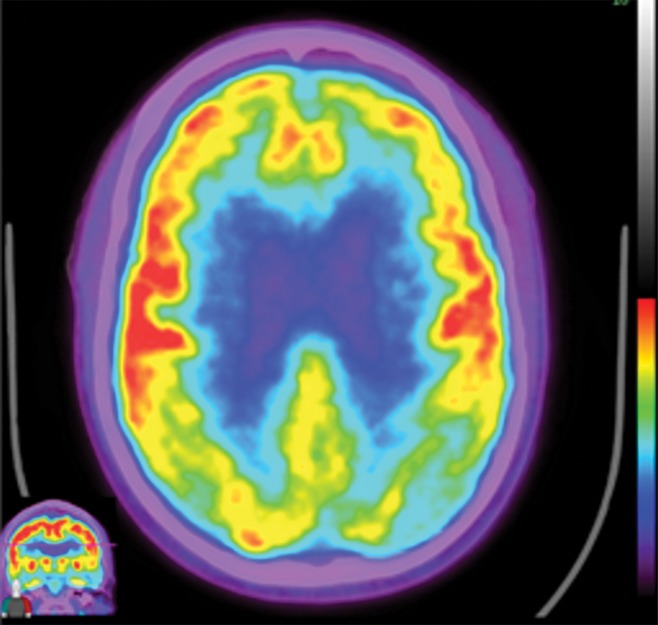
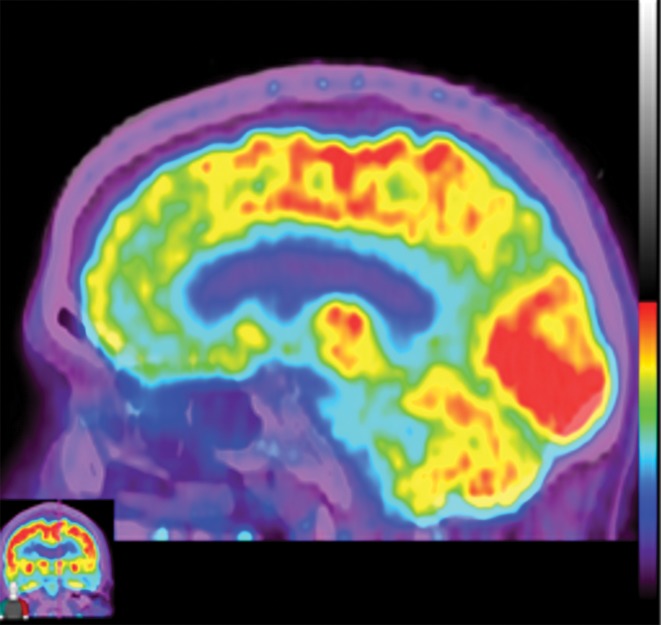
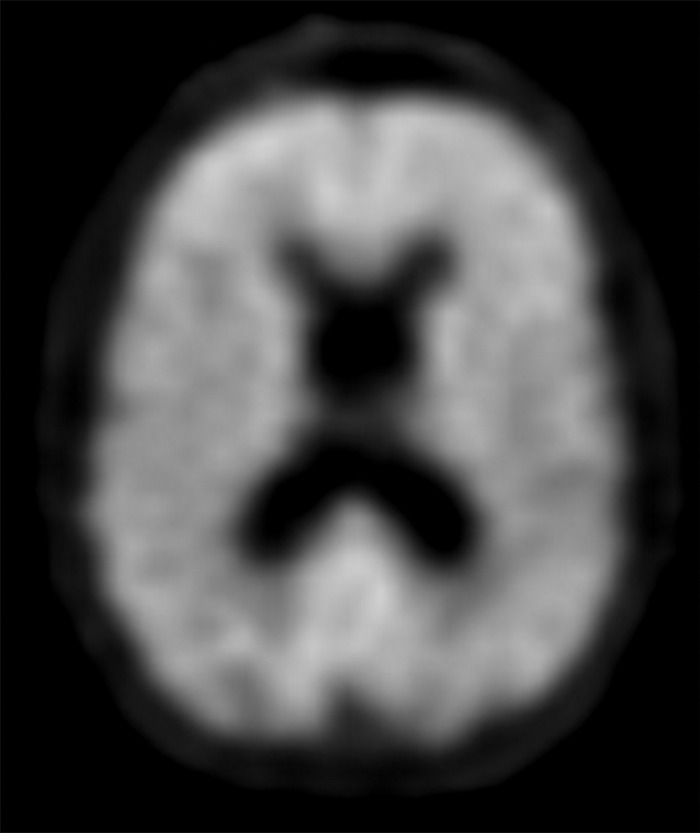
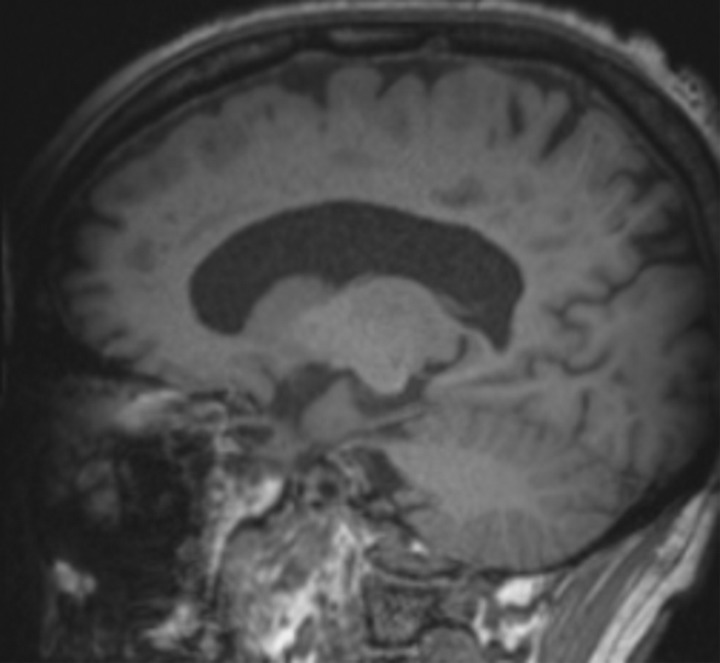
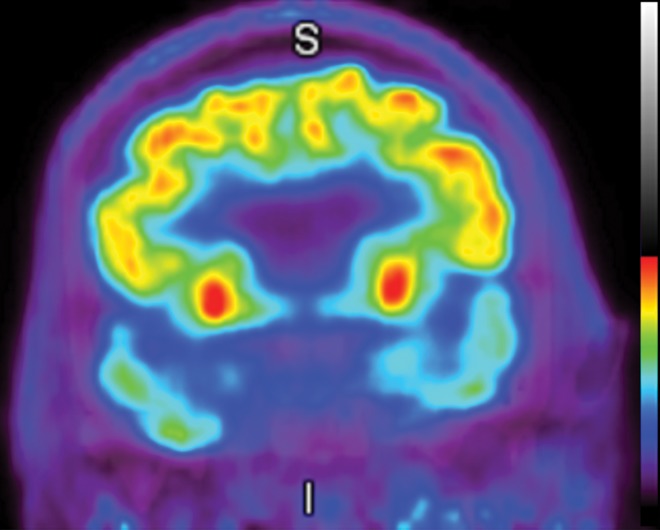
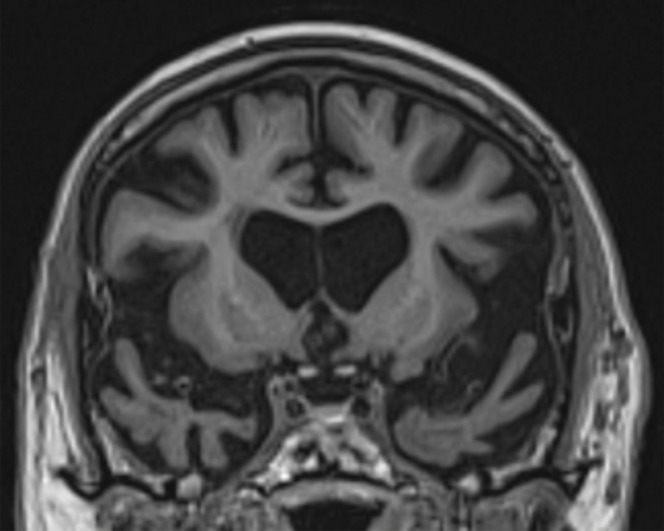
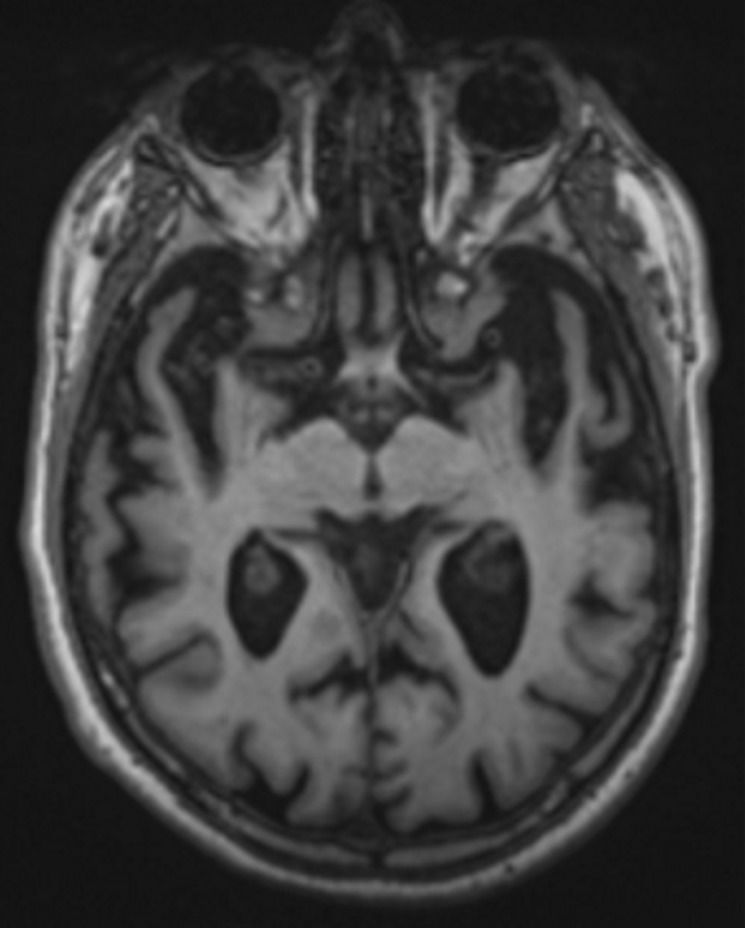
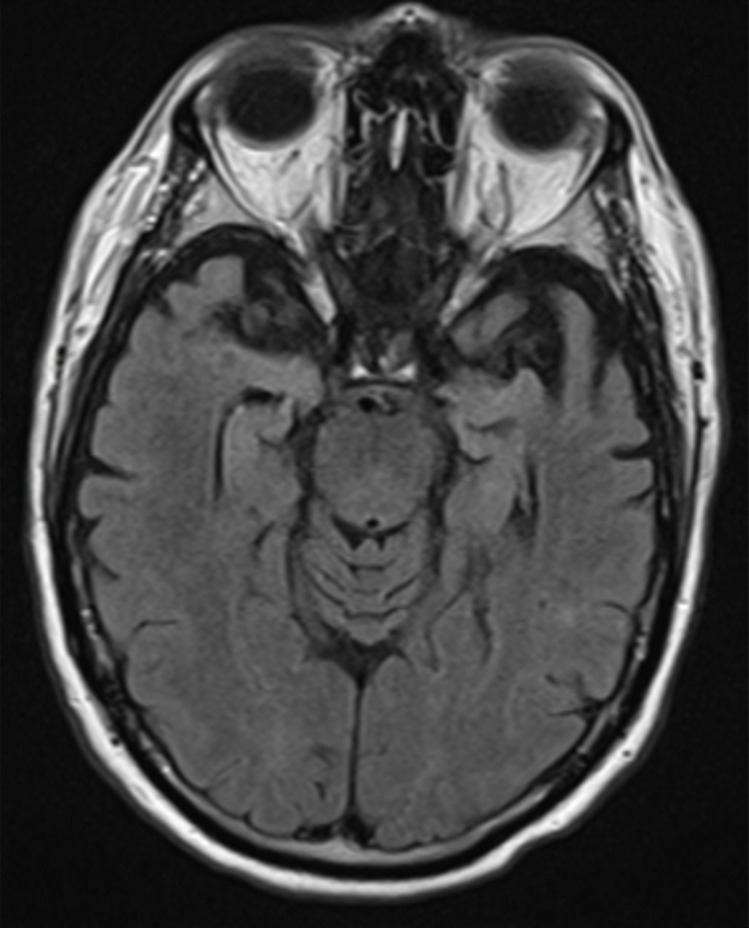
Neurodegenerative diseases are a devastating group of disorders that can be difficult to accurately diagnose. Although these disorders are difficult to manage owing to relatively limited treatment options, an early and correct diagnosis can help with managing symptoms and coping with the later stages of these disease processes. Both anatomic structural imaging and physiologic molecular imaging have evolved to a state in which these neurodegenerative processes can be identified relatively early with high accuracy. To determine the underlying disease, the radiologist should understand the different distributions and pathophysiologic processes involved. High-spatial-resolution MRI allows detection of subtle morphologic changes, as well as potential complications and alternate diagnoses, while molecular imaging allows visualization of altered function or abnormal increased or decreased concentration of disease-specific markers. These methodologies are complementary. Appropriate workup and interpretation of diagnostic studies require an integrated, multimodality, multidisciplinary approach. This article reviews the protocols and findings at MRI and nuclear medicine imaging, including with the use of flurodeoxyglucose, amyloid tracers, and dopaminergic transporter imaging (ioflupane). The pathophysiology of some of the major neurodegenerative processes and their clinical presentations are also reviewed; this information is critical to understand how these imaging modalities work, and it aids in the integration of clinical data to help synthesize a final diagnosis. Radiologists and nuclear medicine physicians aiming to include the evaluation of neurodegenerative diseases in their practice should be aware of and familiar with the multiple imaging modalities available and how using these modalities is essential in the multidisciplinary management of patients with neurodegenerative diseases.©RSNA, 2020.


Figures

Figure 1a.
Figure 1a.
Various causes of cognitive impairment. (a) Coronal T2-weighted MR image in a patient with progressive memory loss shows an extra-axial mass (arrow) with broad-based dural attachment, a finding most compatible with meningioma. Note the marked right frontal vasogenic edema and leftward midline shift with transfalcine herniation. (b) Axial contrast material–enhanced T1-weighted MR image in a patient with a 3-month history of progressive cognitive impairment shows a large left frontal lobe, a solid and cystic heterogeneously enhancing parenchymal mass with rightward midline shift, transfalcine herniation, and left ventricular effacement. This was a case of anaplastic oligodendroglioma. (c) Axial 18F-FDG PET image in a patient with mild cognitive impairment shows markedly decreased uptake in the left temporal lobe (arrow). (d) Corresponding axial CT image in the same patient as in c obtained for attenuation correction shows an acute intraparenchymal hematoma (arrow).
Figure 1b.
Figure 1b.
Various causes of cognitive impairment. (a) Coronal T2-weighted MR image in a patient with progressive memory loss shows an extra-axial mass (arrow) with broad-based dural attachment, a finding most compatible with meningioma. Note the marked right frontal vasogenic edema and leftward midline shift with transfalcine herniation. (b) Axial contrast material–enhanced T1-weighted MR image in a patient with a 3-month history of progressive cognitive impairment shows a large left frontal lobe, a solid and cystic heterogeneously enhancing parenchymal mass with rightward midline shift, transfalcine herniation, and left ventricular effacement. This was a case of anaplastic oligodendroglioma. (c) Axial 18F-FDG PET image in a patient with mild cognitive impairment shows markedly decreased uptake in the left temporal lobe (arrow). (d) Corresponding axial CT image in the same patient as in c obtained for attenuation correction shows an acute intraparenchymal hematoma (arrow).
Figure 1c.
Figure 1c.
Various causes of cognitive impairment. (a) Coronal T2-weighted MR image in a patient with progressive memory loss shows an extra-axial mass (arrow) with broad-based dural attachment, a finding most compatible with meningioma. Note the marked right frontal vasogenic edema and leftward midline shift with transfalcine herniation. (b) Axial contrast material–enhanced T1-weighted MR image in a patient with a 3-month history of progressive cognitive impairment shows a large left frontal lobe, a solid and cystic heterogeneously enhancing parenchymal mass with rightward midline shift, transfalcine herniation, and left ventricular effacement. This was a case of anaplastic oligodendroglioma. (c) Axial 18F-FDG PET image in a patient with mild cognitive impairment shows markedly decreased uptake in the left temporal lobe (arrow). (d) Corresponding axial CT image in the same patient as in c obtained for attenuation correction shows an acute intraparenchymal hematoma (arrow).
Figure 1d.
Figure 1d.
Various causes of cognitive impairment. (a) Coronal T2-weighted MR image in a patient with progressive memory loss shows an extra-axial mass (arrow) with broad-based dural attachment, a finding most compatible with meningioma. Note the marked right frontal vasogenic edema and leftward midline shift with transfalcine herniation. (b) Axial contrast material–enhanced T1-weighted MR image in a patient with a 3-month history of progressive cognitive impairment shows a large left frontal lobe, a solid and cystic heterogeneously enhancing parenchymal mass with rightward midline shift, transfalcine herniation, and left ventricular effacement. This was a case of anaplastic oligodendroglioma. (c) Axial 18F-FDG PET image in a patient with mild cognitive impairment shows markedly decreased uptake in the left temporal lobe (arrow). (d) Corresponding axial CT image in the same patient as in c obtained for attenuation correction shows an acute intraparenchymal hematoma (arrow).
Figure 2a.
Figure 2a.
Pertinent anatomy in structural imaging. (a) Sagittal illustration (left) and sagittal correlative T1-weighted MR image (right) show the pertinent anatomy. Attention should be paid to the parietal lobe on parasagittal images, as this is the location of the precuneus that is typically affected in Alzheimer disease. (b) Small-field-of-view coronal-oblique T2-weighted MR image with labels, obtained perpendicular to the long axis of the hippocampus for assessment of the mesial temporal lobe, shows additional pertinent structures. Specifically, the visual rating system for mesial temporal atrophy score should be assessed at a plane at the level of the mammillary bodies (5).
Figure 2b.
Figure 2b.
Pertinent anatomy in structural imaging. (a) Sagittal illustration (left) and sagittal correlative T1-weighted MR image (right) show the pertinent anatomy. Attention should be paid to the parietal lobe on parasagittal images, as this is the location of the precuneus that is typically affected in Alzheimer disease. (b) Small-field-of-view coronal-oblique T2-weighted MR image with labels, obtained perpendicular to the long axis of the hippocampus for assessment of the mesial temporal lobe, shows additional pertinent structures. Specifically, the visual rating system for mesial temporal atrophy score should be assessed at a plane at the level of the mammillary bodies (5).
Figure 3a.
Figure 3a.
Mesial temporal lobe assessment. Diagonal lines = gray matter of the cortex. (a) Illustration (left) and coned-down coronal T1-weighted MR image (right) obtained for the assessment of mesial temporal atrophy show normal entorhinal cortex (blue arrows), hippocampus, and perirhinal cortex (red arrows) volumes. (b) Corresponding illustration (left) and MR image (right) in a patient with clinical mild cognitive impairment shows moderate to severe atrophy of the entorhinal cortex (blue arrows) and hippocampus and moderate atrophy of the perirhinal cortex (red arrows).
Figure 3b.
Figure 3b.
Mesial temporal lobe assessment. Diagonal lines = gray matter of the cortex. (a) Illustration (left) and coned-down coronal T1-weighted MR image (right) obtained for the assessment of mesial temporal atrophy show normal entorhinal cortex (blue arrows), hippocampus, and perirhinal cortex (red arrows) volumes. (b) Corresponding illustration (left) and MR image (right) in a patient with clinical mild cognitive impairment shows moderate to severe atrophy of the entorhinal cortex (blue arrows) and hippocampus and moderate atrophy of the perirhinal cortex (red arrows).
Figure 4a.
Figure 4a.
Recommended imaging sequences and acquisition. Sagittal high-spatial-resolution T1-weighted MR image (a) shows the appropriate prescription (dotted lines), perpendicular to the long axis of the hippocampus, for obtaining the coronal-oblique T2-weighted MR image (b), which is recommended for the assessment of the mesial temporal lobe (10). Solid line in a = section from which image b was prescribed.
Figure 4b.
Figure 4b.
Recommended imaging sequences and acquisition. Sagittal high-spatial-resolution T1-weighted MR image (a) shows the appropriate prescription (dotted lines), perpendicular to the long axis of the hippocampus, for obtaining the coronal-oblique T2-weighted MR image (b), which is recommended for the assessment of the mesial temporal lobe (10). Solid line in a = section from which image b was prescribed.
Figure 5a.
Figure 5a.
FDG PET images with normal and abnormal findings. (a) Axial FDG PET image in a patient without dementia shows a high level of cortical uptake throughout the brain. (b) Axial FDG PET image in a patient with advanced Alzheimer disease shows severe cortical hypometabolism involving both the frontal and parietal lobes. Note the relative sparing of the sensorimotor cortices (arrows), which is a classic finding of Alzheimer disease.
Figure 5b.
Figure 5b.
FDG PET images with normal and abnormal findings. (a) Axial FDG PET image in a patient without dementia shows a high level of cortical uptake throughout the brain. (b) Axial FDG PET image in a patient with advanced Alzheimer disease shows severe cortical hypometabolism involving both the frontal and parietal lobes. Note the relative sparing of the sensorimotor cortices (arrows), which is a classic finding of Alzheimer disease.
Figure 6a.
Figure 6a.
Normal amyloid uptake. (a) Axial 18F-florbetaben-amyloid PET image shows normal uptake throughout the white matter, with sparing of the cortical gray matter. (b) Axial 18F-florbetaben-amyloid PET image shows spared cerebellar gray matter. Gray-white differentiation should be determined by internal control using the axial imaging plane at the level of the cerebellum, as cerebellar gray matter is almost always spared from amyloid deposition, even in advanced cases of dementia.
Figure 6b.
Figure 6b.
Normal amyloid uptake. (a) Axial 18F-florbetaben-amyloid PET image shows normal uptake throughout the white matter, with sparing of the cortical gray matter. (b) Axial 18F-florbetaben-amyloid PET image shows spared cerebellar gray matter. Gray-white differentiation should be determined by internal control using the axial imaging plane at the level of the cerebellum, as cerebellar gray matter is almost always spared from amyloid deposition, even in advanced cases of dementia.
Figure 7.
Figure 7.
Illustration shows a synapse at a dopaminergic neuron. The green terminal is the presynaptic terminal, and the orange terminal is the postsynaptic terminal. Dopamine molecules are created in the presynaptic neuron and transported into vesicles by vesicular monoamine transporters. These vesicles release the dopamine molecules into the synapse, where the dopamine can then interact with dopamine receptors (D1 and D2 receptors). The dopamine can then either be degraded by catechol-O-methyltransferase (not shown) or taken back up into the presynaptic neuron and recycled through the dopamine transporter. The dopamine transporter is the target of binding, allowing identification of dopaminergic neurons.
Figure 8a.
Figure 8a.
123I-Ioflupane SPECT images with normal and abnormal findings. (a) Axial SPECT images of the brain in a patient without Parkinson disease show bilateral uptake throughout the corpus striatum, with radiotracer uptake in the caudate heads and putamina. This has a comma appearance (arrows) at the appropriate levels. (b) Axial SPECT images in a patient with Parkinson disease show overall significantly decreased radiotracer uptake (note the increased image noise), with the most significant loss in the bilateral putamina. Preserved uptake in this case is depicted in the caudate heads, with a period appearance (arrows).
Figure 8b.
Figure 8b.
123I-Ioflupane SPECT images with normal and abnormal findings. (a) Axial SPECT images of the brain in a patient without Parkinson disease show bilateral uptake throughout the corpus striatum, with radiotracer uptake in the caudate heads and putamina. This has a comma appearance (arrows) at the appropriate levels. (b) Axial SPECT images in a patient with Parkinson disease show overall significantly decreased radiotracer uptake (note the increased image noise), with the most significant loss in the bilateral putamina. Preserved uptake in this case is depicted in the caudate heads, with a period appearance (arrows).
Figure 9a.
Figure 9a.
Normal and abnormal findings on τ-PET images. (a) Axial 18F-AV-1451 τ-PET image obtained at the convexities shows minimal radiotracer uptake. Additional imaging throughout the brain (not shown) did not show significant focal uptake at any location. (b) Axial τ-PET image of a patient with cognitive impairment shows discrete abnormal radiotracer accumulation (arrow) in the right parietal lobe.
Figure 9b.
Figure 9b.
Normal and abnormal findings on τ-PET images. (a) Axial 18F-AV-1451 τ-PET image obtained at the convexities shows minimal radiotracer uptake. Additional imaging throughout the brain (not shown) did not show significant focal uptake at any location. (b) Axial τ-PET image of a patient with cognitive impairment shows discrete abnormal radiotracer accumulation (arrow) in the right parietal lobe.
Figure 10a.
Figure 10a.
Computer-aided quantitation in FDG PET. (a) Sagittal color map of the z score of FDG uptake in a normal subject shows only minimal decreased uptake at the left mesial temporal lobe (arrow). (b) Sagittal color map in a patient with Alzheimer disease shows characteristic markedly decreased uptake along the cingulate gyrus (red arrow) and left precuneus region (green arrow). In these examples, light blue areas represent a z score between 1.6 and 2.3 (95–99th percentile), dark blue areas are between 2.3 and 3.1 (99–99.9th percentile), and purple areas are below 3.1 (99.9th percentile) standard deviations from those of normal examinations.
Figure 10b.
Figure 10b.
Computer-aided quantitation in FDG PET. (a) Sagittal color map of the z score of FDG uptake in a normal subject shows only minimal decreased uptake at the left mesial temporal lobe (arrow). (b) Sagittal color map in a patient with Alzheimer disease shows characteristic markedly decreased uptake along the cingulate gyrus (red arrow) and left precuneus region (green arrow). In these examples, light blue areas represent a z score between 1.6 and 2.3 (95–99th percentile), dark blue areas are between 2.3 and 3.1 (99–99.9th percentile), and purple areas are below 3.1 (99.9th percentile) standard deviations from those of normal examinations.
Figure 11.
Figure 11.
β-amyloid staining. Photomicrograph of the midfrontal cortex with amyloid-β-5 staining in a patient with dementia shows numerous aggregates of extracellular amyloid plaque (circles). Amyloid deposition is also depicted along adjacent vascular walls (arrow). These aggregates are the site of binding of amyloid PET radiotracers. Although the presence of amyloid aggregates is sensitive for the detection of Alzheimer disease, it is not highly specific and can be visualized in Alzheimer disease and certain cases of dementia with Lewy bodies (DLB). The significance of these plaques is still not well understood, and they may be either primary or secondary findings to the underlying disease process.
Figure 12.
Figure 12.
Staining with α-synuclein. Photomicrograph of the amygdala with 81A staining of α-synuclein in a patient with DLB shows numerous intracellular α-synuclein inclusions (circles), referred to as Lewy bodies. Note the appearance of the relatively normal neurons (arrows), which have no visible inclusions. Clinically available radiotracers for α-synuclein do not exist. However, these inclusion bodies are cytotoxic and result in neuronal loss, which is the basis for dopaminergic neuron and synapse loss that can be visualized with ioflupane (dopamine transporter) imaging.
Figure 13.
Figure 13.
Illustrations show the Braak τ staging system in Alzheimer disease in three different imaging planes. Braak stages I and II (orange areas) are characterized by abnormal τ aggregation at the entorhinal cortex, with early involvement at the hippocampus. Braak stages III and IV (green areas) are characterized by more advanced hippocampal aggregation and further involvement of the limbic system. Braak stages V and VI (purple areas) are characterized by extension into the neocortex, specifically involving the precuneus, temporal lobes, and lingual gyrus. This staging predicts the sequence of findings at structural imaging, FDG PET, and τ-based PET.
Figure 14a.
Figure 14a.
Alzheimer disease. (a) Sagittal T1-weighted MR image in a patient with memory loss shows disproportionate moderate volume loss in the precuneus (arrow), a finding suspicious for Alzheimer disease. The remainder of the brain parenchymal volume is relatively preserved. (b) Sagittal 18F-FDG PET image shows corresponding decreased activity in the precuneus (arrow). Image inset shows a coronal section through the middle of the brain in this particular case to aid in lateralization. Normal uptake is depicted in the frontal and occipital regions, reinforcing the diagnosis of Alzheimer disease.
Figure 14b.
Figure 14b.
Alzheimer disease. (a) Sagittal T1-weighted MR image in a patient with memory loss shows disproportionate moderate volume loss in the precuneus (arrow), a finding suspicious for Alzheimer disease. The remainder of the brain parenchymal volume is relatively preserved. (b) Sagittal 18F-FDG PET image shows corresponding decreased activity in the precuneus (arrow). Image inset shows a coronal section through the middle of the brain in this particular case to aid in lateralization. Normal uptake is depicted in the frontal and occipital regions, reinforcing the diagnosis of Alzheimer disease.
Figure 15a.
Figure 15a.
Alzheimer disease. (a, b) Coronal (a) and sagittal (b) T1-weighted MR images in a patient with suspected Alzheimer disease show mild-to-moderate generalized volume loss. (c, d) Axial (c) and sagittal (d) 18F-FDG PET images show markedly decreased activity in the bilateral frontal lobes and precunei. Image insets show a coronal section through the middle of the brain in this particular case to aid in lateralization. (e) Axial 18F-florbetaben image shows diffuse cortical uptake, which is a grossly abnormal finding, confirming amyloid deposition. Corroborative imaging findings are supportive of the clinical diagnosis of Alzheimer disease.
Figure 15b.
Figure 15b.
Alzheimer disease. (a, b) Coronal (a) and sagittal (b) T1-weighted MR images in a patient with suspected Alzheimer disease show mild-to-moderate generalized volume loss. (c, d) Axial (c) and sagittal (d) 18F-FDG PET images show markedly decreased activity in the bilateral frontal lobes and precunei. Image insets show a coronal section through the middle of the brain in this particular case to aid in lateralization. (e) Axial 18F-florbetaben image shows diffuse cortical uptake, which is a grossly abnormal finding, confirming amyloid deposition. Corroborative imaging findings are supportive of the clinical diagnosis of Alzheimer disease.
Figure 15c.
Figure 15c.
Alzheimer disease. (a, b) Coronal (a) and sagittal (b) T1-weighted MR images in a patient with suspected Alzheimer disease show mild-to-moderate generalized volume loss. (c, d) Axial (c) and sagittal (d) 18F-FDG PET images show markedly decreased activity in the bilateral frontal lobes and precunei. Image insets show a coronal section through the middle of the brain in this particular case to aid in lateralization. (e) Axial 18F-florbetaben image shows diffuse cortical uptake, which is a grossly abnormal finding, confirming amyloid deposition. Corroborative imaging findings are supportive of the clinical diagnosis of Alzheimer disease.
Figure 15d.
Figure 15d.
Alzheimer disease. (a, b) Coronal (a) and sagittal (b) T1-weighted MR images in a patient with suspected Alzheimer disease show mild-to-moderate generalized volume loss. (c, d) Axial (c) and sagittal (d) 18F-FDG PET images show markedly decreased activity in the bilateral frontal lobes and precunei. Image insets show a coronal section through the middle of the brain in this particular case to aid in lateralization. (e) Axial 18F-florbetaben image shows diffuse cortical uptake, which is a grossly abnormal finding, confirming amyloid deposition. Corroborative imaging findings are supportive of the clinical diagnosis of Alzheimer disease.
Figure 15e.
Figure 15e.
Alzheimer disease. (a, b) Coronal (a) and sagittal (b) T1-weighted MR images in a patient with suspected Alzheimer disease show mild-to-moderate generalized volume loss. (c, d) Axial (c) and sagittal (d) 18F-FDG PET images show markedly decreased activity in the bilateral frontal lobes and precunei. Image insets show a coronal section through the middle of the brain in this particular case to aid in lateralization. (e) Axial 18F-florbetaben image shows diffuse cortical uptake, which is a grossly abnormal finding, confirming amyloid deposition. Corroborative imaging findings are supportive of the clinical diagnosis of Alzheimer disease.
Figure 16a.
Figure 16a.
Patient with memory loss. (a) Sagittal T1-weighted MR image in a patient with memory loss shows relatively preserved cortical volume. (b) Axial 18F-florbetaben image at the level of the lateral ventricles shows diffuse abnormal uptake, confirming amyloid deposition. (c) Axial image at the level of the cerebellum shows preserved gray-white differentiation. (d, e) Axial susceptibility-weighted minimum intensity projection images at the level of the atria (d) and body (e) of the lateral ventricles show multiple areas of round signal void (arrows) scattered throughout the periphery of the cortices, compatible with cerebral amyloid angiopathy. (f) Axial susceptibility-weighted minimum intensity projection image at the level of the cerebellum shows the lack of abnormal susceptibility in the cerebellum, compatible with the sparing noted at amyloid PET imaging. This case highlights the complementary role of structural and molecular imaging with findings compatible with Alzheimer disease and cerebral amyloid angiopathy.
Figure 16b.
Figure 16b.
Patient with memory loss. (a) Sagittal T1-weighted MR image in a patient with memory loss shows relatively preserved cortical volume. (b) Axial 18F-florbetaben image at the level of the lateral ventricles shows diffuse abnormal uptake, confirming amyloid deposition. (c) Axial image at the level of the cerebellum shows preserved gray-white differentiation. (d, e) Axial susceptibility-weighted minimum intensity projection images at the level of the atria (d) and body (e) of the lateral ventricles show multiple areas of round signal void (arrows) scattered throughout the periphery of the cortices, compatible with cerebral amyloid angiopathy. (f) Axial susceptibility-weighted minimum intensity projection image at the level of the cerebellum shows the lack of abnormal susceptibility in the cerebellum, compatible with the sparing noted at amyloid PET imaging. This case highlights the complementary role of structural and molecular imaging with findings compatible with Alzheimer disease and cerebral amyloid angiopathy.
Figure 16c.
Figure 16c.
Patient with memory loss. (a) Sagittal T1-weighted MR image in a patient with memory loss shows relatively preserved cortical volume. (b) Axial 18F-florbetaben image at the level of the lateral ventricles shows diffuse abnormal uptake, confirming amyloid deposition. (c) Axial image at the level of the cerebellum shows preserved gray-white differentiation. (d, e) Axial susceptibility-weighted minimum intensity projection images at the level of the atria (d) and body (e) of the lateral ventricles show multiple areas of round signal void (arrows) scattered throughout the periphery of the cortices, compatible with cerebral amyloid angiopathy. (f) Axial susceptibility-weighted minimum intensity projection image at the level of the cerebellum shows the lack of abnormal susceptibility in the cerebellum, compatible with the sparing noted at amyloid PET imaging. This case highlights the complementary role of structural and molecular imaging with findings compatible with Alzheimer disease and cerebral amyloid angiopathy.
Figure 16d.
Figure 16d.
Patient with memory loss. (a) Sagittal T1-weighted MR image in a patient with memory loss shows relatively preserved cortical volume. (b) Axial 18F-florbetaben image at the level of the lateral ventricles shows diffuse abnormal uptake, confirming amyloid deposition. (c) Axial image at the level of the cerebellum shows preserved gray-white differentiation. (d, e) Axial susceptibility-weighted minimum intensity projection images at the level of the atria (d) and body (e) of the lateral ventricles show multiple areas of round signal void (arrows) scattered throughout the periphery of the cortices, compatible with cerebral amyloid angiopathy. (f) Axial susceptibility-weighted minimum intensity projection image at the level of the cerebellum shows the lack of abnormal susceptibility in the cerebellum, compatible with the sparing noted at amyloid PET imaging. This case highlights the complementary role of structural and molecular imaging with findings compatible with Alzheimer disease and cerebral amyloid angiopathy.
Figure 16e.
Figure 16e.
Patient with memory loss. (a) Sagittal T1-weighted MR image in a patient with memory loss shows relatively preserved cortical volume. (b) Axial 18F-florbetaben image at the level of the lateral ventricles shows diffuse abnormal uptake, confirming amyloid deposition. (c) Axial image at the level of the cerebellum shows preserved gray-white differentiation. (d, e) Axial susceptibility-weighted minimum intensity projection images at the level of the atria (d) and body (e) of the lateral ventricles show multiple areas of round signal void (arrows) scattered throughout the periphery of the cortices, compatible with cerebral amyloid angiopathy. (f) Axial susceptibility-weighted minimum intensity projection image at the level of the cerebellum shows the lack of abnormal susceptibility in the cerebellum, compatible with the sparing noted at amyloid PET imaging. This case highlights the complementary role of structural and molecular imaging with findings compatible with Alzheimer disease and cerebral amyloid angiopathy.
Figure 16f.
Figure 16f.
Patient with memory loss. (a) Sagittal T1-weighted MR image in a patient with memory loss shows relatively preserved cortical volume. (b) Axial 18F-florbetaben image at the level of the lateral ventricles shows diffuse abnormal uptake, confirming amyloid deposition. (c) Axial image at the level of the cerebellum shows preserved gray-white differentiation. (d, e) Axial susceptibility-weighted minimum intensity projection images at the level of the atria (d) and body (e) of the lateral ventricles show multiple areas of round signal void (arrows) scattered throughout the periphery of the cortices, compatible with cerebral amyloid angiopathy. (f) Axial susceptibility-weighted minimum intensity projection image at the level of the cerebellum shows the lack of abnormal susceptibility in the cerebellum, compatible with the sparing noted at amyloid PET imaging. This case highlights the complementary role of structural and molecular imaging with findings compatible with Alzheimer disease and cerebral amyloid angiopathy.
Figure 17a.
Figure 17a.
Dementia with Lewy bodies. (a, b) Sagittal (a) and axial (b) MR images show generalized volume loss with significant occipital lobe involvement (arrow in a), which is an atypical finding for Alzheimer disease. (c) Sagittal 18F-FDG PET image shows corresponding decreased activity (arrow) in the occipital region. (d) Axial 18F-FDG PET image shows relative sparing of the posterior cingulate gyrus (arrow). Involvement of the occipital lobes and sparing of the posterior cingulate is a characteristic finding of DLB.
Figure 17b.
Figure 17b.
Dementia with Lewy bodies. (a, b) Sagittal (a) and axial (b) MR images show generalized volume loss with significant occipital lobe involvement (arrow in a), which is an atypical finding for Alzheimer disease. (c) Sagittal 18F-FDG PET image shows corresponding decreased activity (arrow) in the occipital region. (d) Axial 18F-FDG PET image shows relative sparing of the posterior cingulate gyrus (arrow). Involvement of the occipital lobes and sparing of the posterior cingulate is a characteristic finding of DLB.
Figure 17c.
Figure 17c.
Dementia with Lewy bodies. (a, b) Sagittal (a) and axial (b) MR images show generalized volume loss with significant occipital lobe involvement (arrow in a), which is an atypical finding for Alzheimer disease. (c) Sagittal 18F-FDG PET image shows corresponding decreased activity (arrow) in the occipital region. (d) Axial 18F-FDG PET image shows relative sparing of the posterior cingulate gyrus (arrow). Involvement of the occipital lobes and sparing of the posterior cingulate is a characteristic finding of DLB.
Figure 17d.
Figure 17d.
Dementia with Lewy bodies. (a, b) Sagittal (a) and axial (b) MR images show generalized volume loss with significant occipital lobe involvement (arrow in a), which is an atypical finding for Alzheimer disease. (c) Sagittal 18F-FDG PET image shows corresponding decreased activity (arrow) in the occipital region. (d) Axial 18F-FDG PET image shows relative sparing of the posterior cingulate gyrus (arrow). Involvement of the occipital lobes and sparing of the posterior cingulate is a characteristic finding of DLB.
Figure 18a.
Figure 18a.
Dementia with Lewy bodies. (a) Axial 123I-ioflupane SPECT image in a patient with memory loss shows decreased left striatal uptake with a period appearance (red arrow), confirmatory of a parkinsonian neurodegenerative disease. Note the normal right striatal uptake with a comma appearance (green arrow), representing preserved putaminal uptake. (b) Sagittal 18F-FDG PET image shows subtle decreased uptake within the occipital region (arrow). (c) Parasagittal computer-generated map shows a statistically significant decrease in FDG uptake in the precuneus and occipital lobe (red arrows). Note that the posterior cingulate gyrus is spared (cingulate island sign), which is more readily apparent on the computer-generated map (green arrow) than on the 18F-FDG PET image. These findings corroborate the diagnosis of DLB.
Figure 18b.
Figure 18b.
Dementia with Lewy bodies. (a) Axial 123I-ioflupane SPECT image in a patient with memory loss shows decreased left striatal uptake with a period appearance (red arrow), confirmatory of a parkinsonian neurodegenerative disease. Note the normal right striatal uptake with a comma appearance (green arrow), representing preserved putaminal uptake. (b) Sagittal 18F-FDG PET image shows subtle decreased uptake within the occipital region (arrow). (c) Parasagittal computer-generated map shows a statistically significant decrease in FDG uptake in the precuneus and occipital lobe (red arrows). Note that the posterior cingulate gyrus is spared (cingulate island sign), which is more readily apparent on the computer-generated map (green arrow) than on the 18F-FDG PET image. These findings corroborate the diagnosis of DLB.
Figure 18c.
Figure 18c.
Dementia with Lewy bodies. (a) Axial 123I-ioflupane SPECT image in a patient with memory loss shows decreased left striatal uptake with a period appearance (red arrow), confirmatory of a parkinsonian neurodegenerative disease. Note the normal right striatal uptake with a comma appearance (green arrow), representing preserved putaminal uptake. (b) Sagittal 18F-FDG PET image shows subtle decreased uptake within the occipital region (arrow). (c) Parasagittal computer-generated map shows a statistically significant decrease in FDG uptake in the precuneus and occipital lobe (red arrows). Note that the posterior cingulate gyrus is spared (cingulate island sign), which is more readily apparent on the computer-generated map (green arrow) than on the 18F-FDG PET image. These findings corroborate the diagnosis of DLB.
Figure 19a.
Figure 19a.
Frontotemporal lobar degeneration. (a) Coronal 18F-FDG PET image at the level of the anterior temporal lobes shows markedly decreased temporal lobe uptake. I = inferior, S = superior. (b, c) Coronal (b) and axial (c) T1-weighted MR images show severe bilateral temporal lobe atrophy. (d) Axial MR image at the level of the temporal lobes obtained 5 years earlier demonstrates the significant progressive atrophy in this patient.
Figure 19b.
Figure 19b.
Frontotemporal lobar degeneration. (a) Coronal 18F-FDG PET image at the level of the anterior temporal lobes shows markedly decreased temporal lobe uptake. I = inferior, S = superior. (b, c) Coronal (b) and axial (c) T1-weighted MR images show severe bilateral temporal lobe atrophy. (d) Axial MR image at the level of the temporal lobes obtained 5 years earlier demonstrates the significant progressive atrophy in this patient.
Figure 19c.
Figure 19c.
Frontotemporal lobar degeneration. (a) Coronal 18F-FDG PET image at the level of the anterior temporal lobes shows markedly decreased temporal lobe uptake. I = inferior, S = superior. (b, c) Coronal (b) and axial (c) T1-weighted MR images show severe bilateral temporal lobe atrophy. (d) Axial MR image at the level of the temporal lobes obtained 5 years earlier demonstrates the significant progressive atrophy in this patient.
Figure 19d.
Figure 19d.
Frontotemporal lobar degeneration. (a) Coronal 18F-FDG PET image at the level of the anterior temporal lobes shows markedly decreased temporal lobe uptake. I = inferior, S = superior. (b, c) Coronal (b) and axial (c) T1-weighted MR images show severe bilateral temporal lobe atrophy. (d) Axial MR image at the level of the temporal lobes obtained 5 years earlier demonstrates the significant progressive atrophy in this patient.
Figure 20a.
Figure 20a.
Frontotemporal lobar degeneration. (a, b) Axial T1-weighted MR images at the convexities (a) and temporal lobes (b) show moderate frontotemporal atrophy. Note the atrophy at the right frontal lobe (arrows in a). (c) Follow-up axial CT image at the lateral ventricles obtained 5 years later shows asymmetric worsening atrophy (arrows) on the right. (d) Axial CT image shows similar asymmetric worsening at the temporal lobes. (e, f) Coronal (e) and sagittal (f) 18F-FDG PET images obtained on the same day as the CT images show corresponding decreased activity in the frontal and temporal regions, findings compatible with FTLD. Image insets show a coronal section through the middle of the brain in this particular case to aid in lateralization.
Figure 20b.
Figure 20b.
Frontotemporal lobar degeneration. (a, b) Axial T1-weighted MR images at the convexities (a) and temporal lobes (b) show moderate frontotemporal atrophy. Note the atrophy at the right frontal lobe (arrows in a). (c) Follow-up axial CT image at the lateral ventricles obtained 5 years later shows asymmetric worsening atrophy (arrows) on the right. (d) Axial CT image shows similar asymmetric worsening at the temporal lobes. (e, f) Coronal (e) and sagittal (f) 18F-FDG PET images obtained on the same day as the CT images show corresponding decreased activity in the frontal and temporal regions, findings compatible with FTLD. Image insets show a coronal section through the middle of the brain in this particular case to aid in lateralization.
Figure 20c.
Figure 20c.
Frontotemporal lobar degeneration. (a, b) Axial T1-weighted MR images at the convexities (a) and temporal lobes (b) show moderate frontotemporal atrophy. Note the atrophy at the right frontal lobe (arrows in a). (c) Follow-up axial CT image at the lateral ventricles obtained 5 years later shows asymmetric worsening atrophy (arrows) on the right. (d) Axial CT image shows similar asymmetric worsening at the temporal lobes. (e, f) Coronal (e) and sagittal (f) 18F-FDG PET images obtained on the same day as the CT images show corresponding decreased activity in the frontal and temporal regions, findings compatible with FTLD. Image insets show a coronal section through the middle of the brain in this particular case to aid in lateralization.
Figure 20d.
Figure 20d.
Frontotemporal lobar degeneration. (a, b) Axial T1-weighted MR images at the convexities (a) and temporal lobes (b) show moderate frontotemporal atrophy. Note the atrophy at the right frontal lobe (arrows in a). (c) Follow-up axial CT image at the lateral ventricles obtained 5 years later shows asymmetric worsening atrophy (arrows) on the right. (d) Axial CT image shows similar asymmetric worsening at the temporal lobes. (e, f) Coronal (e) and sagittal (f) 18F-FDG PET images obtained on the same day as the CT images show corresponding decreased activity in the frontal and temporal regions, findings compatible with FTLD. Image insets show a coronal section through the middle of the brain in this particular case to aid in lateralization.
Figure 20e.
Figure 20e.
Frontotemporal lobar degeneration. (a, b) Axial T1-weighted MR images at the convexities (a) and temporal lobes (b) show moderate frontotemporal atrophy. Note the atrophy at the right frontal lobe (arrows in a). (c) Follow-up axial CT image at the lateral ventricles obtained 5 years later shows asymmetric worsening atrophy (arrows) on the right. (d) Axial CT image shows similar asymmetric worsening at the temporal lobes. (e, f) Coronal (e) and sagittal (f) 18F-FDG PET images obtained on the same day as the CT images show corresponding decreased activity in the frontal and temporal regions, findings compatible with FTLD. Image insets show a coronal section through the middle of the brain in this particular case to aid in lateralization.
Figure 20f.
Figure 20f.
Frontotemporal lobar degeneration. (a, b) Axial T1-weighted MR images at the convexities (a) and temporal lobes (b) show moderate frontotemporal atrophy. Note the atrophy at the right frontal lobe (arrows in a). (c) Follow-up axial CT image at the lateral ventricles obtained 5 years later shows asymmetric worsening atrophy (arrows) on the right. (d) Axial CT image shows similar asymmetric worsening at the temporal lobes. (e, f) Coronal (e) and sagittal (f) 18F-FDG PET images obtained on the same day as the CT images show corresponding decreased activity in the frontal and temporal regions, findings compatible with FTLD. Image insets show a coronal section through the middle of the brain in this particular case to aid in lateralization.
Figure 21a.
Figure 21a.
Patient with vascular dementia from a strategic left thalamic hemorrhagic infarct. (a–c) Axial T2-weighted fluid-attenuated inversion-recovery (FLAIR) (a), T2-weighted (b), and gradient-recalled-echo (c) MR images show encephalomalacia and hemosiderin staining in the left thalamus (arrow), compatible with a chronic hemorrhagic infarct. (d, e) Axial 18F-FDG PET images at the level of the thalami (d) and lateral ventricles (e) show nearly absent activity in the left thalamus (arrow in d) and decreased activity in the left cerebral hemisphere, respectively, when compared with the normal activity depicted in the right thalamus and right cerebral hemisphere. Corroborative findings are compatible with thalamic infarct and vascular dementia. (f) Coronal 18F-FDG PET image shows decreased activity (arrows) in the left cerebral hemisphere and right cerebellar hemisphere, compatible with crossed cerebellar diaschisis. This is secondary to wallerian degeneration of the white matter tracts, which decussate contralaterally. I = inferior, S = superior.
Figure 21b.
Figure 21b.
Patient with vascular dementia from a strategic left thalamic hemorrhagic infarct. (a–c) Axial T2-weighted fluid-attenuated inversion-recovery (FLAIR) (a), T2-weighted (b), and gradient-recalled-echo (c) MR images show encephalomalacia and hemosiderin staining in the left thalamus (arrow), compatible with a chronic hemorrhagic infarct. (d, e) Axial 18F-FDG PET images at the level of the thalami (d) and lateral ventricles (e) show nearly absent activity in the left thalamus (arrow in d) and decreased activity in the left cerebral hemisphere, respectively, when compared with the normal activity depicted in the right thalamus and right cerebral hemisphere. Corroborative findings are compatible with thalamic infarct and vascular dementia. (f) Coronal 18F-FDG PET image shows decreased activity (arrows) in the left cerebral hemisphere and right cerebellar hemisphere, compatible with crossed cerebellar diaschisis. This is secondary to wallerian degeneration of the white matter tracts, which decussate contralaterally. I = inferior, S = superior.
Figure 21c.
Figure 21c.
Patient with vascular dementia from a strategic left thalamic hemorrhagic infarct. (a–c) Axial T2-weighted fluid-attenuated inversion-recovery (FLAIR) (a), T2-weighted (b), and gradient-recalled-echo (c) MR images show encephalomalacia and hemosiderin staining in the left thalamus (arrow), compatible with a chronic hemorrhagic infarct. (d, e) Axial 18F-FDG PET images at the level of the thalami (d) and lateral ventricles (e) show nearly absent activity in the left thalamus (arrow in d) and decreased activity in the left cerebral hemisphere, respectively, when compared with the normal activity depicted in the right thalamus and right cerebral hemisphere. Corroborative findings are compatible with thalamic infarct and vascular dementia. (f) Coronal 18F-FDG PET image shows decreased activity (arrows) in the left cerebral hemisphere and right cerebellar hemisphere, compatible with crossed cerebellar diaschisis. This is secondary to wallerian degeneration of the white matter tracts, which decussate contralaterally. I = inferior, S = superior.
Figure 21d.
Figure 21d.
Patient with vascular dementia from a strategic left thalamic hemorrhagic infarct. (a–c) Axial T2-weighted fluid-attenuated inversion-recovery (FLAIR) (a), T2-weighted (b), and gradient-recalled-echo (c) MR images show encephalomalacia and hemosiderin staining in the left thalamus (arrow), compatible with a chronic hemorrhagic infarct. (d, e) Axial 18F-FDG PET images at the level of the thalami (d) and lateral ventricles (e) show nearly absent activity in the left thalamus (arrow in d) and decreased activity in the left cerebral hemisphere, respectively, when compared with the normal activity depicted in the right thalamus and right cerebral hemisphere. Corroborative findings are compatible with thalamic infarct and vascular dementia. (f) Coronal 18F-FDG PET image shows decreased activity (arrows) in the left cerebral hemisphere and right cerebellar hemisphere, compatible with crossed cerebellar diaschisis. This is secondary to wallerian degeneration of the white matter tracts, which decussate contralaterally. I = inferior, S = superior.
Figure 21e.
Figure 21e.
Patient with vascular dementia from a strategic left thalamic hemorrhagic infarct. (a–c) Axial T2-weighted fluid-attenuated inversion-recovery (FLAIR) (a), T2-weighted (b), and gradient-recalled-echo (c) MR images show encephalomalacia and hemosiderin staining in the left thalamus (arrow), compatible with a chronic hemorrhagic infarct. (d, e) Axial 18F-FDG PET images at the level of the thalami (d) and lateral ventricles (e) show nearly absent activity in the left thalamus (arrow in d) and decreased activity in the left cerebral hemisphere, respectively, when compared with the normal activity depicted in the right thalamus and right cerebral hemisphere. Corroborative findings are compatible with thalamic infarct and vascular dementia. (f) Coronal 18F-FDG PET image shows decreased activity (arrows) in the left cerebral hemisphere and right cerebellar hemisphere, compatible with crossed cerebellar diaschisis. This is secondary to wallerian degeneration of the white matter tracts, which decussate contralaterally. I = inferior, S = superior.
Figure 21f.
Figure 21f.
Patient with vascular dementia from a strategic left thalamic hemorrhagic infarct. (a–c) Axial T2-weighted fluid-attenuated inversion-recovery (FLAIR) (a), T2-weighted (b), and gradient-recalled-echo (c) MR images show encephalomalacia and hemosiderin staining in the left thalamus (arrow), compatible with a chronic hemorrhagic infarct. (d, e) Axial 18F-FDG PET images at the level of the thalami (d) and lateral ventricles (e) show nearly absent activity in the left thalamus (arrow in d) and decreased activity in the left cerebral hemisphere, respectively, when compared with the normal activity depicted in the right thalamus and right cerebral hemisphere. Corroborative findings are compatible with thalamic infarct and vascular dementia. (f) Coronal 18F-FDG PET image shows decreased activity (arrows) in the left cerebral hemisphere and right cerebellar hemisphere, compatible with crossed cerebellar diaschisis. This is secondary to wallerian degeneration of the white matter tracts, which decussate contralaterally. I = inferior, S = superior.
Figure 22a.
Figure 22a.
Patient with vascular dementia. (a) Axial 18F-FDG PET image shows decreased activity in the bilateral frontal and parietal regions, with the right side being worse than the left. In the proper clinical setting, these findings are suggestive of Alzheimer disease dementia. (b) Corresponding axial MR image shows confluent T2-weighted fluid-attenuated inversion-recovery (FLAIR) white matter areas of hyperintensity extending to the subcortical regions, reflecting extensive ischemic damage without cortical volume loss. Findings at structural and functional imaging are representative of subcortical arteriosclerotic encephalopathy or Binswanger disease.
Figure 22b.
Figure 22b.
Patient with vascular dementia. (a) Axial 18F-FDG PET image shows decreased activity in the bilateral frontal and parietal regions, with the right side being worse than the left. In the proper clinical setting, these findings are suggestive of Alzheimer disease dementia. (b) Corresponding axial MR image shows confluent T2-weighted fluid-attenuated inversion-recovery (FLAIR) white matter areas of hyperintensity extending to the subcortical regions, reflecting extensive ischemic damage without cortical volume loss. Findings at structural and functional imaging are representative of subcortical arteriosclerotic encephalopathy or Binswanger disease.
Figure 23a.
Figure 23a.
Patient with normal pressure hydrocephalus with insidious onset of dementia, gait disturbance, and urinary incontinence. Coronal T2-weighted (a) and sagittal T2-weighted three-dimensional–volumetric high-spatial-resolution (b) MR images show ventriculosulcal disproportion, which is suggestive of normal pressure hydrocephalus. Three-dimensional–volumetric high-spatial-resolution images also show a large cerebrospinal fluid flow void (arrows) at the level of the third ventricle, cerebral aqueduct, and fourth ventricle, suggesting increased velocities and excluding obstruction, which helps confirm normal pressure hydrocephalus.
Figure 23b.
Figure 23b.
Patient with normal pressure hydrocephalus with insidious onset of dementia, gait disturbance, and urinary incontinence. Coronal T2-weighted (a) and sagittal T2-weighted three-dimensional–volumetric high-spatial-resolution (b) MR images show ventriculosulcal disproportion, which is suggestive of normal pressure hydrocephalus. Three-dimensional–volumetric high-spatial-resolution images also show a large cerebrospinal fluid flow void (arrows) at the level of the third ventricle, cerebral aqueduct, and fourth ventricle, suggesting increased velocities and excluding obstruction, which helps confirm normal pressure hydrocephalus.
Figure 24a.
Figure 24a.
Creutzfeldt–Jakob disease. Axial diffusion-weighted MR images in a patient with rapidly progressive dementia show gyriform areas of hyperintensity of the cortical ribbon sign (arrows), a finding suspicious for Creutzfeldt–Jakob disease. The diagnosis was confirmed on the basis of clinical and imaging findings and elevated cerebrospinal fluid 14-3-3 protein levels.
Figure 24b.
Figure 24b.
Creutzfeldt–Jakob disease. Axial diffusion-weighted MR images in a patient with rapidly progressive dementia show gyriform areas of hyperintensity of the cortical ribbon sign (arrows), a finding suspicious for Creutzfeldt–Jakob disease. The diagnosis was confirmed on the basis of clinical and imaging findings and elevated cerebrospinal fluid 14-3-3 protein levels.
Figure 25.
Figure 25.
Flowchart shows the diagnostic strategy for the workup of patients with suspected dementia. In patients with clinical neurocognitive impairment, the first step in imaging should be performing structural MRI. This allows identification of alternate treatable causes before performing additional workup. If a diagnosis is not clear, a clinical history review should be performed to identify any parkinsonian symptoms. If these symptoms are present, a 123I-ioflupane SPECT image should be obtained. If this is negative or if parkinsonian symptoms are absent, FDG PET should be performed. In many cases, the combination of MRI, FDG PET, and clinical history review findings are sufficient to suggest a diagnosis. Additional workup should be used for troubleshooting. Amyloid or τ imaging (if available) should be considered to identify patterns that would suggest an Alzheimer disease diagnosis. If the distribution on FDG images suggests DLB, an examination with ioflupane can be considered. DaT = dopamine transporter.

References

    1. Alzheimer’s Association. 2019 Alzheimer’s Disease Facts and Figures. Alzheimers Dement 2019;15(3):321-87.
    1. Bradford A, Kunik ME, Schulz P, Williams SP, Singh H. Missed and delayed diagnosis of dementia in primary care: prevalence and contributing factors. Alzheimer Dis Assoc Disord 2009;23(4):306–314. - PMC - PubMed
    1. Frisoni GB, Fox NC, Jack CR, Jr, Scheltens P, Thompson PM. The clinical use of structural MRI in Alzheimer disease. Nat Rev Neurol 2010;6(2):67–77. - PMC - PubMed
    1. Morris JC, Csernansky J, Price JL. MRI measures of entorhinal cortex versus hippocampus in preclinical AD. Neurology 2002;59(9):1474–1475; author reply 1474–1475. - PubMed
    1. Shen Q, Loewenstein DA, Potter E, et al. . Volumetric and visual rating of magnetic resonance imaging scans in the diagnosis of amnestic mild cognitive impairment and Alzheimer’s disease. Alzheimers Dement 2011;7(4):e101–e108. - PMC - PubMed

MeSH terms