. 2020 Apr 1;130(4):1767-1781.
doi: 10.1172/JCI133473.

Parathyroid hormone-dependent bone formation requires butyrate production by intestinal microbiota

Affiliations

Parathyroid hormone-dependent bone formation requires butyrate production by intestinal microbiota

Jau-Yi Li et al. J Clin Invest. .

Abstract

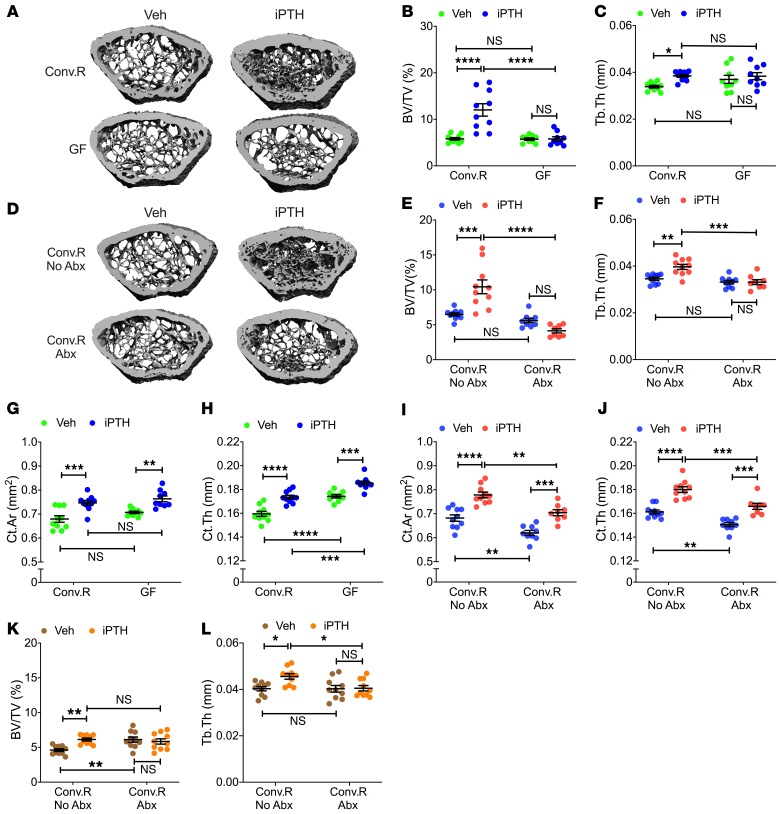
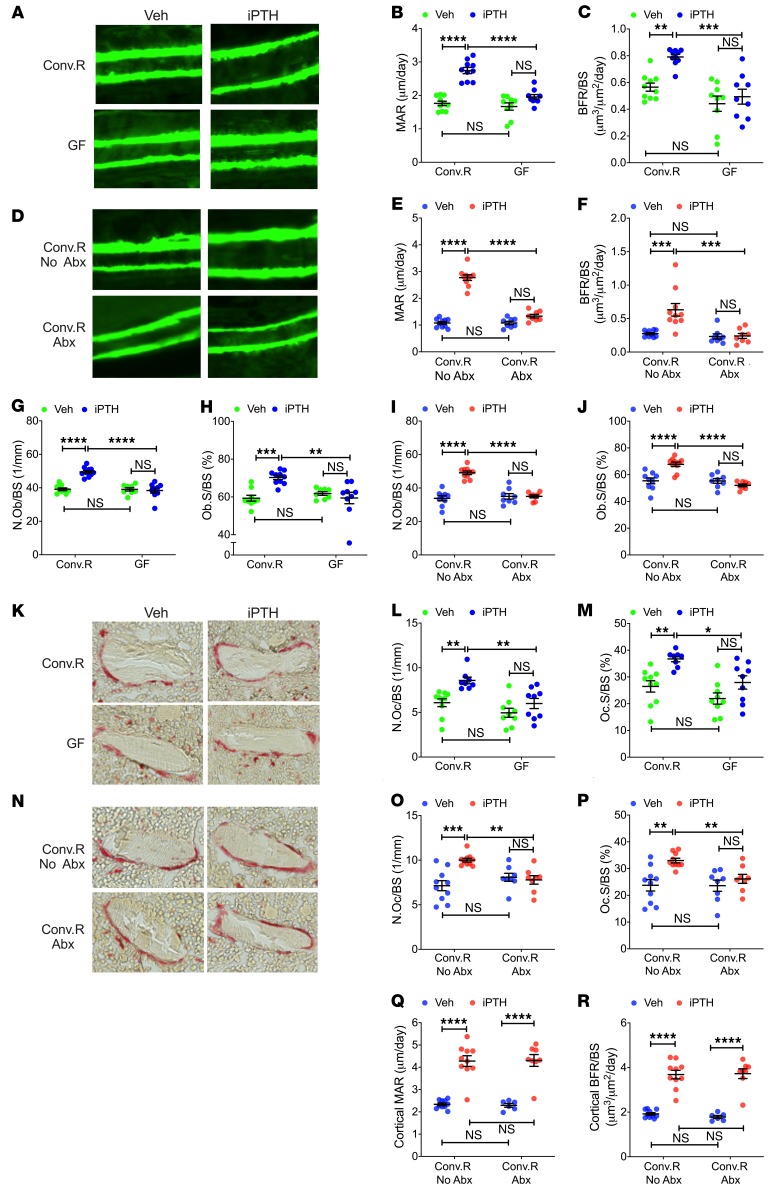
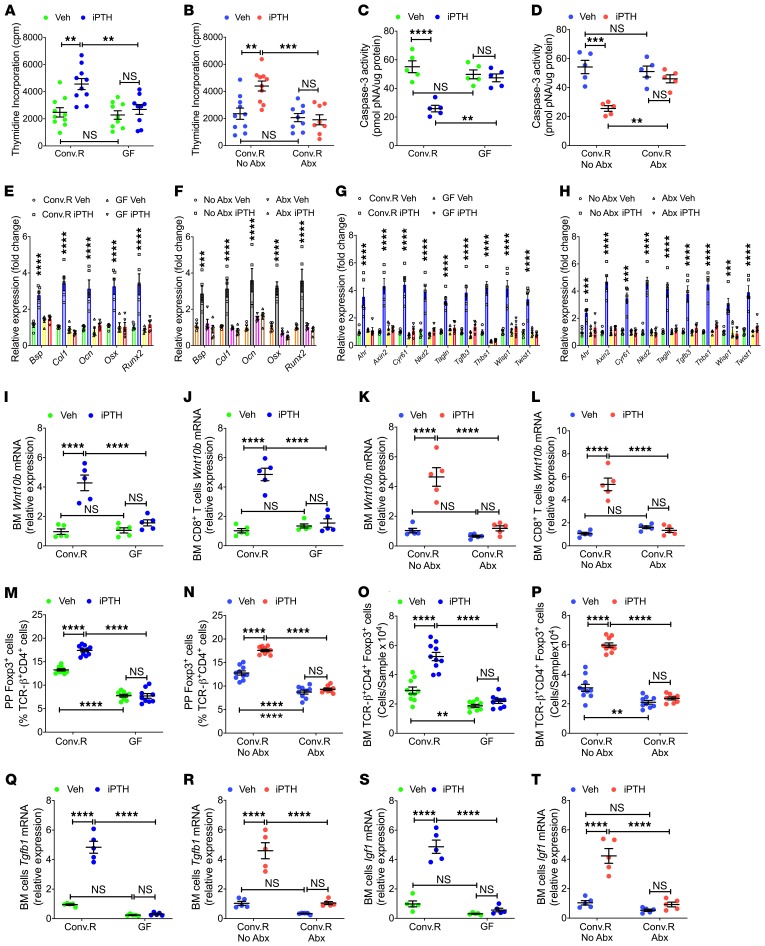
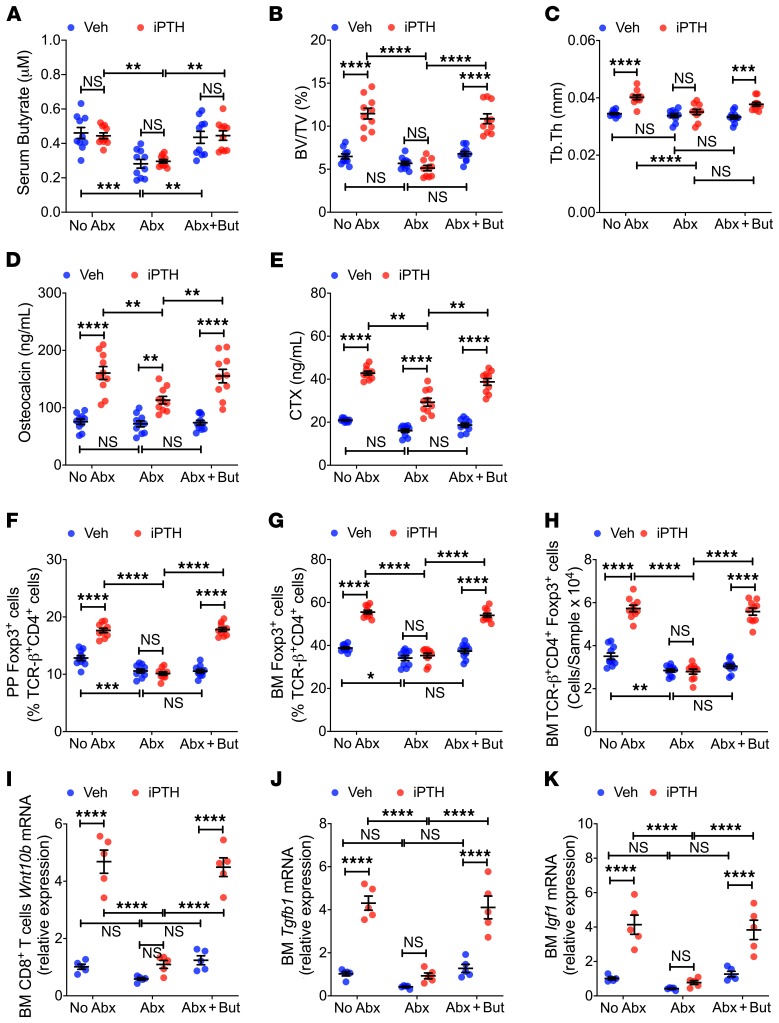
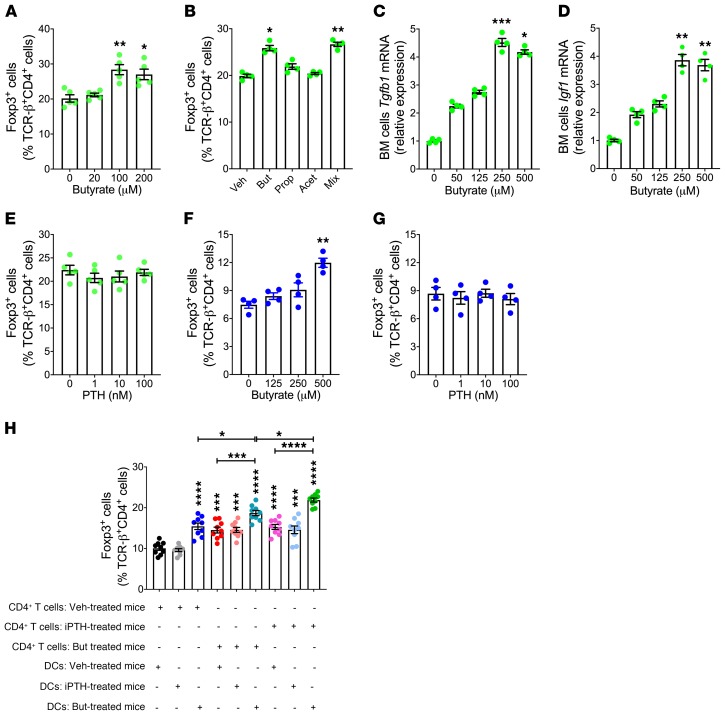
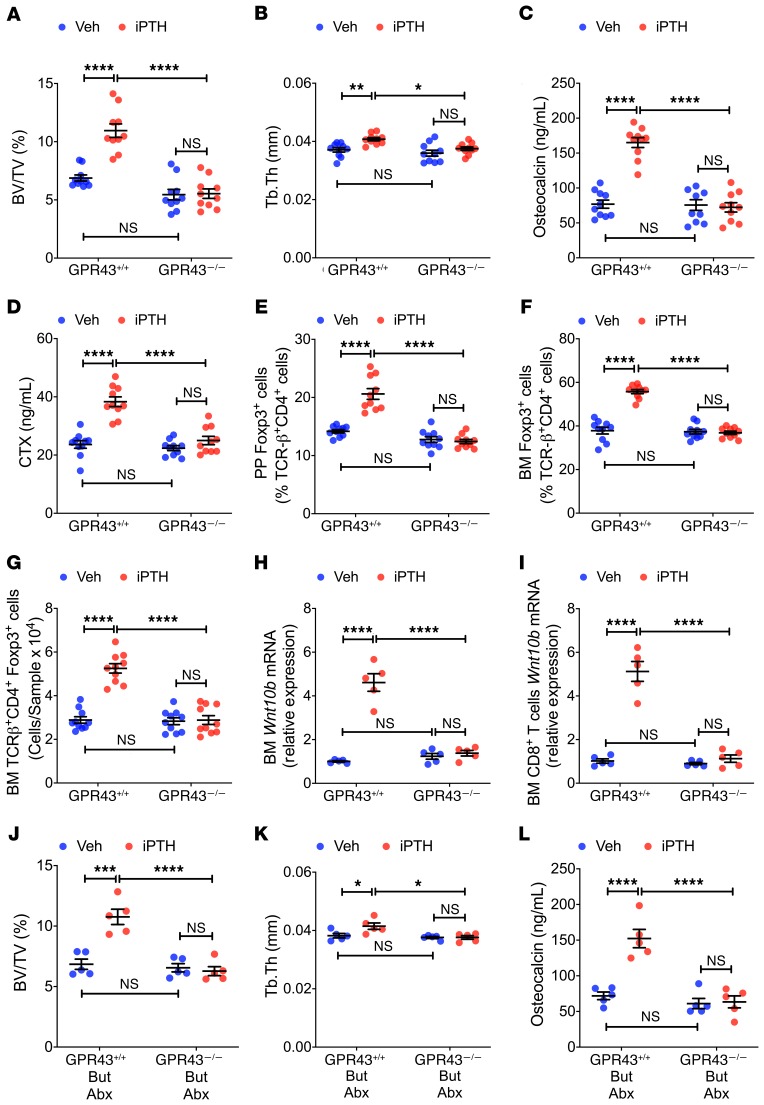
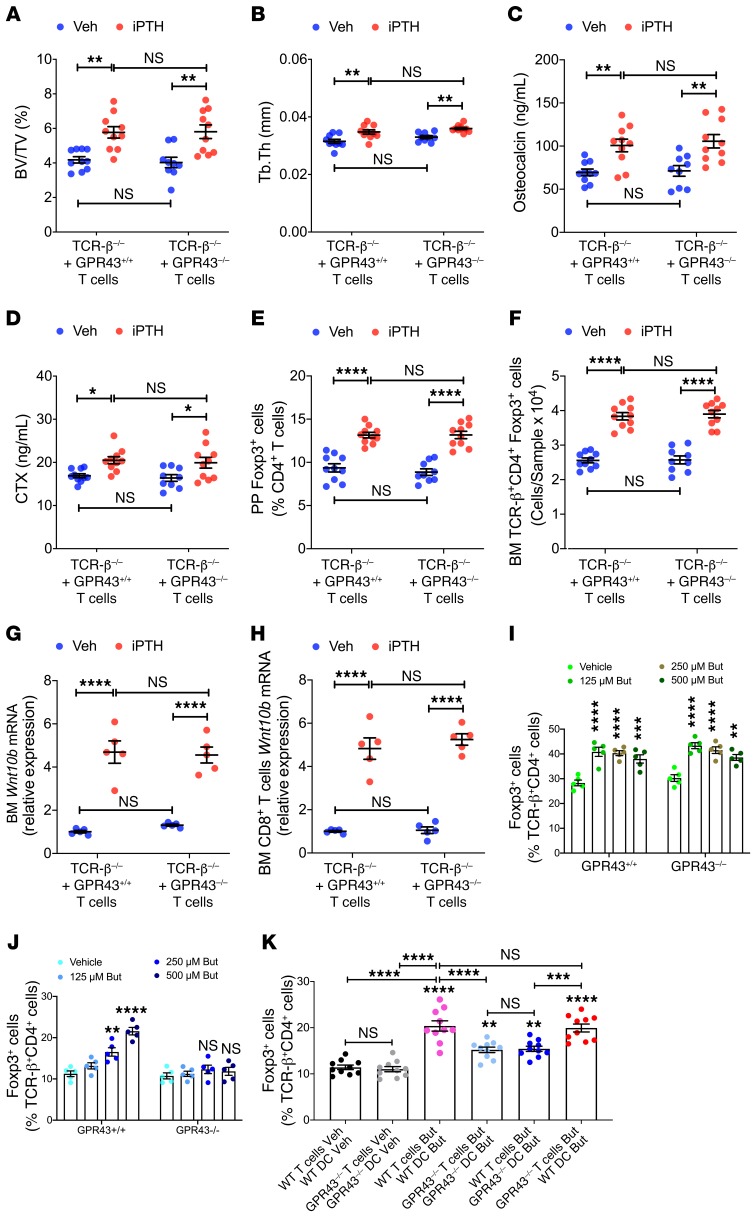
Parathyroid hormone (PTH) is a critical regulator of skeletal development that promotes both bone formation and bone resorption. Using microbiota depletion by wide-spectrum antibiotics and germ-free (GF) female mice, we showed that the microbiota was required for PTH to stimulate bone formation and increase bone mass. Microbiota depletion lowered butyrate levels, a metabolite responsible for gut-bone communication, while reestablishment of physiologic levels of butyrate restored PTH-induced anabolism. The permissive activity of butyrate was mediated by GPR43 signaling in dendritic cells and by GPR43-independent signaling in T cells. Butyrate was required for PTH to increase the number of bone marrow (BM) regulatory T cells (Tregs). Tregs stimulated production of the osteogenic Wnt ligand Wnt10b by BM CD8+ T cells, which activated Wnt-dependent bone formation. Together, these data highlight the role that butyrate produced by gut luminal microbiota plays in triggering regulatory pathways, which are critical for the anabolic action of PTH in bone.

Keywords: Bone Biology; Bone disease; Dendritic cells; T cells.


Conflict of interest statement

Conflict of interest: The authors have declared that no conflict of interest exists.

Figures

Figure 1
Figure 1. iPTH treatment fails to improve trabecular bone structure in GF mice and conventional mice treated with antibiotics.
(A) Images of representative 3D μCT reconstructions of examined femurs from 12-week-old conventionally raised (Conv.R) mice and GF mice. (B and C) μCT scanning measurements of trabecular bone volume fraction (BV/TV) and trabecular thickness (Tb.Th) in 12-week-old Conv.R mice and GF mice (n = 9–10 mice/group). (D) Images of representative 3D μCT reconstructions of examined femurs from 12-week-old Conv.R mice treated with and without antibiotics (Abx). (E and F) μCT scanning measurements of BV/TV and Tb.Th in 12-week-old Conv.R mice treated with and without Abx (n = 8–10 mice/group).(G and H) μCT scanning measurements of cortical bone area (Ct.Ar), and cortical thickness (Ct.Th) in 12-week-old Conv.R mice and GF mice (n = 9–10 mice/group). (I and J) μCT scanning measurements of Ct.Ar and Ct.Th in 12-week-old Conv.R mice treated with and without Abx (n = 8–10 mice/group). (K and L) μCT scanning measurements of BV/TV and Tb.Th in 7-month-old Conv.R mice treated with and without Abx (n = 10 mice/group). Data were expressed as mean ± SEM. All data were normally distributed according to the Shapiro-Wilk normality test. All data were analyzed by 2-way ANOVA and post hoc tests, applying Bonferroni’s correction for multiple comparisons. *P < 0.05, **P < 0.01, ***P < 0.001, and ****P < 0.0001 compared with the indicated group in the post hoc tests.
Figure 2
Figure 2. iPTH treatment fails to stimulate trabecular bone turnover in 12-week-old GF mice and conventional mice treated with antibiotics.
Mice were treated with iPTH or vehicle for 4 weeks. Mice were sacrificed and analyzed at 12 weeks of age. (A) Images are representative sections from Conv.R mice and GF mice displaying trabecular calcein double-fluorescence labeling. Original magnification ×20. (B and C) Trabecular MAR and trabecular bone formation rate per mm bone surface (BFR/BS) in Conv.R mice and GF mice (n = 9–10 mice/group). (D) Images are representative sections from Conv.R mice treated with and without antibiotics (Abx), displaying trabecular calcein double-fluorescence labeling. Original magnification ×20. (E and F) Trabecular MAR and BFR/BS in Conv.R mice treated with and without Abx (n = 8–10 mice/group). (G and H) The number of osteoblasts per mm bone surface (N.Ob/BS) and the percentage of bone surface covered by osteoblasts (Ob.S/BS) in trabecular bone from Conv.R mice and GF mice (n = 9–10 mice/group). (I and J) N.Ob/BS and Ob.S/BS in trabecular bone from Conv.R mice treated with and without Abx (n = 8–10 mice/group). (K and N) The images show tartrate-resistant acid phosphatase–stained (TRAP-stained) sections of the distal femur. Original magnification ×40. (L and M) The number of osteoclasts per mm bone surface (N.Oc/BS) and the percentage of bone surface covered by osteoclasts (Oc.S/BS) in trabecular bone from Conv.R mice and GF mice (n = 9–10 mice/group). (O and P) N.Oc/BS and Oc.S/BS in trabecular bone from Conv.R mice treated with and without Abx (n = 8–10 mice/group). (Q and R) Cortical MAR and BFR/BS in Conv.R mice treated with and without Abx (n = 8–10 mice/group). Data are expressed as mean ± SEM. All data were normally distributed according to the Shapiro-Wilk normality test and analyzed by 2-way ANOVA and post hoc tests, applying Bonferroni’s correction for multiple comparisons. *P < 0.05, **P < 0.01, ***P < 0.001, and ****P < 0.0001 compared with the indicated group in the post hoc tests.
Figure 3
Figure 3. iPTH treatment fails to regulate SC proliferation and life span, T cell expression of Wnt10b, number of Tregs, and BM production of TGF-β and IGF-1.
(A and B) SC proliferation as measured by thymidine incorporation (n = 8–10 mice/group). (C and D) SC apoptosis as measured by Caspase-3 activity (n = 5 mice/group). (E and F) mRNA levels of bone sialoprotein (Bsp), type 1 collagen (Col1), osteocalcin (Ocn), osterix (Osx), and Runx2, which are factors representative of the differentiation of SCs into osteoblasts (n = 5 mice/group). (G and H) Transcripts of genes that are specifically increased by Wnt signaling in SCs. The analyzed genes were aryl-hydrocarbon receptor (Ahr), Axin2, cysteine rich protein 61 (Cyr61), naked cuticle 2 homolog (Nkd2), transgelin (Tagln), transforming growth factor β3 (Tgfb3), thrombospondin 1 (Thbs1), Wnt1 inducible signaling pathway protein 1 (Wisp1), and Twist gene homolog 1 (Twist1) (n = 5 mice/group). (IL) Wnt10b mRNA levels in whole BM cells and sorted BM CD8+ T cells (n = 5 mice/group). (MP) PP and BM Tregs (TCR-β+CD4+Foxp3+ cells) (n = 8–10 mice/group). (Q and R) BM Tgfb1mRNA levels (n = 5 mice/group). (S and T) BM Igf-1 mRNA levels (n = 5 mice/group). Data were expressed as mean ± SEM. All data were normally distributed according to the Shapiro-Wilk normality test. All data were analyzed by 2-way ANOVA and post hoc tests, applying Bonferroni’s correction for multiple comparisons. **P < 0.01, ***P < 0.001, and ****P < 0.0001 compared with the indicated group in the post hoc tests.
Figure 4
Figure 4. Butyrate supplementation restores the capacity of iPTH to induce bone anabolism, stimulate bone turnover, expand Tregs, induce Wn10b expression, and upregulate the levels of Tgfβ1 and Igf1 in microbiota-depleted mice.
Mice treated with vehicle or iPTH, and butyrate (But) for 4 weeks, starting at 8 weeks of age. Mice were also treated with antibiotics (Abx) for 6 weeks, starting at 6 weeks of age. Mice were sacrificed and analyzed at 12 weeks of age. (A) Serum butyrate concentrations (n = 10 mice/group). (B and C) Bone volume fraction (BV/TV) and trabecular thickness (Tb.Th) (n = 10 mice/group). (D and E) Serum osteocalcin and CTX levels (n = 10 mice/group). (FH) PP and BM Tregs (TCR-β+CD4+Foxp3+ cells) (n = 10 mice/group). (I) BM CD8+ T cell Wnt10b mRNA levels (n = 5 mice/group). (J) BM Tgfb1 mRNA levels (n = 5 mice/group). (K) BM Igf-1 mRNA levels (n = 5 mice/group). Data were expressed as mean ± SEM. All data were normally distributed according to the Shapiro-Wilk normality test. All data were analyzed by 2-way ANOVA and post hoc tests, applying Bonferroni’s correction for multiple comparisons. *P < 0.05, **P < 0.01, ***P < 0.001, and ****P < 0.0001 compared with the indicated group in the post hoc tests.
Figure 5
Figure 5. Butyrate, but not PTH, directly stimulates Treg differentiation.
(A) Effect of butyrate on the number of Tregs in cultures of naive CD4+ T cells (n = 5/group). Figure shows 1 representative experiment of 3 experiments. (B) Effect of SCFAs (100 μM each) on the number of Tregs in cultures of naive CD4+ T cells (n = 4/group). (C and D) Effect of butyrate on Tgfβ1 and Igf-1 mRNA levels in cultures of BM cells (n = 4/group). Figure shows 1 representative experiment of 3 experiments. (E) Effect of PTH on the number of Tregs in cultures of naive CD4+ T cells (n = 5/group). (F and G) Number of Tregs in cocultures of untreated naive CD4+ T cells and DCs pretreated in vitro for 6 hours with butyrate or PTH (n = 4/group). Figure shows 1 representative experiment of 3 experiments. (H) Number of Tregs in cocultures of naive CD4+ T cells and DCs. In this experiment, 8-week-old Conv.R mice were treated with antibiotics for 4 weeks and iPTH or butyrate during the last 2 weeks. DCs and naive CD4+ T cells were sorted and cocultured (n = 9/group, from 2 separate experiments). In A, B, and E, the cultures were stimulated by anti-CD3 and anti-CD28 antibodies, IL-2, and TGF-β. In FH, the cultures were stimulated by anti-CD3 antibody and TGF-β. Data were expressed as mean ± SEM. In AG, data were analyzed by Kruskal-Wallis and Dunn’s multiple comparisons nonparametric tests, as they were not normally distributed as assessed by Shapiro-Wilk normality test. In H, data were normally distributed according to the Shapiro-Wilk normality test and analyzed by 1-way ANOVA and post hoc tests, applying Bonferroni’s correction for multiple comparisons. *P < 0.05, **P < 0.01, ***P < 0.001, and ****P < 0.0001 compared with the indicated group in the post hoc tests.
Figure 6
Figure 6. iPTH and butyrate fail to improve trabecular bone structure, stimulate bone turnover, expand Tregs, and induce Wn10b expression in 12-week-old GPR43–/– mice.
(A and B) μCT scanning measurements of bone volume fraction (BV/TV) and trabecular thickness (Tb.Th) (n = 10 mice/group). (C and D) Serum osteocalcin and CTX levels (n = 10 mice/group). (EG) PP and BM Tregs (TCR-β+CD4+Foxp3+ cells) (n = 10 mice/group). (H and I) Wnt10b mRNA levels in whole BM cells and sorted BM CD8+ T cells (n = 5 mice/group). In AI, GPR43–/– mice and WT littermates (GPR43+/+ mice) were treated with iPTH or vehicle for 4 weeks. Mice were sacrificed and analyzed at 12 weeks of age. (JL) BV/TV, Tb.Th, and serum osteocalcin in mice treated with vehicle or iPTH, and butyrate (But) for 4 weeks starting at 8 weeks of age. Mice were also treated with antibiotics (Abx) for 6 weeks, starting at 6 weeks of age. Mice were sacrificed and analyzed at 12 weeks of age (n = 5 mice/group). Data were expressed as mean ± SEM. All data were normally distributed according to the Shapiro-Wilk normality test. All data were analyzed by 2-way ANOVA and post hoc tests, applying Bonferroni’s correction for multiple comparisons. *P < 0.05, **P < 0.01, ***P < 0.001, and ****P < 0.0001 compared with the indicated group in the post hoc tests.
Figure 7
Figure 7. GPR43 signaling in DCs is required for iPTH treatment to improve trabecular structure, stimulate bone turnover, expand Tregs, and induce Wnt10b expression.
TCR-β–/– mice reconstituted with sorted splenic T cells from GPR43–/– or GPR43+/+ littermates were treated with either vehicle or iPTH for 4 weeks. Mice were sacrificed and analyzed at 12 weeks of age. (A and B) μCT scanning measurements of trabecular bone volume fraction (BV/TV) and trabecular thickness (Tb.Th) (n = 10 mice/group). (C and D) Serum levels of osteocalcin and CTX (n = 10 mice/group). (E and F) PP and BM Tregs (CD4+Foxp3+ cells) (n = 10 mice/group). (G and H) Wnt10b mRNA levels in whole BM cells and sorted BM CD8+ T cells (n = 5 mice/group). (I) Number of Tregs in cultures of naive CD4+ T cells from WT or GPR43–/– in the presence of butyrate (n = 5 /group). (J) Number of Tregs in cocultures of WT naive CD4+ T cells, and WT or GPR43–/– DCs pretreated with butyrate (n = 5/group). (K) Number of Tregs in cocultures in naive CD4+ T cells and DCs. WT and GPR43–/– mice were treated with antibiotics for 4 weeks and iPTH or butyrate during the last 2 weeks (n = 10/group, from 2 separate experiments). In I, the cultures were stimulated by anti-CD3 and anti-CD28 antibodies, IL-2, and TGF-β. In JK, the cultures were stimulated by anti-CD3 antibody and TGF-β. Data were expressed as mean ± SEM. All data were normally distributed according to the Shapiro-Wilk normality test. Data in AJ were analyzed by 2-way ANOVA and post hoc tests, applying the Bonferroni’s correction for multiple comparisons. Data in K were analyzed by 1-way ANOVA and post hoc tests, applying Bonferroni’s correction for multiple comparisons *P < 0.05, **P < 0.01, ***P < 0.001, and ****P < 0.0001 compared with the indicated group in the post hoc tests.

Comment in

References

    1. Wein MN, Kronenberg HM. Regulation of bone remodeling by parathyroid hormone. Cold Spring Harb Perspect Med. 2018;8(8):a031237. doi: 10.1101/cshperspect.a031237. - DOI - PMC - PubMed
    1. Miao D, He B, Karaplis AC, Goltzman D. Parathyroid hormone is essential for normal fetal bone formation. J Clin Invest. 2002;109(9):1173–1182. doi: 10.1172/JCI14817. - DOI - PMC - PubMed
    1. Iida-Klein A, et al. Short-term continuous infusion of human parathyroid hormone 1-34 fragment is catabolic with decreased trabecular connectivity density accompanied by hypercalcemia in C57BL/J6 mice. J Endocrinol. 2005;186(3):549–557. doi: 10.1677/joe.1.06270. - DOI - PubMed
    1. Bilezikian JP. Primary hyperparathyroidism. J Clin Endocrinol Metab. 2018;103(11):3993–4004. doi: 10.1210/jc.2018-01225. - DOI - PMC - PubMed
    1. Potts J. Chapter 13. In: Avioli LV, Krane S, eds. Metabolic Bone Diseases. San Diego, CA: Academic Press; 1998:411–442.

Publication types