. 2020 Apr 1;130(4):1912-1930.
doi: 10.1172/JCI133737.

Type I interferon response drives neuroinflammation and synapse loss in Alzheimer disease

Affiliations

Type I interferon response drives neuroinflammation and synapse loss in Alzheimer disease

Ethan R Roy et al. J Clin Invest. .

Abstract

Type I interferon (IFN) is a key cytokine that curbs viral infection and cell malignancy. Previously, we demonstrated a potent IFN immunogenicity of nucleic acid-containing (NA-containing) amyloid fibrils in the periphery. Here, we investigated whether IFN is associated with β-amyloidosis inside the brain and contributes to neuropathology. An IFN-stimulated gene (ISG) signature was detected in the brains of multiple murine Alzheimer disease (AD) models, a phenomenon also observed in WT mouse brain challenged with generic NA-containing amyloid fibrils. In vitro, microglia innately responded to NA-containing amyloid fibrils. In AD models, activated ISG-expressing microglia exclusively surrounded NA+ amyloid β plaques, which accumulated in an age-dependent manner. Brain administration of rIFN-β resulted in microglial activation and complement C3-dependent synapse elimination in vivo. Conversely, selective IFN receptor blockade effectively diminished the ongoing microgliosis and synapse loss in AD models. Moreover, we detected activated ISG-expressing microglia enveloping NA-containing neuritic plaques in postmortem brains of patients with AD. Gene expression interrogation revealed that IFN pathway was grossly upregulated in clinical AD and significantly correlated with disease severity and complement activation. Therefore, IFN constitutes a pivotal element within the neuroinflammatory network of AD and critically contributes to neuropathogenic processes.

Keywords: Alzheimer’s disease; Immunology; Innate immunity; Neuroscience; Synapses.


Conflict of interest statement

Conflict of interest: The authors have declared that no conflict of interest exists.

Figures

Figure 1
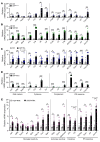
Figure 1. Prevalent IFN pathway activation in mouse models of brain amyloidosis.
(AD) Transcriptional analysis of gliosis, inflammation, and IFN pathway markers in hippocampal tissues from 4 Aβ mouse models. (A) APPNL-G-F (6 months old, n = 4–5 mice/genotype), (B) 5XFAD (6 months old, n = 4–5 mice/genotype), (C) APP;tTA (18 months old, n = 10 mice/genotype), and (D) APP-PS1 (6.5 months old, n = 3 mice/genotype). (E) WT mice received RNA-containing amyloid (as depicted in Figure 2A) (n = 7 mice) or control preparation (n = 4 mice) via stereotaxic administration. Transcriptional analysis of hippocampi was performed and results from ipsilateral tissues are shown. Analysis of both contralateral and ipsilateral tissues is also presented in Supplemental Figure 6. For all panels, data are presented as mean ± SEM. *P < 0.05, **P < 0.01, ***P < 0.001 by 2-sided t tests.
Figure 2
Figure 2. Nucleic acid–containing amyloid activates the IFN pathway by stimulating microglia in vitro.
(A) Generation and treatment of generic amyloid composed of soluble protein oligomers (oHSA) and anionic cofactors (heparin or RNA) to organotypic hippocampal slice cultures. Quantification of CD68+ relative occupancy in Iba1+ microglia (n = 5–6 slices/treatment), transcript analysis (n = 5–16 slices/treatment), and secreted cytokine measurement (n = 2–11 supernatants/treatment) is presented. Slices derived from approximately 2–5 animals were used for each treatment group. Microglial CD68 staining is also shown in Supplemental Figure 1. (B) Quantification of Ifnb1 mRNA, secreted IFN-β, and CXCL10 in mixed glial cultures stimulated for 6 hours with RNA-containing amyloid or control mixture; n = 3 samples/treatment. Full results of additional interferon subtypes and with control treatments are shown in Supplemental Figure 4. (C) Levels of secreted CXCL10 and TNF-α from stimulated primary microglial cultures; n = 3 samples/treatment. For all panels, data are presented as mean ± SEM. *P < 0.05, **P < 0.01, ***P < 0.001 by 1-way ANOVA with Sidak’s correction (A), 2-sided t tests (B), or 2-way ANOVA with Tukey’s correction (C).
Figure 3
Figure 3. Nucleic acid–containing Aβ plaques engage microglia in AD brain.
(A) Representative confocal images of Aβ plaques in 5XFAD brain colabeled with a polyclonal antibody against human Aβ and fluorescent probes to detect nucleic acids. Insets show single- or dual-channel images of areas within dashed squares. Scale bar: 15 μm. (B) Representative confocal images of Aβ plaques in subicula of 3-month-old 5XFAD mice triple-labeled with monoclonal antibody 6E10 against Aβ, AO, and Clec7a, showing recruitment of Clec7a+ microglia to AO+ plaques (yellow arrowheads) versus AO plaques (white arrowheads). White signal represents overlap of all 3 channels. Scale bars: 10 μm. Number of Clec7a+ cells surrounding plaque subtypes is quantified (n = 85 plaques from 3 animals). Mean ± SEM; ***P < 0.001 by 2-sided t test. (C and D) Representative confocal images of Aβ (6E10), AO, and Clec7a in 5XFAD mice at 3 ages with quantification of AO+ plaque prevalence (3 months old, n = 208 plaques from 3 animals; 6.5 months old, n = 198 plaques from 3 animals; 10 months old, n = 324 plaques from 3 animals) (C), and in other Aβ mouse models (n = 2–4 mice per strain) (D). White signal represents overlap of all 3 channels. Scale bars: 10 μm.
Figure 4
Figure 4. IFN pathway activation is manifested in plaque-associated microglia in AD model.
(A) Representative confocal image of an Iba1+Clec7a+ microglia and an Iba1+Clec7a microglia (top) in relation to a methoxy-X04+ plaque in 5XFAD brain (3 months old) showing different levels of Stat1 expression (bottom). Cell body outlines (dashed lines) are superimposed on the Stat1/X04 merged image in the bottom panel for ease of visualization. Scale bar: 10 μm. (B) Heatmap of ISG expression determined by RNA-seq in sorted Clec7a+ and Clec7a microglia from APP-PS1 versus control mice (n = 6, 9 months old). P less than 0.05 was considered significant (2-sided t tests). All individual ISGs with significant differential expression are listed on the right. GEO accession GSE101689.
Figure 5
Figure 5. IFN activates microglia, initiates neuroinflammation, and leads to synapse loss.
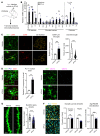
(A) Schematic of rIFN-β administration into WT mice via bilateral intracerebroventricular (i.c.v.) stereotaxic injection. (B) Transcriptional analysis of ISGs, microglial markers, and cytokines in cortical tissue of mice 36 hours after vehicle (n = 6 mice) or rIFN-β (n = 5 mice) injection. (C) Representative confocal images of CD68 and 3D skeletonization of Iba1+ microglia from hippocampi (CA1) of vehicle- and rIFN-β–injected mice. Scale bar: 10 μm. Total dendrite length of microglia (n = 135–192 cells from 5–6 mice/treatment) and CD68+ occupancy (percentage of Iba1+ cell volume; n = 5–6 mice/treatment) is quantified. Additional analysis is shown in Supplemental Figure 15. (D) Left: Representative confocal images of Stat1, Iba1, and PU.1 on brain tissues from vehicle- and rIFN-β–injected mice. Insets show Stat1 single-channel images of areas within dashed squares, with PU.1+ nuclear areas outlined. Stat1 occupancy within PU.1+ nuclei is quantified (n = 3 mice/treatment). Right: Representative images of Iba1 and Clec7a in treated mice (n = 5–6 mice/treatment). Scale bars: 10 μm. (E) Representative high-magnification confocal images of CA1 dendritic spines and quantification of spine density in Thy1-eGFP mice that received bilateral i.c.v. administration of vehicle (n = 44 dendrites from 2 mice) or rIFN-β (n = 73 dendrites from 3 mice) for 36 hours. Scale bar: 1 μm. (F) Representative high-magnification confocal images of pre- and postsynaptic terminals labeled by synaptophysin (Syp) and PSD95, respectively, in hippocampi (CA1) of vehicle- and rIFN-β–injected mice. Scale bar: 2 μm. Quantification of puncta density for both synaptic compartments, and of degree of colocalization between the 2 markers; n = 5–6 mice/treatment. For all panels, data are presented as mean ± SEM, or median and quartiles (dendrite length). *P < 0.05, **P < 0.01, ***P < 0.001 by 2-sided t tests.
Figure 6
Figure 6. IFN blockade dampens microglial activation in AD model.
(A) Schematic of brain IFNAR blockade in control and 5XFAD mice (3 months old) by i.c.v. administration of mIgG1 (20 μg; n = 6 control, n = 6 5XFAD) or αIFNAR antibody (20 μg; n = 5 control, n = 6 5XFAD) for 6 days (left). Quantification of nuclear Stat1 levels in PU.1+ microglial nuclei and PU.1 nonmicroglial nuclei in subicula of treated mice; n = 3–5 mice/group (right). (BD) Representative staining and 3D skeletonization of Clec7a+ microglia surrounding plaques in subicula of treated mice (B and C). White signal represents overlap of all 3 channels. Scale bars: 10 μm. Quantifications of total percentage of Iba1+ and CD68+ area, microglial dendrite length (n = 46–185 cells/group), Clec7a+ signal occupancy per microglia, and plaque load in subicula of treated mice (n = 5–6 mice/group) (D). Additional analysis is shown in Supplemental Figure 17. For all panels, data are presented as mean ± SEM, or median and quartiles (dendrite length). **P < 0.01, ***P < 0.001 by 1-way ANOVA with Sidak’s correction, or 2-sided t test (plaque load).
Figure 7
Figure 7. IFN blockade rescues synapse loss in AD model.
(A and C) Representative high-magnification images of pre- and postsynaptic terminals labeled against synaptophysin and PSD95, respectively, in subicula of control or 5XFAD mice treated with mIgG1 or αIFNAR as described in Figure 6A (A). Scale bar: 4 μm. Quantification of relative puncta density for both synaptic compartments, and of degree of colocalization between the 2 markers; n = 2–5 mice/group (C). (B and D) Representative high-magnification images of subicular microglia costained with synaptic markers in treated mice, showing engulfment of synaptic terminals (B). Scale bars: 4 μm. Quantification of engulfed puncta densities for both synaptic markers, normalized to total cell volumes; n = 2–5 mice/group (D). For all panels, data are presented as mean ± SEM. *P < 0.05, **P < 0.01, ***P < 0.001 by 1-way ANOVA with Sidak’s correction.
Figure 8
Figure 8. IFN stimulates complement cascade activation.
(A) Expression of complement transcripts and secreted C3 in slice cultures (n = 12 slices and n = 6–7 supernatants/treatment). Slices derived from approximately 2–5 animals were used for each treatment. (B) The levels of pStat1 and C3 proteins in mixed glial cultures treated with vehicle or 5 ng/mL rIFN-β in vitro (representative immunoblots from 2 independent experiments). (C) Expression of complement transcripts in brain tissue and quantification of C3 protein expression within GFAP+ astrocytes in mice injected with vehicle or rIFN-β in the experiment described in Figure 5A. (D) Levels of C3 mRNA and secreted C3 in hippocampal slices stimulated with generic amyloids and respective controls (n = 5–16 slices and n = 4–11 supernatants/treatment; experiment illustrated in Figure 2A). Slices derived from approximately 2–5 animals were used for each treatment group. (E) The levels of pStat1 and C3 proteins in mixed glial cultures treated with RNA-containing amyloid or control (representative immunoblots from 2 independent experiments). (F) Expression of complement transcripts in hippocampi of WT mice administered RNA-containing amyloid or control preparation in the experiment described in Figure 1E. (G) Expression of C3 mRNA (n = 5–6 slices/treatment) and secretion of C3 and CXCL10 (n = 8 supernatants/treatment) in hippocampal slices stimulated with RNA-containing amyloid or control preparation in the presence of either mIgG1 or αIFNAR antibody. Slices derived from approximately 2–5 animals were used for each treatment group. For all panels, data are presented as mean ± SEM. *P < 0.05, **P < 0.01, ***P < 0.001 by 2-sided t tests (A, C, F), or 1-way ANOVA with Sidak’s correction (D, G).
Figure 9
Figure 9. IFN orchestrates C3-dependent synapse elimination.
(A) Expression of C3 and Ifi27l2a mRNA in hippocampi of control or APPNL-G-F mice (10 to 12 months old) after i.c.v. injection with mIgG1 control (20 μg; n = 4 control, n = 7 APPNL-G-F) or αIFNAR antibody (20 μg; n = 3 control, n = 8 APPNL-G-F) for 6 days. Additional analysis is shown in Supplemental Figure 20. (B and C) Representative confocal images of GFAP, C3, and Aβ (6E10) in control or 5XFAD mice (3 months old) treated with IgG1 or αIFNAR antibody in the experiment described in Figure 6. Scale bar: 30 μm. Inset shows C3 signal within outlined cell body. Scale bar: 6 μm. See Supplemental Figure 18 for full images. C3 occupancy in astrocytes in treated mice is quantified (C). (D and E) WT and C3 null mice were treated with bilateral i.c.v. administration of vehicle (n = 3 WT, n = 4 C3–/–) or rIFN-β (n = 3 WT, n = 5 C3–/–) for 36 hours, similarly to the experiment in Figure 5A. (D) Quantification of relative puncta density for pre- and postsynaptic compartments (synaptophysin and PSD95, respectively), and of degree of colocalization between the 2 markers, in hippocampus (CA1). (E) Quantification of synaptic puncta densities engulfed by microglia for both synaptic markers, normalized to total cell volumes; n = 3–5 mice/group. Additional analysis of microglial reactivity is shown in Supplemental Figure 24. For all panels, data are presented as mean ± SEM. *P < 0.05, **P < 0.01, ***P < 0.001 by 1-way ANOVA with Sidak’s correction.
Figure 10
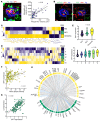
Figure 10. IFN pathway activation is manifested in human AD.
(A) Examination of IBA1+ microglia surrounding neuritic plaques in human AD specimens (n = 3). Plaques were stained with Aβ (6E10) and nucleic acids with acridine orange (AO). Correlation analysis was performed with the total cell volume of recruited microglia and the level of AO+ signal inside plaques (n = 54 plaques from 3 AD cases; r = 0.68, P < 0.0001). Scale bar: 10 μm. Additional representative images are shown in Supplemental Figure 25. (B) Representative confocal images of neuritic plaque-associated microglia in human AD cases (n = 3) expressing ISGs: IFITM3 (left) and AXL (right). Insets show single-channel images of outlined areas. Scale bar: 10 μm. Signals in microglia from plaque-free areas are shown in Supplemental Figure 27. (C and D) Heatmaps showing group-averaged expression of human ISGs in postmortem brain tissue (parahippocampal gyrus) from 175 human subjects stratified by clinical dementia rating (CDR) (C) and Braak score (D). NCI indicates no cognitive impairment; MCI, mild cognitive impairment. Individual ISGs with differential expression are highlighted. See also Supplemental Figure 28 for other brain regions. (E and F) Correlations of IRF7 transcript level with CDR, Braak score (E), and mean neuritic plaque density (F). (G) Correlation of IRF7 transcript level with C3 transcript level. (H) Coexpression analysis between IFN pathway genes (yellow) and complement genes (green). Links inside the circle represent significant (P < 0.8 × 10⁻⁵) Spearman correlation coefficients between the genes (gray: r > 0.6; blue: r < 0.6). Coexpression analysis between IFN pathway genes and random gene sets is shown in Supplemental Figure 30 as a control. For A, E, F, and G, correlation coefficients (r) were computed using Pearson correlations (A, F, G) or Spearman correlations (E). All: P <0.0001. For A, F, and G, plots display one dot for each plaque (A) or subject (F, G), and linear regression line (solid) with 95% CI (dashed).

Comment in

References

    1. Perlmutter D. Preventing Alzheimer’s disease. J Am Coll Nutr. 2016;35(8):732–733. doi: 10.1080/07315724.2015.1116900. - DOI - PubMed
    1. Hodson R. Alzheimer’s disease. Nature. 2018;559(7715):S1. doi: 10.1038/d41586-018-05717-6. - DOI - PubMed
    1. Heppner FL, Ransohoff RM, Becher B. Immune attack: the role of inflammation in Alzheimer disease. Nat Rev Neurosci. 2015;16(6):358–372. doi: 10.1038/nrn3880. - DOI - PubMed
    1. McNab F, Mayer-Barber K, Sher A, Wack A, O’Garra A. Type I interferons in infectious disease. Nat Rev Immunol. 2015;15(2):87–103. doi: 10.1038/nri3787. - DOI - PMC - PubMed
    1. Capobianchi MR, Uleri E, Caglioti C, Dolei A. Type I IFN family members: similarity, differences and interaction. Cytokine Growth Factor Rev. 2015;26(2):103–111. doi: 10.1016/j.cytogfr.2014.10.011. - DOI - PMC - PubMed

Publication types

MeSH terms